Identification of a Schizophrenia-Associated Functional Noncoding Variant in NOS1AP
Abstract
Objective: The authors previously demonstrated significant association between markers within NOS1AP and schizophrenia in a set of Canadian families of European descent, as well as significantly increased expression in schizophrenia of NOS1AP in unrelated postmortem samples from the dorsolateral prefrontal cortex. In this study the authors sought to apply novel statistical methods and conduct additional biological experiments to isolate at least one risk allele within NOS1AP . Method: Using the posterior probability of linkage disequilibrium (PPLD) to measure the probability that a single nucleotide polymorphism (SNP) is in linkage disequilibrium with schizophrenia, the authors evaluated 60 SNPs from NOS1AP in 24 Canadian families demonstrating linkage and association to this region. SNPs exhibiting strong evidence of linkage disequilibrium were tested for regulatory function by luciferase reporter assay. Two human neural cell lines (SK-N-MC and PFSK-1) were transfected with a vector containing each allelic variant of the SNP, the NOS1AP promoter, and a luciferase gene. Alleles altering expression were further assessed for binding of nuclear proteins by electrophoretic mobility shift assay. Results: Three SNPs produced PPLDs >40%. One of them, rs12742393, demonstrated significant allelic expression differences in both cell lines tested. The allelic variation at this SNP altered the affinity of nuclear protein binding to this region of DNA. Conclusions: The A allele of rs12742393 appears to be a risk allele associated with schizophrenia that acts by enhancing transcription factor binding and increasing gene expression.
Schizophrenia (SCZD, OMIM 181500) is a serious neuropsychiatric illness estimated to affect approximately 1% of the general population. Family, twin, and adoption studies have demonstrated that schizophrenia is predominantly a genetic disorder, with a high heritability (1) . Multiple genetic and nongenetic factors are likely to be involved (2) . As part of a genome-wide search for loci contributing to risk for schizophrenia, we previously reported linkage, with a maximum heterogeneity lod score of 6.5, to chromosome 1q21-22 (SCZD9, OMIM 604906) in a group of 22 medium-sized Canadian families selected for study because multiple relatives were clinically diagnosed with schizophrenia or schizoaffective disorder (3 , 4) . Other studies have also reported linkage (5 – 8) and linkage disequilibrium (LD) (9 , 10) of schizophrenia to this region. We previously tested markers from this region for evidence of LD to schizophrenia in our Canadian families, identifying significant LD with three markers within the gene for NOS1AP (nitric oxide synthase 1 [neuronal] adaptor protein; formerly known as CAPON) (11) . The same allele for two of these markers was recently reported to be associated in a South American population isolate (12) . Association of different single nucleotide polymorphisms (SNPs) within NOS1AP to schizophrenia also has been reported in a Han Chinese sample (13) .
NOS1AP is an attractive candidate for schizophrenia susceptibility. NOS1AP was first identified in the rat as a neuronal nitric oxide synthase (nNOS) binding protein, capable of disrupting the association of nNOS with the postsynaptic density scaffolding proteins PSD93 and PSD95 through the binding of the C-terminus of NOS1AP to nNOS (14) . The interaction between nNOS and PSD93 and PSD95 is important in targeting nNOS to the postsynaptic N -methyl- d -aspartate receptor (NMDAR) complex and facilitates the tight coupling between activation of the NMDAR and nNOS, allowing nNOS activation by Ca ++ influx through the NMDAR, producing NMDAR-mediated NO release into the synaptic structures (15) . This places NOS1AP at the scene of NMDAR glutamate neurotransmission, long proposed to be involved in schizophrenia (16) .
NOS1AP is a large gene, with a genomic extent of approximately 300 kb. Sequencing of the 1.5 kb coding region of NOS1AP in individuals from the Canadian linkage sample has failed to identify any coding mutations associated with illness (11) , suggesting that important regulatory mutations could be present within the noncoding sequence of this gene. We have reported significantly increased expression of NOS1AP in postmortem samples from Brodmann’s area 46 of the dorsolateral prefrontal cortex of individuals with schizophrenia and bipolar disorder relative to psychiatrically normal comparison subjects (17) , further supporting a role for NOS1AP misexpression in schizophrenia susceptibility. To more comprehensively survey NOS1AP for association with schizophrenia in our Canadian families, we have now genotyped a total of 60 SNPs from this gene and analyzed them using a novel analysis technique, the posterior probability of linkage disequilibrium (PPLD). We have conducted functional assessments of the SNPs with the highest probabilities of being in LD with schizophrenia and have identified a specific sequence change that causes significantly increased gene expression, implicating the A allele of rs12742393 as a schizophrenia risk allele.
Method
Linkage and Association Subjects
The subjects for this study were used in our prior association study of NOS1AP(11) . The sample consisted of 24 Canadian families of Celtic (N=23) or German (N=1) descent, recruited for study because schizophrenic illness appeared to be segregating in a unilineal (one side of the family) autosomal dominant-like manner. After complete description of the study to the subjects, written informed consent was obtained. Protocols were approved by the institutional review boards of Rutgers University, University of Toronto, and the Centre for Addiction and Mental Health (Toronto). For this study, we used a narrow definition of schizophrenia: only the 85 individuals with a diagnosis of schizophrenia or chronic schizoaffective disorder were coded as affected; 232 individuals were coded as unaffected, including 40 with the spectrum diagnoses of nonaffective psychotic disorder, schizotypal personality disorder, and paranoid personality disorder. DNA samples were available for 332 subjects. Subjects with available DNA but no assessment data were coded phenotype unknown. The ascertainment and assessment procedures and composition of the sample have been described elsewhere in greater detail (4 , 11 , 18 , 19) .
SNP Selection and Genotyping
We selected tag SNPs to cover the entire genomic extent of NOS1AP , including 41 kb 5′ and 15 kb 3′ of the untranslated regions (UTRs). SNPs were chosen from the Perlegen database, which groups SNPs into LD bins based on r 2 (http://genome.perlegen.com/), and the Applera SNPbrowser program, version 3 (http://www.applera.com/), which chooses SNPs on the basis of LD units (LDUs) created with the measure r. First, one tag SNP was selected from each Perlegen LD bin containing two or more SNPs. To enhance our chances of locating a mutation in a regulatory region, we chose SNPs in close proximity to evolutionarily conserved sequences whenever possible. These were identified using a MultiPipMaker (20) alignment of sequence from the human, chimpanzee, pig-tailed macaque, mouse, rat, dog, and opossum genomes, including 50 kb 5′ and 3′ of the gene. Regions were deemed to be conserved if the sequence showed ≥70% identity over 100 bp. This set was further supplemented by several novel SNPs detected by resequencing of evolutionarily conserved regions within a set of 16 founders from our sample. We imported all these SNPs into SNPbrowser and selected additional SNPs to a final density of one SNP per 0.33 LDUs. Fifteen SNPs from our previous study of NOS1AP(11) were included in this calculation of coverage but were not retyped.
DNA was extracted from blood samples or lymphoblastoid cell lines using the GenePure system (Gentra Systems, Minneapolis). Thirty-eight SNPs were genotyped by a primer extension strategy (pyrosequencing) and were typed as simplex assays using the automated PSQ HS96A platform (21) ; analysis of 15 of these by a different statistical method has been reported elsewhere (11) . Twenty-two SNPs were genotyped by ligase detection reaction and Luminex 100 flow cytometry (22 , 23) . Reaction conditions were as previously described (11 , 22) . A list of all SNPs genotyped, their locations, and all genotyping primer sequences is provided in Tables S1–S5 in the data supplement that accompanies the online edition of this article.
SNP genotypes were checked for Mendelian errors with Pedcheck, version 1.1 (24) , and were merged with existing genotype data from five microsatellites from the region (11) and analyzed with Merlin, version 0.10.2 (25) , for unlikely genotypes based on high-order recombination. Overall, less than 1% of genotypes were identified as potential errors, and these were regenotyped twice, resulting in 40 unresolved genotypes (0.17%) which were excluded from further analysis. Approximately 4% of attempted genotypes were unavailable because of failure of genotyping assays.
Linkage Disequilibrium Analysis
The PPLD is a variant of the LD-PPL, or posterior probability of linkage allowing for LD (26) ; both are variants of the PPL (27 – 29) , which directly measures the probability of linkage between a trait and a given chromosomal location. Inclusion of an LD parameter in the underlying PPL likelihood allows for the possibility of trait-marker LD. It is then straightforward to condition on “linkage” while modeling LD by rescaling the LD-PPL (30) . In this way we can disaggregate LD evidence from the underlying linkage evidence at any given locus. This is key here because the multipoint PPL is 99.7% over NOS1AP (31) , where 100% would represent statistical certainty of linkage. Thus, any measure that confounded linkage and LD would be expected to find effects even in the absence of LD.
Specifically, the PPLD has the following form: where D ′ is the standardized LD parameter (32) ; θ is the recombination fraction; γ is a vector of trait parameters, in this case comprising the parameters of an approximating single-locus model allowing for locus heterogeneity (disease allele frequency, three penetrances, and the admixture parameter α [33] ); L is the likelihood; and f(D′, θ, γ) is the prior probability distribution for the parameters. The prior distributions are essentially uniform, except for the priors on D′ and θ, which allow for LD only for very small values of θ (see references 26 , 30 for details) and assign a nonzero point mass over D′=0. All PPLD calculations were conducted using the software package KELVIN (34) .

The PPLD integrates over the trait parameters rather than maximizing over them or fixing them at specific values. It also makes full use of all pedigree data. It intrinsically measures LD due only to close physical proximity (or perhaps epistasis), and it has been shown to be robust to departures from Hardy-Weinberg equilibrium at the marker (26) .
In computing the usual form of the PPL, the prior probability of linkage is set to 2% on the basis of theoretical calculations (35) . For comparability of scale, therefore, we also set the prior probability of LD given linkage to 2% (so that the joint prior probability of linkage and LD is just 0.04%). Values of the PPLD <2% therefore represent evidence against LD in the presence of linkage, while values >2% indicate evidence in favor of LD in the presence of linkage. As with any form of the PPL, the PPLD has a direct interpretation as a probability: a PPLD of, say, 25% can be interpreted in the same way as a 25% probability of rain, of winning a bet, or of a successful medical intervention.
The PPLD applies to one SNP at a time (two-point analysis) and measures the evidence for or against LD to that SNP. As a measure of evidence, the PPLD does not require “correction” for multiple testing, any more than, say, measurements of length for various pieces of rope would require “correction” as a function of the number of pieces measured. On the other hand, the very small prior probability implicit in the calculation effectively adjusts for the biological fact that even at a linked locus, any given SNP may have only a very small chance of exhibiting LD. If the true prior probability of LD is in fact higher than 2% for SNPs within NOS1AP , then our measure of evidence in favor of LD would be conservative.
Postmortem Expression Analysis
Samples from the Stanley Array Collection of the Stanley Brain Collection (http://www.stanleyresearch.org/programs/brain_collection.asp) were analyzed. This is a collection of biomaterials derived from postmortem brain specimens from 35 individuals with schizophrenia, 34 individuals with bipolar disorder, and 35 psychiatrically normal comparison subjects. We have previously quantified and reported NOS1AP expression levels in Brodmann’s area 46 of the dorsolateral prefrontal cortex from these samples by real-time polymerase chain reaction (PCR) and normalization to beta-actin (17) . Genotypes for rs12742393 for these samples were determined by ligase detection reaction assay. The dependence of NOS1AP short isoform expression on genotype was tested with analysis of variance controlling for storage time, as suggested in our earlier reported work (17) .
Luciferase Reporter Assay
Segments of the NOS1AP gene were tested for regulatory function in the human neural cell lines SK-N-MC and PFSK-1 (ATCC, Manassas, Va.). Endogenous NOS1AP expression was confirmed in these cell lines by reverse-transcriptase PCR. The dual luciferase reporter (DLR) assay (Promega, Madison, Wisc.) was used to test noncoding regions of the NOS1AP gene for function. This assay measures the amount of luciferase protein generated in cells transfected with a vector (pGL3) containing a firefly luciferase (luc) gene and the putative regulatory sequences to be tested for function. To test putative regulatory sequences in conjunction with the native NOS1AP promoter, a 1.3 kb sequence including the 5′UTR of NOS1AP and 800 bp 5′ to the UTR was cloned into the Nco I site of the pGL3-Basic plasmid (Promega). Test sequences of approximately 850 bp to 1.4 kb in length surrounding each SNP were then cloned into the Hind III site 5′ to the NOS1AP promoter sequence (see Table S6 in the online data supplement). These plasmids were co-transfected with the Renilla luc plasmid (phRL-null) for normalization purposes in a 50:1 ratio to minimize trans effects between the plasmids; approximately 0.8 μg plasmid DNA was transfected per assay. For both cell lines, cells were plated onto 24 well plates and grown until 70% confluent. The plasmids were then transfected with lipofectamine 2000 using the standard protocol (Invitrogen, Carlsbad, Calif.). Twenty-four hours after transfection, the plates were assayed for luciferase expression on a luminometer (Turner BioSystems, Sunnyvale, Calif.) following the standard DLR protocol.
Experiments on each plasmid were conducted in three or four parallel replicates; these replicate experiments were then repeated on three separate occasions (four for rs4145621 in PFSK-1). The controls included were a nontransfected control for background luminescence of the plate and cells; the pGL3-Basic plasmid for background luminescence from the empty vector; and the pGL3-Enhancer plasmid, which contains the SV40 promoter and enhancer sequences and was used as a positive control. After subtracting the background luminescence, the log of the ratio of firefly to Renilla luciferase values was fitted to a linear model incorporating both “occasion” blocks and plasmid effects. Linear contrasts were tested in the context of this model.
Electrophoretic Mobility Shift Assay
Nuclear extracts were prepared from cultured SK-N-MC and PFSK-1 cells using the Panomics (Fremont, Calif.) Nuclear Extraction Kit (AY2002). Various amounts of SK-N-MC and PFSK-1 nuclear extract (0.25, 0.40, 0.50, 1.0, and 1.5 μg) were incubated with 10 ng of biotin-labeled oligonucleotide sense probe for either the A or C allele with 1 μg of Poly d(I-C) for 5 minutes at room temperature; 2 μl of 5× binding buffer and 10 ng of biotin-labeled probes were then added to a final volume of 10 ml and incubated for 30 minutes at 20°C. For competition assays, 100-fold molar excess unlabeled probe was added to the mixture prior to the 30-minute incubation. The protein/DNA complex was then UV cross-linked and separated on a nondenaturing 6% acrylamide gel in 0.5× Tris-borate-EDTA buffer and wet-transferred onto a Biodyne nylon membrane (Pall Corporation, East Hills, N.Y.), which was exposed to a HyBlot CL Autoradiography film (Denville Scientific, South Plainfield, N.J.) for chemiluminescence detection. Probe sequences for rs12742393 were: A allele—GCATTTTACCAGTACAATCTG; C allele—GCATTTTACCCGTACAATCTG.
Results
Linkage Disequilibrium Analysis
A total of 66 SNPs were initially selected for genotyping, although six of these (rs6664602, rs164041, rs164188, rs4417045, rs2819308, and rs429414) did not display any variation within this sample and were excluded from further analysis. After the monomorphic markers were removed, the largest gap on the LD map was 0.9 LDUs, calculated by SNPbrowser. The PPLD for each of the 60 polymorphic SNPs is plotted in Figure 1 (see also Table S1 in the online data supplement). PPLD values range from 0.5% (evidence against LD; rs1508262 and rs347313) to 49.7% (rs1415263). Fifty-six of the markers produced PPLD values less than 6%, one produced a value of 15%, and three produced values greater than 40% (41.9% for rs12742393, 44.5% for rs4145621, and 49.7% for rs1415263). These three markers exhibit strong LD with each other (r 2 =0.734 for rs1415263–rs4145621; r 2 =0.731 for rs1415263–rs12742393; and r 2 =0.789 for rs4145621–rs12742393). Not surprisingly, these markers had lower r 2 values with all other markers analyzed (see Figure S1 in the online data supplement). The alleles in LD with schizophrenia were C for rs1415263, T for rs4145621, and A for rs12742393.

a Zero on the x-axis corresponds to 160.25 Mb on the genome assembly build 36 of chromosome 1; all SNP names and positions are listed in Table S1 in the online data supplement. The genomic structure of NOS1AP is depicted below the x-axis. Exons are represented by numbered segments; 5′ and 3′ UTRs (untranslated regions) are represented by half-height segments. Only four SNPs, all falling within the second intron, had PPLDs of over 6%; those SNPs, listed from 5′ to 3′, were rs1415263 (49.7%), rs4145621 (44.5%), rs12742393 (41.9%), and rs10800404 (15.1%).
Postmortem Expression Analysis
We previously reported (17) significantly increased expression of NOS1AP in postmortem samples from Brodmann’s area 46 of the dorsolateral prefrontal cortex in individuals carrying at least one copy of the schizophrenia-associated allele at rs1415263 or rs4145621. This increased expression was observed without regard to diagnosis (schizophrenia, bipolar disorder, or psychiatrically normal comparison subject). Similarly, samples from individuals carrying at least one copy of the schizophrenia-associated (A) allele at rs12742393 showed significantly higher NOS1AP expression than individuals homozygous for the nonassociated (C) allele when controlling for storage time (p=0.0399, mean difference=0.39, 95% confidence interval=0.02–0.76). Inclusion of storage time as a covariate did not affect statistical significance.
Luciferase Reporter Assay
The three noncoding SNPs with PPLDs greater than 40% were tested for potential regulatory activity using the DLR assay in the neural cell lines SK-N-MC and PFSK-1. The results of the transfection experiments are summarized in Figure 2 and in Table S7 in the online data supplement. While differences in growth rate and response to transfection between SK-N-MC and PFSK-1 produced different absolute expression ratios, the same patterns of expression were seen for the different plasmids for the two cell lines. As expected, the plasmid containing the NOS1AP promoter always demonstrated higher expression than pGL3-Basic, increasing expression approximately 19-fold. In all cases, the plasmids containing the NOS1AP promoter and additional test sequences show somewhat lower expression than the plasmid containing just the promoter, presumably due to lower transfection efficiency of the larger plasmids. For the plasmids containing the NOS1AP promoter and sequences encompassing rs1415263 and rs4145621, expression did not differ significantly between the two alleles.
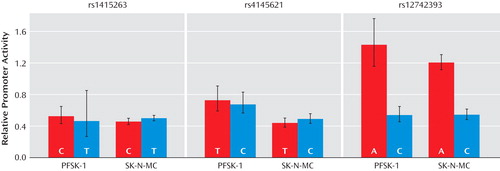
a The NOS1AP promoter and the most highly evolutionarily conserved region (at least 400 bp on either side) surrounding each SNP were cloned into the pGL3-Basic plasmid containing firefly luciferase. This produced a pair of test plasmids for each SNP, differing only by a single base pair. The activity of each plasmid relative to a control plasmid containing only the NOS1AP promoter and the firefly luciferase gene is plotted. Bar heights and error bars represent log-scale means ± one standard deviation transformed back to the original scale. Each plasmid was tested in two human neural cell lines, PFSK-1 and SK-N-MC. Experiments on each plasmid were conducted in three or four parallel replicates; these replicate experiments were then repeated on three or four separate occasions. Renilla luciferase activity was used to normalize for transfection efficiency. For rs1415263 and rs4145621, the schizophrenia-associated allele (red bar) and nonassociated allele (blue bar) produced similar levels of expression. For rs12742393, the schizophrenia-associated A allele produced significantly higher expression than the C allele (p=5.8×10 –15 for SK-N-MC and p=5.2×10 –12 for PFSK-1).
For rs12742393, the plasmid containing the NOS1AP promoter and the A allele produced significantly higher expression than the plasmid containing the promoter and the C allele in both cell lines (in SK-N-MC, t=12.434, df=38, p=5.8×10 –15 ; in PFSK-1, t=9.849, df=38, p=5.2×10 –12 ). To determine whether this increased expression was due to an interaction with the region containing the SNP and the NOS1AP promoter sequence, additional plasmids were constructed with the allelic variants of rs12742393 (and flanking sequence) but without any promoter. The expression of these plasmids was compared with the expression of plasmids containing the NOS1AP promoter alone or the NOS1AP promoter plus the rs12742393 sequences. For both cell lines, the expression of the plasmid containing both the NOS1AP promoter and the A allele of rs12742393 could not be explained by a simple additive effect of these two DNA sequences (in PFSK-1, t=9.611, df=54, p=2.7×10 –13 ; in SK-N-MC, t=19.117, df=54, p<1× 10–15 ), indicating interaction between the SNP sequence and the promoter. For the plasmid containing both the NOS1AP promoter and the C allele, the expression could be explained by the additive effect of these two DNA sequences for the PFSK-1 (t=0.430, df=54, p=0.668) but not the SK-N-MC (t=9.075, df=54, p=1.9×10 –12 ) cell line.
Electrophoretic Mobility Shift Assay
The two allelic variants of rs12742393 were tested by electrophoretic mobility shift assay for evidence of nuclear protein binding. Equal amounts of nuclear extracts from both PFSK-1 and SK-N-MC cells produced bands with greater intensity for the oligonucleotide containing the A allele. Nearly identical results were obtained using various amounts of protein extract (0.25, 0.40, 0.50, 1.0, and 1.5 μg) ( Figure 3 ; other data not shown). The addition of 100 molar excess of unlabeled oligonucleotide identical to the probe competed for protein binding, indicating that nuclear factors bind specifically to rs12742393. The potential identity of the bound protein(s) is unclear, as bioinformatic analysis (www.cbil.upenn.edu/cgi-bin/tess/tess) does not predict any transcription factor binding sites that are weakened by converting the polymorphic A nucleotide of rs12742393 to a C.

a To investigate whether the associated SNP affects the binding of nuclear proteins, electrophoretic mobility shift assays were conducted with biotinylated oligonucleotides and nuclear extract isolated from cultured PFSK-1 (left) and SK-N-MC (right) cells. Extracts were incubated with oligonucleotides specific to each allele, separated on a denaturing acrylamide gel, transferred to a membrane, and detected by chemiluminescence. Specificity was determined by competition with 100 molar excess of unlabeled allele-specific oligonucleotide. Protein-DNA complexes were observed for both alleles (arrows), but preferential binding of complexes was observed for the associated A allele using both nuclear extracts. “A” indicates a 21-mer oligonucleotide containing the rs12742393 A allele; “C” indicates a 21-mer oligonucleotide containing the rs12742393 C allele; “+” and “–” indicate the presence or absence, respectively, of nuclear extract (extract) or 100 molar excess of unlabeled oligonucleotide (competitor).
Discussion
We previously reported association between schizophrenia and SNPs within NOS1AP using a small set of markers (11) . We also reported significantly increased expression of NOS1AP in postmortem samples from the dorsolateral prefrontal cortex of individuals with schizophrenia and demonstrated that specific SNP alleles associated with disease are also associated with increased NOS1AP expression (17) . In this study, we conducted a more thorough search for disease-associated SNPs throughout the large genomic extent of NOS1AP . We identified rs12742393 as a functional SNP that exhibits strong LD with schizophrenia, is associated with higher levels of NOS1AP expression in postmortem samples from the dorsolateral prefrontal cortex, and is capable of significantly increasing expression from the NOS1AP promoter in two human neural cell lines. The allelic variants of this SNP also exhibit differential affinity for binding of nuclear proteins from these cell lines, suggesting that altered transcription factor binding may be the mechanism responsible for the allelic expression differences.
We also demonstrated the utility of LD mapping using the posterior probability of linkage framework. As a measure of evidence, the PPLD is straightforward to interpret. It answers the fundamental question, “What is the chance that each of the SNPs we are investigating is in LD with a risk mutation?” Variations in DNA that are located physically far apart (on the same chromosome or on different chromosomes) will randomly assort during meiosis, with combinations of alleles at these different loci conforming to the ratios predicted by the Hardy-Weinberg law. Alleles at loci that are physically very close to each other are often co-transmitted during meiosis, leading to a correlation between the presence of a specific allele at one locus and a specific allele at the other locus. This correlation between alleles at nearby loci is termed linkage disequilibrium. In this study, we evaluated the probability that each tested SNP was in LD with a functional DNA change in NOS1AP that increased risk for schizophrenia. It is important to point out that we cannot statistically distinguish a SNP that is in strong LD with a functional DNA change from the actual functional SNP itself; the functional DNA change and the associated alleles at nearby SNPs all will be inherited together, requiring additional laboratory experiments to determine which sequence change has biological function.
In this study, three SNPs out of the 60 evaluated were calculated to have more than a 40% chance of being in LD with a schizophrenia risk allele. The PPL software can also be used to estimate the magnitude of LD between each SNP and the risk locus. For all three of these SNPs, the estimate of the LD parameter D′ was 1.0, the maximum possible value. There are several important points to be made about the interpretation and utility of this result. First, this does not mean that there was a 40%–50% chance that each of these SNPs will be functional. The genotypes at these SNPs are very highly correlated; knowing the DNA sequence at one SNP allows the prediction, with a high degree of accuracy, of the DNA sequences at the others. So the PPLD result tells us there is a good chance that at least one of these SNPs (or a yet untested SNP that is also highly correlated with this group) will be functional. Second, the probability that these SNPs will be involved was calculated at 40%–50%; this is far from certainty of being involved (100% chance) but also far from certainty of being not involved (0% chance). But one SNP does appear to be functional, so was our calculation of the PPLD too low? Here it is important to remember that the PPL framework, like other measures of evidence, is limited by the sample to which it is applied. Our sample was modestly sized for association analysis; it may simply be too small to give PPLD values close to certainty. But while the probability of LD was estimated at 40%–50%, the magnitude of LD was estimated to be extremely high (D′=1.0). Such a high D′ value would be expected to be observed with an actual schizophrenia risk allele. It is also important to remember that these PPLD values only reflect the evidence from the genotypes in the Canadian families; other evidence that one of these SNPs is functional, such as the results of the postmortem study, is not reflected in the PPLD. Finally, as can be clearly seen in Figure 1 , the PPLD analysis did an excellent job of separating the SNPs into two distinct groups, those with high and those with low evidence for being involved in schizophrenia risk. This allowed us to efficiently prioritize the selection of SNPs for the costly and time-consuming step of functional validation.
We previously (11) analyzed 15 of these 60 SNPs for association to schizophrenia using the program Pseudomarker (36) , identifying three SNPs (rs1415263, rs4145621, and rs2661818) as associated. Two of these (rs1415263 and rs4145621) provide strong evidence of LD using the PPLD. Interestingly, these same two SNPs showed significant association to schizophrenia in the recent study of Kremeyer et al. (12) , while rs2661818 did not, suggesting that the PPLD might be resistant to type I errors that may be generated by other association analysis methods.
While we have identified what appears to be a functional risk allele for schizophrenia, it is important to put this finding in context. First, it is not clear that we have identified the only functional polymorphism within this region. NOS1AP is a large gene; analysis of the current HapMap data (version 23a) (37) from this gene using the Caucasian population, the pairwise Tagger algorithm (38) , an r 2 threshold of 0.8, and a minimum minor allele frequency of 0.05 indicates that 97 SNPs would be necessary to fully tag this gene. However, the HapMap database is still incomplete; 20 of the SNPs genotyped in our study have no data in HapMap. Three of these SNPs, all with minor allele frequencies exceeding 10% in our sample, were recently discovered by resequencing efforts in our lab, which suggests that there is still an important role for resequencing of candidate genes to identify common variants.
It will be important to determine whether the rs12742393 functional allele acts to confer risk of schizophrenia in other populations. We believe that there is genetic heterogeneity in schizophrenia and hence do not expect that all samples will easily replicate this finding. This may be particularly true for large samples for which mixed ascertainment strategies were used (39) . It is important to remember that failure to replicate this finding in other samples does not invalidate the finding in this population. The importance of genetic background to the manifestation of inherited traits is well known in animal genetics, where genetic differences between inbred strains can result in the same DNA change producing a profound effect in one strain while remaining silent in another. It is likely that we will need to consider the effects of interacting risk alleles in multiple genes in order to observe more consistent replications of association to any schizophrenia candidate gene across different samples (40) . Schizophrenia is clearly not a single-gene disorder. The frequency of the rs12742393-A allele is ∼40% in Caucasian populations, ∼70% in Asian populations, and ∼80% in African populations. Given the population rates of schizophrenia, it is obvious that a single copy of this risk allele is far from sufficient to cause the illness, but the high frequency of this allele does mean that it could potentially play a role in a large number of cases.
Identification of a functional DNA change associated with schizophrenia in this Canadian population should help stratify other samples into more homogeneous subsets. Investigators will readily be able to determine which subjects carry the rs12742393-A allele that could increase NOS1AP expression. Given the interest in pharmacologic targeting of the glutamate receptor system in schizophrenia, identification of this functional risk allele may also have utility in identifying patients who may respond better to certain new medications. The results of this study may help lay the foundation for a better understanding of the complex genetic architecture of schizophrenia risk.
1. McGuffin P, Asherson P, Owen M, Farmer A: The strength of the genetic effect: is there room for an environmental influence in the aetiology of schizophrenia? Br J Psychiatry 1994; 164:593–599Google Scholar
2. Bassett AS, Chow EW, Waterworth DM, Brzustowicz L: Genetic insights into schizophrenia. Can J Psychiatry 2001; 46:131–137Google Scholar
3. Brzustowicz LM, Hayter JE, Hodgkinson KA, Chow EW, Bassett AS: Fine mapping of the schizophrenia susceptibility locus on chromosome 1q22. Hum Hered 2002; 54:199–209Google Scholar
4. Brzustowicz LM, Hodgkinson KA, Chow EW, Honer WG, Bassett AS: Location of a major susceptibility locus for familial schizophrenia on chromosome 1q21-q22. Science 2000; 288:678–682Google Scholar
5. Shaw SH, Kelly M, Smith AB, Shields G, Hopkins PJ, Loftus J, Laval SH, Vita A, De Hert M, Cardon LR, Crow TJ, Sherrington R, DeLisi LE: A genome-wide search for schizophrenia susceptibility genes. Am J Med Genet 1998; 81:364–376Google Scholar
6. Gurling HM, Kalsi G, Brynjolfson J, Sigmundsson T, Sherrington R, Mankoo BS, Read T, Murphy P, Blaveri E, McQuillin A, Petursson H, Curtis D: Genomewide genetic linkage analysis confirms the presence of susceptibility loci for schizophrenia, on chromosomes 1q32.2, 5q33.2, and 8p21-22 and provides support for linkage to schizophrenia, on chromosomes 11q23.3-24 and 20q12.1-11.23. Am J Hum Genet 2001; 68:661–673Google Scholar
7. Hwu HG, Liu CM, Fann CS, Ou-Yang WC, Lee SF: Linkage of schizophrenia with chromosome 1q loci in Taiwanese families. Mol Psychiatry 2003; 8:445–452Google Scholar
8. Lewis CM, Levinson DF, Wise LH, DeLisi LE, Straub RE, Hovatta I, Williams NM, Schwab SG, Pulver AE, Faraone SV, Brzustowicz LM, Kaufmann CA, Garver DL, Gurling HM, Lindholm E, Coon H, Moises HW, Byerley W, Shaw SH, Mesen A, Sherrington R, O’Neill FA, Walsh D, Kendler KS, Ekelund J, Paunio T, Lonnqvist J, Peltonen L, O’Donovan MC, Owen MJ, Wildenauer DB, Maier W, Nestadt G, Blouin JL, Antonarakis SE, Mowry BJ, Silverman JM, Crowe RR, Cloninger CR, Tsuang MT, Malaspina D, Harkavy-Friedman JM, Svrakic DM, Bassett AS, Holcomb J, Kalsi G, McQuillin A, Brynjolfson J, Sigmundsson T, Petursson H, Jazin E, Zoega T, Helgason T: Genome scan meta-analysis of schizophrenia and bipolar disorder, part II: Schizophrenia. Am J Hum Genet 2003; 73:34–48Google Scholar
9. Rosa A, Fañanás L, Cuesta MJ, Peralta V, Sham P: 1q21-q22 locus is associated with susceptibility to the reality-distortion syndrome of schizophrenia spectrum disorders. Am J Med Genet 2002; 114:516–518Google Scholar
10. Miranda A, Garcia J, Lopez C, Gordon D, Palacio C, Restrepo G, Ortiz J, Montoya G, Cardeno C, Calle J, Lopez M, Campo O, Bedoya G, Ruiz-Linares A, Ospina-Duque J: Putative association of the carboxy-terminal PDZ ligand of neuronal nitric oxide synthase gene (CAPON) with schizophrenia in a Colombian population. Schizophr Res 2006; 82:283–285Google Scholar
11. Brzustowicz LM, Simone J, Mohseni P, Hayter JE, Hodgkinson KA, Chow EW, Bassett AS: Linkage disequilibrium mapping of schizophrenia susceptibility to the CAPON region of chromosome 1q22. Am J Hum Genet 2004; 74:1057–1063Google Scholar
12. Kremeyer B, García J, Kymäläinen H, Wratten N, Restrepo G, Palacio C, Miranda A, López C, Restrepo M, Bedoya G, Brzustowicz L, Ospina-Duque J, Arbeláez M, Ruiz-Linares A: Evidence for a role of the NOS1AP (CAPON) gene in schizophrenia and its clinical dimensions: an association study in a South American population isolate. Hum Hered 2009; 67:163–173Google Scholar
13. Zheng Y, Li H, Qin W, Chen W, Duan Y, Xiao Y, Li C, Zhang J, Li X, Feng G, He L: Association of the carboxyl-terminal PDZ ligand of neuronal nitric oxide synthase gene with schizophrenia in the Chinese Han population. Biochem Biophys Res Commun 2005; 328:809–815Google Scholar
14. Jaffrey SR, Snowman AM, Eliasson MJ, Cohen NA, Snyder SH: CAPON: a protein associated with neuronal nitric oxide synthase that regulates its interactions with PSD95. Neuron 1998; 20:115–124Google Scholar
15. Firestein BL, Brenman JE, Aoki C, Sanchez-Perez AM, El-Husseini AE, Bredt DS: Cypin: a cytosolic regulator of PSD-95 postsynaptic targeting. Neuron 1999; 24:659–672Google Scholar
16. Coyle JT, Tsai G, Goff D: Converging evidence of NMDA receptor hypofunction in the pathophysiology of schizophrenia. Ann NY Acad Sci 2003; 1003:318–327Google Scholar
17. Xu B, Wratten N, Charych EI, Buyske S, Firestein BL, Brzustowicz LM: Increased expression in dorsolateral prefrontal cortex of CAPON in schizophrenia and bipolar disorder. PLoS Med 2005; 2(10):e263Google Scholar
18. Bassett AS, Collins EJ, Nuttall SE, Honer WG: Positive and negative symptoms in families with schizophrenia. Schizophr Res 1993; 11:9–19Google Scholar
19. Bassett AS, Honer WG: Evidence for anticipation in schizophrenia. Am J Hum Genet 1994; 54:864–870Google Scholar
20. Schwartz S, Zhang Z, Frazer KA, Smit A, Riemer C, Bouck J, Gibbs R, Hardison R, Miller W: PipMaker: a web server for aligning two genomic DNA sequences. Genome Res 2000; 10:577–586Google Scholar
21. Ahmadian A, Gharizadeh B, Gustafsson AC, Sterky F, Nyren P, Uhlen M, Lundeberg J: Single-nucleotide polymorphism analysis by pyrosequencing. Anal Biochem 2000; 280:103–110Google Scholar
22. Bruse S, Moreau MP, Azaro MA, Zimmerman RP, Brzustowicz LM: Improvements to bead-based oligonucleotide ligation SNP genotyping assays. Biotechniques 2008; 45:559–571Google Scholar
23. Iannone MA, Taylor JD, Chen J, Li MS, Rivers P, Slentz-Kesler KA, Weiner MP: Multiplexed single nucleotide polymorphism genotyping by oligonucleotide ligation and flow cytometry. Cytometry 2000; 39:131–140Google Scholar
24. O’Connell JR, Weeks DE: PedCheck: a program for identification of genotype incompatibilities in linkage analysis. Am J Hum Genet 1998; 63:259–266Google Scholar
25. Abecasis GR, Cherny SS, Cookson WO, Cardon LR: Merlin: rapid analysis of dense genetic maps using sparse gene flow trees. Nat Genet 2002; 30:97–101Google Scholar
26. Yang X, Huang J, Logue MW, Vieland VJ: The posterior probability of linkage allowing for linkage disequilibrium and a new estimate of disequilibrium between a trait and a marker. Hum Hered 2005; 59:210–219Google Scholar
27. Vieland VJ: Bayesian linkage analysis, or: how I learned to stop worrying and love the posterior probability of linkage. Am J Hum Genet 1998; 63:947–954Google Scholar
28. Vieland VJ: Thermometers: something for statistical geneticists to think about. Hum Hered 2006; 61:144–156Google Scholar
29. Wang K, Huang J, Vieland VJ: The consistency of the posterior probability of linkage. Ann Hum Genet 2000; 64:533–553Google Scholar
30. Huang Y, Brzustowicz L, Vieland V: PPLD: extension of the PPL framework to detect trait-marker LD and estimate D′ in general pedigree structures. Presented at the annual meeting of the American Society of Human Genetics, San Diego, Calif, Oct 25, 2007. http://www.ashg.org/genetics/ashg07s/f10961.htmGoogle Scholar
31. Logue M, Brzustowicz L, Bassett A, Chow E, Vieland V: A posterior probability of linkage (PPL) based re-analysis of schizophrenia data yields evidence of linkage to chromosomes 1 and 17. Hum Hered 2006; 62:47–54Google Scholar
32. Falconer DS, Mackay TFC: Introduction to Quantitative Genetics, 4th ed. Harlow, Essex, UK, Addison Wesley Longman, 2004Google Scholar
33. Smith CAB: Testing for heterogeneity of recombination fraction values in human genetics. Ann Hum Genet 1963; 27:175–182Google Scholar
34. Huang Y, Segre A, O’Connell J, Wang H, Vieland V: KELVIN: a 2nd generation distributed multiprocessor linkage and linkage disequilibrium analysis program. Presented at the annual meeting of the American Society of Human Genetics, New Orleans, Oct 10, 2006. http://www.ashg.org/cgi-bin/ashg06s/ashg06?pgmnr=1556&sort=ptimes&sbutton=Detail&absno=20542&sid=961501Google Scholar
35. Elston RC, Lange K: The prior probability of autosomal linkage. Ann Hum Genet 1975; 38:341–350Google Scholar
36. Goring HH, Terwilliger JD: Linkage analysis in the presence of errors, IV: joint pseudomarker analysis of linkage and/or linkage disequilibrium on a mixture of pedigrees and singletons when the mode of inheritance cannot be accurately specified. Am J Hum Genet 2000; 66:1310–1327Google Scholar
37. The International HapMap Consortium: The International HapMap Project. Nature 2003; 426:789–796Google Scholar
38. Barrett JC, Fry B, Maller J, Daly MJ: Haploview: analysis and visualization of LD and haplotype maps. Bioinformatics 2005; 21:263–265Google Scholar
39. Brzustowicz LM: Size matters: the unexpected challenge of detecting linkage in large cohorts (editorial). Am J Psychiatry 2007; 164:192–194Google Scholar
40. Vieland VJ: The replication requirement. Nat Genet 2001; 29:244–245Google Scholar