Reduced Evoked Gamma Oscillations in the Frontal Cortex in Schizophrenia Patients: A TMS/EEG Study
Abstract
Objective: Transcranial magnetic stimulation (TMS) combined with high-density electroencephalography (EEG) can be used to directly examine the properties of thalamocortical circuits in the brain without engaging an individual in cognitive or motor tasks. The authors investigated EEG responses in schizophrenia patients and healthy comparison subjects following the application of TMS to the premotor cortex. Method: Sixteen schizophrenia patients and 14 healthy comparison subjects were recruited to participate in the study. Participants underwent three to five TMS/high-density EEG sessions at various TMS doses. The following three aspects of TMS-evoked responses were analyzed: amplitude, synchronization, and source localization. Results: Relative to healthy comparison subjects, schizophrenia patients had a marked decrease in evoked gamma oscillations that occurred within the first 100 msec after TMS, particularly in a cluster of electrodes located in a fronto-central region. These oscillations were significantly reduced in amplitude (calculated using global-mean field power and event-related spectral perturbation analysis) and synchronization (measured using intertrial coherence). Furthermore, source modeling analysis revealed that the TMS-evoked brain activation underlying these gamma oscillations in patients with schizophrenia did not propagate (as it did in healthy comparison subjects) and was mostly confined to the stimulated brain region. Conclusions: Schizophrenia patients showed a decrease in EEG-evoked responses in the gamma band when TMS was applied to directly stimulate the frontal cortex while these responses were recorded. Since EEG responses to direct cortical stimulation are not affected by an individual’s motivation, attention, or cognitive capacity and are not relayed through peripheral afferent pathways, these findings suggest that there might be an intrinsic dysfunction in frontal thalamocortical circuits in individuals with schizophrenia.
Increasing evidence suggests that individuals with schizophrenia exhibit abnormal electroencephalography (EEG) rhythms, especially in the fast-frequency bands (beta and gamma). In particular, several recent studies that utilized steady-state stimulation showed decreased entrainment of EEG oscillations in the beta and gamma frequencies in schizophrenia patients (1 , 2) , relative to comparison subjects, and in the first-degree relatives of schizophrenia patients (3) . Similarly, numerous event-related potential studies that used visual or auditory stimuli have shown deficits in the power and synchronization of induced (4) or evoked (5 – 9) EEG rhythms in the beta and gamma bands in both chronically medicated and medication-naive individuals with schizophrenia. Altered, fast EEG rhythms in schizophrenia patients suggest that there might be an underlying alteration of thalamocortical circuits. On the other hand, it is possible that alterations of EEG fast oscillations may represent an epiphenomenon of reduced attention or motivation in individuals with schizophrenia. One way to determine this would be to directly probe the thalamocortical circuits in schizophrenia patients and test their ability to engage in fast rhythms, independent of the individual’s contingent behavior.
In a recent high-density EEG study that examined sleeping subjects, we demonstrated that sleep spindles, the predominant fast rhythms that are observed during nonrapid eye-movement sleep, were greatly reduced in schizophrenia patients relative to healthy comparison subjects (10) . The presence of these deficits during sleep, a state that minimizes confounding factors such as attention or motivation, is suggestive of the involvement of thalamocortical circuits implicated in generating sleep spindles in the pathophysiology of schizophrenia.
In the present study, we used transcranial magnetic stimulation (TMS) and a TMS-compatible, high-density EEG system to directly probe the ability of the thalamocortical system to produce fast oscillations in schizophrenia patients who were awake. The combination of TMS and EEG allows for direct stimulation of a cortical area while simultaneously recording the responses in the rest of the brain to this perturbation (11) . Through the use of TMS-compatible, high-density EEG, intrinsic neural properties and the connections of thalamocortical circuits can be explored without requiring the active engagement of subjects in a cognitive task. In addition, TMS-compatible, high-density EEG does not involve peripheral stimulation and provides the opportunity to directly examine thalamocortical circuits in higher-order associative areas of the brain.
We stimulated the premotor cortex in schizophrenia patients and healthy comparison subjects and analyzed the TMS-evoked EEG activity. In healthy comparison subjects, TMS evoked several gamma oscillations within the first 100 msec, whereas these oscillations were delayed and reduced in amplitude in schizophrenia patients. Event-related spectral perturbation and intertrial coherence analyses also revealed that these oscillations were decreased in amplitude and less synchronous in schizophrenia patients, especially in a fronto-central region that included premotor and sensorimotor areas. Furthermore, current source analysis of these TMS-evoked oscillations showed that the evoked oscillatory activity in healthy subjects propagated from the premotor cortex to other anatomically connected brain regions, whereas this activation in schizophrenia patients was more localized, slowly shifting between the premotor and motor cortices.
Method
Participants
Fourteen healthy comparison subjects (mean age=34.6 years [SD=7]; three women) and 16 schizophrenia patients (mean age=33.5 years [SD=8]; three women) (two-tailed unpaired t test: p=0.68) were assessed. A psychiatrist interviewed all participants and confirmed the diagnosis of schizophrenia according to DSM-IV-TR criteria. Individuals with schizophrenia were diagnosed primarily as paranoid (N=12). The remainder of these individuals were diagnosed as having residual (N=3) or disorganized (N=1) schizophrenia subtypes. Participants were further assessed using the Positive and Negative Syndrome Scale. Of the schizophrenia patients, 14 were being treated with second-generation antipsychotics, while two were unmedicated. All individuals who were diagnosed with schizophrenia were outpatients, with a mean duration of illness of 11.1 years (SD=6.4). Subjects were excluded if they had 1) substance abuse or dependence within the 6 months before the start of the study or 2) an identifiable neurological disorder, including a personal or family history of seizures. Each participant gave written informed consent, and the study was approved by the University of Wisconsin Human Subjects Committee.
TMS Targeting
Stimulation was conducted using a figure-of-eight coil connected to a Magstim Rapid biphasic stimulator. Cortical TMS targets were identified on anatomical magnetic resonance imaging (MRI) scans that were acquired using a 3T GE scanner. To ensure accuracy and reproducibility of stimulation, we used the Navigated Brain Stimulation system (NBS, Nexstim, Finland). Through an optical tracking system, the navigated brain stimulation system located the relative positions of the head and the TMS coil. The navigated brain stimulation system also calculated the distribution and strength of the intracranial electric field induced by TMS. Thus, the position of the maximum electric field (hot spot) on the three-dimensional reconstruction of each subject’s brain could be monitored in real time ( Figure 1 ). The target cortical area, the right premotor cortex, was identified on each subject’s MRI scan, and the TMS coil was placed on the corresponding scalp position, a few centimeters anterior of the Cz electrode. The intensity of the stimulator output was based on the maximum TMS-induced electric field on the cortical surface, calculated by the navigated brain stimulation system and expressed in volts per meter (V/m). An intensity of 120 V/m, which is known to be above the resting motor threshold (12) , was chosen to compare the TMS-evoked responses in schizophrenia patients and healthy comparison subjects.
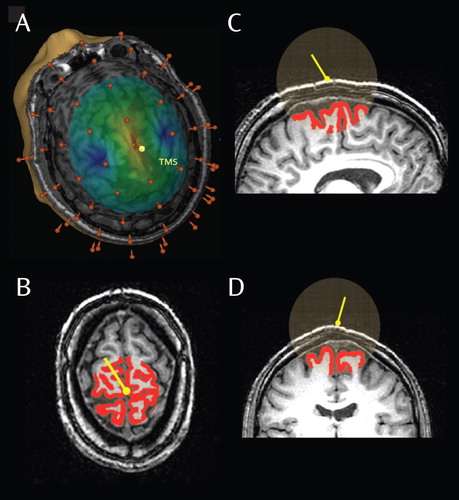
a A three-dimensional reconstruction of a subject’s brain is illustrated in part A. The yellow pin represents the position of the TMS coil on the scalp, and the brown pins represent EEG electrodes. The intensity of the electric field generated by TMS on the cortical surface was calculated by the navigated brain stimulation system. The intensity is color coded, with the red area (hot spot) reflecting the maximal strength of stimulation. In each subject, the hot spot was stimulated at 120 V/m and corresponded with the right premotor cortex. Parts B–D show views of the estimate of the volume of gray matter affected by TMS. The yellow pin reflects the position of the TMS coil on the scalp. The red area lines the region representing the cortical surface, and the transparent sphere represents the volume affected by the TMS electric field. The amount of cortical surface (gray matter volume) included in the sphere was calculated for each subject, and volume comparisons were performed between the healthy comparison and schizophrenia groups.
To confirm that the dose of TMS to the brain was comparable between healthy comparison subjects and schizophrenia patients, we performed a volumetric analysis of the tissues underlying the stimulator. Each subject’s MRI scan was segmented into gray matter, white matter, and CSF using the Automated Segmentation Tool (FAST, FMRIB Software Library). The volume of gray matter that was intersected by a sphere (radius=40 mm), which originated from the center of the TMS coil, was calculated and compared between the two study groups.
Finally, to exclude the possibility that potential deficits in the evoked responses in schizophrenia patients could reflect an inadequate intensity of stimulation, we performed stimulation sessions employing higher doses of TMS (140 and 160 V/m) in all subjects.
EEG Recordings During TMS
We recorded the TMS-evoked EEG responses using a 60-electrode cap and a TMS-compatible amplifier (Nexstim, Finland). The EEG signals, referenced to an additional electrode on the forehead, were filtered (between 0.1 and 500 Hz) and sampled at 1,450 Hz. In most of the recordings, no TMS-induced magnetic artifact was detected, and in all recordings the EEG signals were artifact-free from approximately 8 msec after the TMS pulse.
Masking the TMS Click
The click associated with the discharge of the TMS coil can elicit an auditory N1/P2 component at latencies of 100 to 200 msec (13) . To prevent contamination of TMS-evoked potentials with an auditory response, a procedure was adopted to generate a sound that would completely eliminate each subject’s perception of the pulse of the coil. The waveform of the TMS coil click was digitized and used to create a masking soundtrack that was played through inserted headphones. Before starting the experiment, we delivered single TMS test pulses, and the volume was adjusted until the subject reported that the TMS click was not audible. Noise masking was played throughout the recording session. In a previous study (14) , we reported the effectiveness of the procedure of masking the coil click. Additionally, we confirmed the effectiveness of this procedure in several subjects enrolled in the present study by comparing the evoked responses to “sham” TMS (coil tilted 90° away from the scalp) with and without the masking sound (see the data supplement accompanying the online version of this article).
Experimental Procedures
During the experiment, each subject was sitting in an adjustable chair with a headrest that ensured a stable head position. To ensure wakefulness throughout the recording sessions, subjects were required to keep their eyes open. After preparation of EEG recordings and calibration of the navigated brain stimulation system were complete, the resting motor threshold was identified in the relaxed, right first-dorsal interosseus, where motor-evoked potentials were recorded. Resting motor threshold was defined as the TMS intensity needed to elicit a ≥50-μV electromyographic response in at least five of 10 consecutive trials. Next, several 8- to 10-minute EEG sessions were recorded during TMS of the right premotor cortex at 0.5 to 0.7 Hz.
Data Analysis
Data analysis was conducted using MATLAB (MathWorks, Natick, Mass.) and the public license toolbox EEGLAB (15) . TMS trials that contained noise, muscle activity, or eye movement were rejected. Following this procedure, EEG signals were filtered between 2 and 80 Hz, down sampled from 1,450 Hz to 725 Hz, and average referenced.
Time and frequency domains were two main aspects of the TMS-evoked potentials investigated. To examine responses in the time domain, the global-mean field power was calculated. Global-mean field power is a measure of global brain activation and is calculated as the root mean-squared value of the signal across all electrodes. Global-mean field power values were calculated from 1 second before to 1 second after TMS to identify differences in TMS-evoked activity between the two study groups. To examine responses in the frequency domain, event-related spectral perturbation and intertrial coherence were investigated. Event-related spectral perturbation measures the modulation of amplitude induced by a specific event (e.g., TMS pulse), relative to a baseline (e.g., prestimulus condition) (15) . In particular, the baseline amplitude spectra values of the EEG preceding the event (TMS pulse) were measured for each trial. Next, the amplitude spectra (event-related spectral perturbation) values of the evoked responses (EEG recorded after TMS) were calculated, and the average baseline spectra value was subtracted from all amplitude values. Thus, the mean baseline amplitude value was set at zero. This procedure was repeated for each trial included in our analysis, and single-trial event-related spectral perturbation values were averaged across all trials in order to compute the mean event-related spectral perturbation. For each subject, event-related spectral perturbation values were calculated for each channel between 8 and 50 Hz. A two-tailed bootstrap significance probability level was computed (p<0.05), and only significant values were considered for between-group comparisons. Intertrial coherence values ranged from 0 (no phase locking) to 1 (maximal synchronization across trials) and provided a measure of synchronization of the TMS-evoked potentials across different trials, independent of signal amplitude (15) . Intertrial coherence was calculated for each channel and in the same frequency bands investigated for the event-related spectral perturbation.
Source modeling analysis (Curry 5.0) was performed based on the grand average response for the two study groups. The noise estimation was calculated by measuring the variance of the data in a 300-msec prestimulus interval. The results of the noise estimation were used to determine the regularization of the current density reconstruction. After semiautomatic segmentation of the Montreal Neurological Institute template brain, a boundary element model of the head with three compartments (scalp, skull, and brain) of fixed conductivity was implemented, and the electrode positions were projected onto the skin surface of the model. Additionally, the cortical surface was reconstructed with a 6-mm resolution and modeled using 14,000 rotating dipoles. The cortical current density (estimated from the voltage recorded at the scalp electrodes) was then calculated by employing the standardized low-resolution brain electromagnetic tomography algorithm (16) , and the location of the maximum estimated current (reflecting the center of neural activity) was projected onto the reconstructed cortical surface.
Statistics
Using a two-tailed unpaired t test, differences in demographic characteristics, resting motor threshold, scalp-to-cortex distance, and effects of higher doses of TMS on evoked responses were assessed between the two study groups. For all other analyses, we used statistical nonparametric mapping (single threshold analysis), a nonparametric test that accounts for multiple comparisons (17) . In addition to the statistical nonparametric mapping test, two-tailed bootstrap statistics were applied to the event-related spectral perturbation, and intertrial coherence values were calculated at all electrodes between 8 and 50 Hz. Furthermore, the Cohen’s d values for event-related spectral perturbation and intertrial coherence were determined at two electrodes (FC2 and Cz) close to the TMS coil, where the TMS-evoked activity was estimated to be maximal. The Cohen’s d values reflected 1) the difference between schizophrenia patients and healthy comparison subjects with regard to a parameter of interest (effect size) and 2) how well this parameter differentiated the two study groups (percent of nonoverlap) (18) .
Results
TMS and Cortical Activation
The navigated brain stimulation system allowed for identification and stimulation of the right premotor cortex in each subject, using the same intensity (120 V/m [ Figure 1 ]). Volumetric analysis revealed no difference in the volume of gray matter underlying the TMS coil between comparison subjects (mean=18.9 cm 3 [SD=3.3]) and schizophrenia patients (mean=17.9 cm 3 [SD=3.8]; two-tailed unpaired t test: p=0.56).
TMS/Motor-Evoked Potential
There was no difference found in the resting motor threshold between healthy comparison subjects (mean=58.5% [SD=6.5%] of stimulator output corresponding with 101 V/m [SD=7] TMS-induced electric field in the motor cortex) and schizophrenia patients (mean=59.5% [SD=6%] of stimulator output corresponding with 103 V/m [SD=6]; two-tailed unpaired t test: p=0.7). Resting motor threshold values were significantly correlated with scalp-to-cortex distance in both comparison subjects (r=0.88, p<0.0001) and schizophrenia patients (r=0.89, p<0.0001).
Spontaneous EEG
In a subgroup of schizophrenia patients (N=10) and healthy comparison subjects (N=8), power-spectra analysis was performed using spontaneous waking EEG recordings. Although schizophrenia patients showed, on average, an increase in theta activity and a decrease in alpha activity, this effect did not reach significance. No significant difference in other frequency bands was found between the two study groups (see the data supplement accompanying the online version of this article).
TMS/High-Density EEG
To quantify the total brain activation evoked by TMS, global-mean field power, calculated as the root mean-squared value of the signal across all electrodes, was computed for both study groups ( Figure 2 ). The global-mean field power for the schizophrenia group showed a decrease in amplitude between 12 and 100 msec poststimulus relative to healthy comparison subjects. This decrease was maximal at 22 and 55 msec, corresponding with the peaks of two TMS-evoked gamma oscillations. A time range (SD=10 msec), centered at the peak of these two gamma oscillations, was selected to measure the amplitude of the two peaks at each channel for each subject. The amplitude of these peaks was significantly reduced in schizophrenia patients relative to healthy comparison subjects in four fronto-central electrodes in the first peak and six fronto-central electrodes in the second peak (p<0.05; statistical nonparametric mapping). Figure 2 illustrates the evoked response recorded from one of these fronto-central channels (channel 19 [or electrode FCz]) compared with the evoked response recorded from a channel outside of this fronto-central area (channel 8 [or electrode F3]).
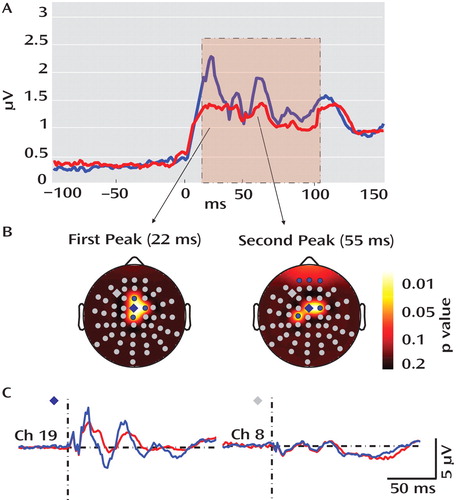
a In part A, responses to TMS in healthy comparison subjects (blue line) and schizophrenia patients (red line) are shown. Total activation was produced by TMS as measured by the global-mean field power derived from all 60 electrodes. Relative to healthy comparison subjects, the global-mean field power was decreased in schizophrenia patients between 12 and 100 msec following TMS (pink area). This decrease peaked at 22 and 55 msec (using a two-tailed unpaired t test). In part B, the topography for these two peaks is illustrated, showing four (first peak) and six (second peak) electrodes with enhanced TMS-induced activity in healthy comparison subjects relative to schizophrenia patients (blue electrodes: p<0.05; statistical nonparametric mapping). In part C, grand averages for a significant electrode (blue diamond; channel 19) and a nonsignificant electrode (gray diamond; channel 8) are shown in healthy comparison subjects (blue line) and schizophrenia patients (red line). Although the two averages were not different at channel 8, at channel 19 the fast oscillations in the schizophrenia group were delayed and greatly decreased in amplitude relative to the oscillations in the healthy comparison group.
The reduction in TMS-evoked gamma oscillations found in schizophrenia patients can be explained by deficits in amplitude or synchronization (phase locking) of the TMS-evoked responses across trials. To independently investigate the contribution of amplitude and phase locking to these gamma deficits, event-related spectral perturbation and intertrial coherence analyses were performed.
Event-related spectral perturbation measures changes in the amplitude of the EEG spectrum relative to an experimental event (e.g., TMS stimulation). Event-related spectral perturbation values are calculated for different spectrum frequency bands and are independent from the phase of the EEG-evoked activity. We found that event-related spectral perturbation gamma band values were reduced in schizophrenia patients within the first 100 msec after TMS, especially in four fronto-central channels close to the TMS coil (p<0.05; statistical nonparametric mapping) ( Figure 3 ). No significant difference was found for the other frequency ranges or for any other channel. These fronto-central channels were localized in one of the two regions that showed a reduced TMS-evoked response in individuals with schizophrenia. The reduction of the response at these fronto-central electrodes was significant between 12 and 100 msec after TMS. At the second region, corresponding with the three most anterior frontal channels, the reduction was significant only at the second peak, occurring 55 msec (SD=5) after TMS, which is presumably why the event-related spectral perturbation gamma values (calculated between 12 and 100 msec post-TMS) were not significantly different between the two study groups.
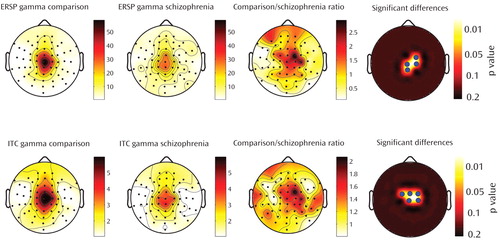
a The top row shows the topography of event-related spectral perturbation (ERSP) in schizophrenia patients and healthy comparison subjects in the gamma range between 30 and 50 Hz. The bottom row shows the topography of intertrial coherence (ITC) in schizophrenia patients and healthy comparison subjects in the gamma range between 30 and 50 Hz. Column 3 represents the ratio of event-related spectral perturbation and intertrial coherence values for healthy comparison subjects and schizophrenia patients. The last column shows the electrodes (blue dots) where event-related spectral perturbation and intertrial coherence are significantly increased in healthy comparison subjects relative to schizophrenia patients (p<0.05; statistical nonparametric mapping). These electrodes are located in a fronto-central area and include electrodes Cz and FC2.
Intertrial coherence determines the reproducibility of the phase of the EEG-evoked responses across trials, regardless of the amplitude of the responses. Thus, intertrial coherence reflects the intertrial synchronization (phase locking) of the EEG-evoked responses to TMS. We found that intertrial coherence deficits were present in schizophrenia patients within the first 100 msec following TMS. These deficits were restricted to the gamma band (p<0.05, statistical nonparametric mapping) ( Figure 3 ) and peaked at five channels localized in the same fronto-central region that showed event-related spectral perturbation gamma reduction. No significant difference was found for the other frequency ranges or for any other channel. Together, these findings suggest that there may be impairment in both the amplitude and phase locking of TMS-evoked responses in schizophrenia patients, especially in a fronto-central region closer to TMS application.
We used event-related spectral perturbation and intertrial coherence gamma values from two fronto-central electrodes (Cz and FC2 [see Figure 4 and the data supplement accompanying the online version of this article]) to assess the magnitude (effect size) of deficits in these gamma values in schizophrenia patients, calculated using Cohen’s d. We found that, at electrode FC2, the Cohen’s d values for event-related spectral perturbation and intertrial coherence were 1.35 and 2.06, respectively. These values correspond with 67% and 83% separation between schizophrenia patients and healthy comparison subjects. At electrode Cz, the Cohen’s d values for event-related spectral perturbation and intertrial coherence were 1.8 and 1.95, respectively. These values correspond with 77% and 81% separation between the two study groups. When these event-related spectral perturbation and intertrial coherence values were compared with several clinical parameters, including duration of illness and medication dose, no significant correlation was found.
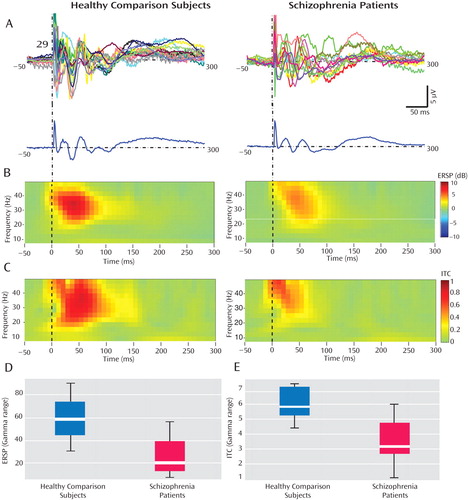
a In part A, single-channel (channel 29 [or electrode Cz]) individual average traces (top lines) and grand averages (bottom line) are shown for healthy comparison subjects and schizophrenia patients. Several gamma-range fast oscillations occurring within the first 100 msec after TMS were greatly reduced in schizophrenia patients relative to healthy comparison subjects. In part B, event-related spectral perturbation (ERSP) values from 50 msec before the TMS pulse to 300 msec after the TMS pulse, calculated between 8 and 50 Hz, are shown in healthy comparison subjects and schizophrenia patients and displayed in time-frequency plots. Schizophrenia subjects showed a significant decrease in event-related spectral perturbation relative to healthy comparison subjects, which was again restricted to the gamma range (p<0.01 after Bonferroni correction). In part C, intertrial coherence (ITC) values from 50 msec before the TMS pulse to 300 msec after the TMS pulse, calculated between 8 and 50 Hz, are shown in healthy comparison subjects and schizophrenia patients and displayed in time-frequency plots. In schizophrenia patients, there was a significant reduction in the intertrial coherence restricted to the gamma band (p<0.01 after Bonferroni correction). In part D, individual event-related spectral perturbation values in the gamma band calculated from 12 to 100 msec had an effect size of 1.8, corresponding with a 77% nonoverlap. In part E, individual gamma intertrial coherence values calculated from 12 to 100 msec had an effect size of 1.95, corresponding with an 81% nonoverlap.
To determine whether the reduction in TMS-evoked gamma activity found in schizophrenia patients could be explained by an inadequate intensity of stimulation of the targeted cortical area, the effects of higher TMS intensities on EEG responses were also investigated (see the data supplement accompanying the online version of this article). In both study groups, higher doses of TMS at 140 and 160 V/m resulted in evoked responses that were larger in amplitude, delayed in time, and had fewer oscillations. In particular, the highest TMS intensity increased the amplitude but delayed the occurrence of the first evoked oscillation in both schizophrenia patients and healthy comparison subjects, while the subsequent waves were delayed in both groups and dampened in schizophrenia patients. Nonetheless, at each of these TMS doses, schizophrenia patients showed a statistically significant decrease in gamma- (two-tailed unpaired t test: p<0.05) but not alpha- or beta- (two-tailed unpaired t test: p≥0.2) evoked oscillations relative to healthy comparison subjects.
To better characterize the neural events underlying these TMS-evoked gamma oscillations, the spatio-temporal dynamics of the currents induced by TMS in the cerebral cortex were investigated using source localization procedures (standardized low-resolution brain electromagnetic) ( Figure 5 ). We found that within the first 100 msec after TMS, healthy comparison subjects showed current maxima (reflecting the center of neural activity) shifting from the premotor cortex to 1) right sensorimotor areas and 2) left premotor and sensorimotor regions; while in schizophrenia patients, the cortical activation was much more localized, slowly shifting between premotor and motor areas along the midline.
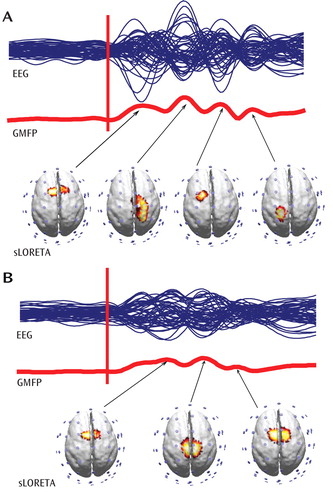
a Spatio-temporal dynamics of the grand averages of TMS-evoked responses are shown. The blue lines represent group averages of the TMS-evoked potentials recorded at all electrodes superimposed in a butterfly plot (EEG), while the red lines reflect the global-mean field power (GMFP). Source modeling was performed at the peak of global-mean field power. Current density distribution was calculated using standardized low-resolution brain electromagnetic tomography (sLORETA) and plotted on the cortical surface (14).
Discussion
TMS can be combined with high-density EEG to directly probe thalamocortical circuits without engaging the subject in sensory, cognitive, or motor tasks. In the present study, we investigated the EEG responses in schizophrenia patients and healthy comparison subjects after TMS of the premotor cortex. We found a marked decrease in the amplitude and synchronization of gamma oscillations in schizophrenia patients, which occurred within the first 100 msec after TMS. The dampening of gamma oscillations was prominent in a fronto-central region and was associated with an impairment of effective connectivity, as revealed by source localization of TMS-evoked cortical activation. These findings suggest that frontal thalamocortical circuits in individuals with schizophrenia may be impaired in the capacity to effectively produce and synchronize gamma rhythms.
Gamma Band Abnormalities in Schizophrenia
Deficits in evoked gamma activity have recently been reported in several studies involving schizophrenia patients. In particular, three studies (8 , 19 , 20) that used an oddball paradigm and one study (4) that used a cognitive task found a decrease in evoked gamma responses in the frontal regions in schizophrenia patients relative to healthy comparison subjects. Additionally, two investigations that used steady-state auditory stimulation found deficits in gamma synchrony and power in the auditory cortex in individuals with schizophrenia (1 , 2) . Furthermore, two studies using gestalt stimuli revealed a reduction in the gamma synchronization of the visual cortex in schizophrenia patients relative to healthy comparison subjects (7 , 21) . The deficits reported in these studies were found in different schizophrenia subtypes and were not correlated with duration of illness and medication status.
While these studies provide intriguing evidence that EEG gamma-band abnormalities may represent a common feature in schizophrenia, there are several open questions that deserve investigation. For example, are gamma abnormalities confined to evoked responses, or do they reflect alterations in baseline gamma activity? Where do gamma abnormalities originate within the neuronal relays that are engaged by sensory stimulus? Additionally, do gamma abnormalities primarily originate in sensory pathways and cortices, or are they intrinsic to other brain areas? Finally, do gamma abnormalities reflect an intrinsic alteration of brain circuits, or do they represent indirect consequences of other factors, such as impaired attention to stimuli?
In the present study, we attempted to address some of these questions by taking advantage of a combined TMS/high-density EEG protocol. TMS is a powerful, noninvasive tool that can be used to directly activate the cerebral cortex (22) . TMS has already been used in schizophrenia research to investigate changes in the excitability and inhibition of the primary motor cortex through changes in evoked muscle responses (23) . In our study, TMS was used, with high-density EEG, to directly examine its effects on thalamocortical circuits in individuals with schizophrenia.
An initial finding was that TMS of the premotor cortex (measured using TMS evoked cortical potentials) showed significant differences between healthy comparison subjects and schizophrenia patients, while TMS of the motor cortex (measured using motor threshold) revealed no difference between the two groups. This result is notable, given that motor threshold and TMS evoked cortical potentials reveal different aspects of cortical excitability. Motor threshold is a measure of cortical excitability as reflected by corticospinal circuits. In contrast, TMS-evoked EEG responses reflect the excitability of stimulated cortical neurons as well as the excitability of connected cortico-cortical and cortico-thalamocortical circuits. The activation of these circuits results in the generation of EEG-recorded oscillatory activity, especially in the fast (gamma) frequency ranges.
These findings, establish that gamma-band abnormalities in schizophrenia, first reported in sensory-evoked response studies, can also be demonstrated when directly stimulating the cerebral cortex. Relative to healthy comparison subjects, gamma responses in schizophrenia patients were markedly attenuated within the first 100 msec after TMS. Possible explanations for these gamma deficits are 1) a reduction in the amplitude of the TMS-evoked responses across trials or 2) a reduction in the synchronization of the TMS-evoked responses across trials. We therefore examined these two aspects of the responses independently, using event-related spectral perturbation and intertrial coherence analyses. We found that event-related spectral perturbation gamma values, which measure gamma amplitude following TMS (regardless of the phase), were significantly decreased in schizophrenia patients. In addition, the intertrial coherence gamma values, which measure gamma synchronization (regardless of signal amplitude), were also reduced in the schizophrenia group. In particular, intertrial coherence values in a fronto-central area close to the TMS coil yielded a ≥80% nonoverlap between schizophrenia patients and healthy comparison subjects. This finding is especially notable, since it has been suggested that gamma synchrony underlies core deficits in schizophrenia (2 , 4 , 6 , 24) . Several investigations have also suggested that gamma synchrony may correlate with clinical parameters, including negative symptoms or duration of illness. In our study, we did not find any significant correlation with age, severity of symptoms, and medication dose, perhaps because of the limited schizophrenia sample size (N=16), which was determined by the complexity of the TMS/high-density EEG approach.
The present results not only add to the evidence suggesting that gamma abnormality might be a robust feature of schizophrenia, but they also address some of the issues unanswered in previous studies. First, our study design allowed us to compare, within the same subjects, spontaneous EEG activity (specifically in the gamma range) with the gamma responses evoked by TMS. Consistent with other recent investigations (25 , 26) , we found no differences in the spontaneous gamma activity in schizophrenia patients and healthy comparison subjects. However, in these same subjects, we found a prominent decrease in TMS-evoked gamma activity. Therefore, it appears that the underlying deficits, whatever their nature, become evident when the relevant brain circuits are challenged by phasic stimuli that engage high-amplitude gamma oscillations, but not necessarily under tonic conditions.
Second, whereas changes in cortical gamma response that are triggered by peripheral stimuli could result from a weakened input because of alterations in a number of subcortical neuronal relays, our measurements clearly point to a primary involvement of cortical circuits. As measured by the navigated brain stimulation system and the volumetric analysis, the cerebral cortex was perturbed with the same amount of energy in healthy comparison subjects and schizophrenia patients. Thus, the altered response observed in individuals with schizophrenia cannot be explained by a weakened volley to cortical circuits. This notion is strengthened by the observation that even higher doses of TMS in schizophrenia patients did not result in a recovery of evoked fast oscillations.
Third, while sensory stimuli do not activate the frontal cortex directly, by using TMS we directly stimulated a frontal area: the right premotor cortex. This central midline area was selected primarily because it can be stimulated without eliciting scalp muscle activations, a source of EEG artifact and subject discomfort. The choice of this area was also based on evidence of premotor cortex deficits in schizophrenia. In particular, three recent imaging studies have shown a reduction in the volume (27) and functional connectivity (28 , 29) of the premotor area in schizophrenia patients relative to healthy comparison subjects. Together, the role of frontal areas is particularly relevant in schizophrenia research. Several imaging studies have reported reduced metabolism in the frontal areas in both chronic and first-episode schizophrenia patients, suggesting that this deficit is a core feature of schizophrenia (30) . The finding of frontal gamma response deficits reported in the present study is consistent with the notion of reduced frontal metabolism in individuals with schizophrenia (30) . Specifically, to our knowledge, the TMS/high-density EEG measurements in this study provide the first direct electrophysiological evidence of a primary deficit in frontal areas in generating and synchronizing gamma oscillations.
Finally, the TMS-induced effects on brain activity are certainly not independent of the brain state at the time of stimulation. However, TMS can be performed without requiring active participation of the subject. Thus, it is reasonable to assume that the TMS-evoked gamma response deficits found in individuals with schizophrenia are not dependent on the ability or motivation to perform cognitive tasks but rather reflect intrinsic alterations of specific brain circuits. In contrast, studies using oddball or gestalt stimuli necessarily require some degree of cognitive involvement of the subject. This is particularly relevant because cognitive aspects, such as attention and motivation, are difficult to control in experimental conditions and are known to be confounding factors in the interpretation of response deficits in schizophrenia.
Brain Circuits Underlying Gamma Oscillation Deficits in Schizophrenia
The reduction of TMS-evoked gamma oscillations in schizophrenia raises the question of which brain circuits underlie these deficits. The three most likely candidates are 1) gamma-aminobutyric acid (GABA)-ergic cortical interneurons, 2) cortico-cortical excitatory connections, and 3) cortico-thalamocortical loops.
GABA-ergic interneurons are known to play a major role in generating gamma oscillations. For example, mutual inhibition of local GABA-ergic cortical interneurons underlies the occurrence of gamma oscillations in a cortical region activated by repetitive stimulation (31) . Hence, the gamma response deficits observed in our schizophrenia group, which were maximal in the area closer to the application of TMS, could reflect impairments of local inhibitory interneurons.
In our analysis, source modeling of the TMS-evoked gamma oscillations revealed that in healthy subjects the activation shifted from the premotor cortex to the right sensorimotor, left anterior premotor, and left sensorimotor regions. In contrast, the cortical activation in schizophrenia patients was much more localized, slowly shifting between premotor and motor areas. This finding is consistent with evidence from experimental data suggesting that there are defective interactions among cortical areas in schizophrenia (32 , 33) . Our results are also in agreement with several cognitive models of schizophrenia, suggesting that the cognitive symptoms of schizophrenia have a functional counterpart in impaired excitatory cortico-cortical connections (34 , 35) . Furthermore, evidence from pharmacological, modeling, and postmortem studies suggests that there are deficits in cortico-cortical glutamate transmission, mediated by N -methyl- d -aspartic-acid receptors, in schizophrenia (36) .
There is increased evidence suggesting that the thalamus plays a role in the generation of gamma oscillations. First, electrophysiological studies combining intracellular thalamic recordings with cortical local field potentials have shown that EEG gamma oscillations are associated with a coherent gamma oscillatory activity in thalamic and cortical neurons (37) . Additionally, a large-scale simulation of the thalamocortical system showed that both cortical and thalamic neurons are involved in generating gamma oscillations (38) . In particular, this model revealed that cortico-thalamocortical loops, after lesions of cortico-cortical connections, can sustain gamma oscillations over the cortical depth and the thalamus. Moreover, intracranial recordings in humans (39) have revealed abnormalities in the firing patterns of thalamic neurons in several neurological diseases that are characterized by the disruption of gamma oscillations and by the appearance of low frequencies at the EEG/magnetoencephalogram level (40) . Intriguingly, involvement of thalamocortical circuits in schizophrenia has also been suggested in the results of high-density EEG recordings during sleep (10) , another approach that does not require any cognitive involvement by the subject. That study found that schizophrenia patients had deficits in sleep spindle activity, an oscillatory rhythm generated by the interplay between reticular and relay thalamic nuclei and amplified by thalamo-cortico-thalamic interactions. Thus, converging lines of evidence point to a dysfunction in thalamocortical circuits as a core deficit in schizophrenia.
1. Kwon JS, O’Donnell BF, Wallenstein GV, Greene RW, Hirayasu Y, Nestor PG, Hasselmo ME, Potts GF, Shenton ME, McCarley RW: Gamma frequency-range abnormalities to auditory stimulation in schizophrenia. Arch Gen Psychiatry 1999; 56:1001–1005Google Scholar
2. Light GA, Hsu JL, Hsieh MH, Meyer-Gomes K, Sprock J, Swerdlow NR, Braff DL: Gamma band oscillations reveal neural network cortical coherence dysfunction in schizophrenia patients. Biol Psychiatry 2006; 60:1231–1240Google Scholar
3. Hong LE, Summerfelt A, McMahon R, Adami H, Francis G, Elliott A, Buchanan RW, Thaker GK: Evoked gamma band synchronization and the liability for schizophrenia. Schizophr Res 2004; 70:293–302Google Scholar
4. Cho RY, Konecky RO, Carter CS: Impairments in frontal cortical gamma synchrony and cognitive control in schizophrenia. Proc Natl Acad Sci U S A 2006; 103:19878–19883Google Scholar
5. Clementz BA, Blumenfeld LD, Cobb S: The gamma band response may account for poor P50 suppression in schizophrenia. Neuroreport 1997; 8:3889–3893Google Scholar
6. Lee KH, Williams LM, Breakspear M, Gordon E: Synchronous gamma activity: a review and contribution to an integrative neuroscience model of schizophrenia. Brain Res Brain Res Rev 2003; 41:57–78Google Scholar
7. Spencer KM, Nestor PG, Perlmutter R, Niznikiewicz MA, Klump MC, Frumin M, Shenton ME, McCarley RW: Neural synchrony indexes disordered perception and cognition in schizophrenia. Proc Natl Acad Sci U S A 2004; 101:17288–17293Google Scholar
8. Symond MP, Harris AW, Gordon E, Williams LM: “Gamma synchrony” in first-episode schizophrenia: a disorder of temporal connectivity? Am J Psychiatry 2005; 162:459–465Google Scholar
9. Uhlhaas PJ, Linden DE, Singer W, Haenschel C, Lindner M, Maurer K, Rodriguez E: Dysfunctional long-range coordination of neural activity during Gestalt perception in schizophrenia. J Neurosci 2006; 26:8168–8175Google Scholar
10. Ferrarelli F, Huber R, Peterson MJ, Massimini M, Murphy M, Riedner BA, Watson A, Bria P, Tononi G: Reduced sleep spindle activity in schizophrenia patients. Am J Psychiatry 2007; 164:483–492Google Scholar
11. Ilmoniemi RJ, Virtanen J, Ruohonen J, Karhu J, Aronen HJ, Naatanen R, Katila T: Neuronal responses to magnetic stimulation reveal cortical reactivity and connectivity. Neuroreport 1997; 8:3537–3540Google Scholar
12. Thielscher A, Kammer T: Linking physics with physiology in TMS: a sphere field model to determine the cortical stimulation site in TMS. Neuroimage 2002; 17:1117–1130Google Scholar
13. Nikouline V, Ruohonen J, Ilmoniemi RJ: The role of the coil click in TMS assessed with simultaneous EEG. Clin Neurophysiol 1999; 110:1325–1328Google Scholar
14. Massimini M, Ferrarelli F, Huber R, Esser SK, Singh H, Tononi G: Breakdown of cortical effective connectivity during sleep. Science 2005; 309:2228–2232Google Scholar
15. Delorme A, Makeig S: EEGLAB: an open source toolbox for analysis of single-trial EEG dynamics including independent component analysis. J Neurosci Methods 2004; 134:9–21Google Scholar
16. Pascual-Marqui RD: Standardized low-resolution brain electromagnetic tomography (sLORETA): technical details. Methods Find Exp Clin Pharmacol 2002; 24(suppl D):5–12Google Scholar
17. Nichols TE, Holmes AP: Nonparametric permutation tests for functional neuroimaging: a primer with examples. Hum Brain Mapp 2002; 15:1–25Google Scholar
18. Cohen J: Statistical Power Analysis for the Behavioral Sciences. Hillsdale, NJ, Erlbaum, 1988Google Scholar
19. Gallinat J, Winterer G, Herrmann CS, Senkowski D: Reduced oscillatory gamma-band responses in unmedicated schizophrenic patients indicate impaired frontal network processing. Clin Neurophysiol 2004; 115:1863–1874Google Scholar
20. Slewa-Younan S, Gordon E, Harris AW, Haig AR, Brown KJ, Flor-Henry P, Williams LM: Sex differences in functional connectivity in first-episode and chronic schizophrenia patients. Am J Psychiatry 2004; 161:1595–1602Google Scholar
21. Spencer KM, Nestor PG, Niznikiewicz MA, Salisbury DF, Shenton ME, McCarley RW: Abnormal neural synchrony in schizophrenia. J Neurosci 2003; 23:7407–7411Google Scholar
22. Barker AT, Jalinous R, Freeston IL: Non-invasive magnetic stimulation of human motor cortex. Lancet 1985; 1:1106–1117Google Scholar
23. Haraldsson HM, Ferrarelli F, Kalin NH, Tononi G: Transcranial magnetic stimulation in the investigation and treatment of schizophrenia: a review. Schizophr Res 2004; 71:1–16Google Scholar
24. Green MF, Nuechterlein KH: Cortical oscillations and schizophrenia: timing is of the essence. Arch Gen Psychiatry 1999; 56:1007–1008Google Scholar
25. Kissler J, Muller MM, Fehr T, Rockstroh B, Elbert T: MEG gamma band activity in schizophrenia patients and healthy subjects in a mental arithmetic task and at rest. Clin Neurophysiol 2000; 111:2079–2087Google Scholar
26. Yeragani VK, Cashmere D, Miewald J, Tancer M, Keshavan MS: Decreased coherence in higher frequency ranges (beta and gamma) between central and frontal EEG in patients with schizophrenia: a preliminary report. Psychiatry Res 2006; 141:53–60Google Scholar
27. Zhou Y, Liang M, Tian L, Wang K, Hao Y, Liu H, Liu Z, Jiang T: Functional disintegration in paranoid schizophrenia using resting-state fMRI. Schizophr Res 2007; 97:194–205Google Scholar
28. Goghari VM, Lang DJ, Flynn SW, Mackay AL, Honer WG: Smaller corpus callosum subregions containing motor fibers in schizophrenia. Schizophr Res 2005; 73:59–68Google Scholar
29. Mitelman SA, Buchsbaum MS, Brickman AM, Shihabuddin L: Cortical intercorrelations of frontal area volumes in schizophrenia. Neuroimage 2005; 27:753–770Google Scholar
30. Manoach DS: Prefrontal cortex dysfunction during working memory performance in schizophrenia: reconciling discrepant findings. Schizophr Res 2003; 60:285–298Google Scholar
31. Whittington MA, Traub RD, Jefferys JG: Synchronized oscillations in interneuron networks driven by metabotropic glutamate receptor activation. Nature 1995; 373:612–615Google Scholar
32. Frith CD, Friston KJ, Herold S, Silbersweig D, Fletcher P, Cahill C, Dolan RJ, Frackowiak RS, Liddle PF: Regional brain activity in chronic schizophrenic patients during the performance of a verbal fluency task. Br J Psychiatry 1995; 167:343–349Google Scholar
33. Lawrie SM, Buechel C, Whalley HC, Frith CD, Friston KJ, Johnstone EC: Reduced frontotemporal functional connectivity in schizophrenia associated with auditory hallucinations. Biol Psychiatry 2002; 51:1008–1011Google Scholar
34. Friston K: Disconnection and cognitive dysmetria in schizophrenia. Am J Psychiatry 2005; 162:429–432Google Scholar
35. Tononi G, Edelman GM: Schizophrenia and the mechanisms of conscious integration. Brain Res Brain Res Rev 2000; 31:391–400Google Scholar
36. Lewis DA, Gonzalez-Burgos G: Pathophysiologically based treatment interventions in schizophrenia. Nat Med 2006; 12:1016–1022Google Scholar
37. Steriade M: Grouping of brain rhythms in corticothalamic systems. Neuroscience 2006; 137:1087–1106Google Scholar
38. Lumer ED, Edelman GM, Tononi G: Neural dynamics in a model of the thalamocortical system, I: layers, loops and the emergence of fast synchronous rhythms. Cereb Cortex 1997; 7:207–227Google Scholar
39. Jeanmonod D, Magnin M, Morel A: Low-threshold calcium spike bursts in the human thalamus: common physiopathology for sensory, motor and limbic positive symptoms. Brain 1996; 119(pt 2):363–375Google Scholar
40. Llinas RR, Ribary U, Jeanmonod D, Kronberg E, Mitra PP: Thalamocortical dysrhythmia: a neurological and neuropsychiatric syndrome characterized by magnetoencephalography. Proc Natl Acad Sci U S A 1999; 96:15222–15227Google Scholar