Association of the Neurotrophic Tyrosine Kinase Receptor 3 ( NTRK3 ) Gene and Childhood-Onset Mood Disorders
Abstract
Objective: Genome scans have revealed significant evidence for linkage of depression to chromosome 15q25.3-q26.2. The gene for neurotrophic tyrosine kinase receptor 3 ( NTRK3 ), the receptor for neurotrophin-3 (trkC) and a key gene in neurotrophin signaling, is located within this region and, given evidence for synaptic plasticity as a mechanism in mood disorders, was considered a prime candidate. The authors investigated NTRK3 as a susceptibility gene for childhood-onset mood disorders. Method: The study sample consisted of 603 families with 723 affected children and adolescents diagnosed with a mood disorder with onset of the first episode by age 15. The authors genotyped 18 polymorphic markers across the NTRK3 gene in this sample and tested for association. Results: Results identified significant evidence for association for five of the markers using the transmission disequilibrium test. Four of the five markers were located in a region of strong linkage disequilibrium and were highly correlated. Haplotype results provided significant evidence for association to haplotypes composed of markers located in two haplotype blocks. Conclusions: The results for NTRK3 as well as the authors’ previous finding for association to brain-derived neurotrophic factor in this sample support synaptic plasticity as a mechanism contributing to mood disorders that begin during childhood and adolescence and specifically implicate the NTRK3 gene as a contributing factor in the 15q-linked region.
Mood disorders are complex disorders with moderate heritability. Family and twin studies show the highest relative risk for depressive disorders in families of probands with early age at onset and/or recurrent episodes compared with the risk in the general population (1 – 3) . Because of this, a number of studies have focused on families identified through probands with early-onset depression for genetic studies (4 – 6) .
A genome scan using 297 families with a proband who had recurrent early-onset major depressive disorder (defined as onset before age 31 for the probands and age 41 for affected relatives) observed significant evidence for linkage on chromosome 15q25.3-q26.2 (lod [logarithm of the odds ratio for linkage] score=3.73) (4) . The most significant scores were observed for the markers D15S652 and GATA128A02. Fine mapping in that region using single nucleotide polymorphisms (SNPs) provided a more significant result with a z likelihood ratio score of 4.69 (equivalent Kong-Cox lod score=4.78) at ∼92 Mb on the physical map (University of California, Santa Cruz [UCSC] Genome Browser, build 34) (7) .
An independent genome scan of 497 sib pairs with recurrent depression found a modest signal for linkage at the same position of chromosome 15q, with the most significant marker (D15S1047) located approximately 11 Mb proximal to D15S652 (8) . Another genome scan, using 87 pedigrees from Utah with recurrent early-onset depression and anxiety disorders, found suggestive evidence for linkage to 15q in this same region (6) . Sex-specific analyses provided stronger evidence in favor of linkage in this region in males (lod score=2.88) for the phenotypes depression or anxiety for the marker D15S1515 on 15q26.2.
There are a number of neuron-related genes located in 15q25.3-q26.2 identified in the linkage studies of this region, including neurotrophic tyrosine kinase receptor 3 ( NTRK3 ), neugrin, neurite outgrowth associated ( NGRN ), transducer of regulated cAMP response element-binding protein 3 ( TORC3 ), synaptic vesicle glycoprotein 2B ( SV2B ), and repulsive guidance molecule member A ( RGMA ). Key among these genes is NTRK3 . NTRK3 is a member of the TRK family of tyrosine protein kinase genes, which includes trkA ( NTRK1 ) and trkB ( NTRK2 ). The protein product of the NTRK3 gene, trkC, is expressed preferentially in the brain, with transcripts in the hippocampus, cerebral cortex, prefrontal cortex, cingulate cortex, and the granular layer of the cerebellum (http://www.brain-map.org/welcome.do; http://symatlas.gnf.org/SymAtlas/). The neurotrophin family consists of nerve growth factor (NGF), brain-derived neurotrophic factor (BDNF), neurotrophin-4/5 and neurotrophin-3. TrkC is the receptor for neurotrophin-3 (NTF3) but does not bind NGF or BDNF.
Duman et al. (9) suggested a neurotrophic hypothesis of depression and antidepressant action, indicating that the inability of neural systems to exhibit appropriate adaptive plasticity could contribute to the pathogenesis of depression. The evidence for neural plasticity in depression is based on a number of lines of evidence, including evidence that antidepressant treatment up-regulates the cAMP signal transduction cascade, increases the expression of CREB (cAMP response element binding protein), and up-regulates the neurotrophin signaling pathways that are involved in neural plasticity and survival (9 , 10) .
Specifically supporting neuronal plasticity as a mechanism in the genetic susceptibility to mood disorders has been the finding of association of BDNF with mood disorders in several samples (11 – 14) . More pertinent to the study of childhood-onset mood disorders is our previous finding for association of BDNF in a case-control sample of probands with mood disorders that began before the age of 14.9 years (11) and evidence for association of childhood-onset mood disorders in a sample of families from Hungary ( 12 ; we used the same sample in this study).
Given our previous data indicating BDNF as a susceptibility gene in this sample and given this gene’s location in the chromosome 15q region linked to early-onset depression, in this study we investigated the NTRK3 gene as a susceptibility gene in childhood-onset mood disorders.
Method
Subjects
Details of the diagnostic assessment and the inclusion and exclusion criteria for the families enrolled in this study have been published elsewhere (15) . Families were recruited from 23 mental health facilities across Hungary as part of a multidisciplinary program project to study risk factors in childhood-onset mood disorders (15) . The probands were diagnosed using the Interview Schedule for Children and Adolescents—Diagnostic Version, which is an extension and modification of the original version (16) . Children and parents were interviewed separately, and approximately 1 month later both were interviewed again. Children were interviewed about themselves, and parents about their child’s symptoms. The final diagnosis was based on the consensus diagnosis of two independent child psychiatrists. The probands met DSM-IV criteria for a mood disorder (depressive disorder or bipolar disorder), with the onset of the first episode by 14.9 years of age. For 14 of the siblings, onset of depression occurred between ages 15 and 18. The analyses for this study were based on the genotypes of 603 families with 723 affected children. At the time of diagnosis, 0.8% of the children met the criteria for bipolar disorder. Given the young age of the children, we expect that 20% to 30% of those who are currently diagnosed with unipolar depression will develop bipolar disorder as they mature. Because it is not possible to predict which of these children will develop bipolar disorder, they cannot be excluded from our sample. Moreover, family and twin studies indicate that bipolar and depressive disorders share substantial genetic overlap (17) .
Genotyping and DNA Screening
To investigate NTRK3 as a susceptibility gene in childhood-onset mood disorders, we genotyped 18 markers across the gene and tested for association. DNA was extracted from blood using a standard high salt method. The initial 10 markers selected for genotyping were chosen to represent the haplotype blocks identified in HapMap in the Centre d’Etude de Polymorphisme Humain’s Utah sample, consisting of Utah residents with ancestry from northern and western Europe. These markers were chosen using Haploview version 2.03 and based on HapMap, release 19/phase II (October 2005). After the identification of positive results from these markers, additional markers were selected to represent the major haplotypes in those blocks. All polymorphisms for this study were genotyped using the TaqMan 5′ nuclease assay with primers and probes available commercially (Applied Biosystems, Foster City, Calif., TaqMan SNP Genotyping Assay) or designed specifically for this study (Applied Biosystems, Custom TaqMan SNP Genotyping Assay). For each assay, 5 μl PCR reactions contained 30 ng of genomic DNA, 2.5 μl of 2× TaqMan Universal PCR Master Mix (Applied Biosystems), and 0.25 μl of 20× SNP genotyping assay mix containing 18 μmol/liter of each primer and 4 μmol/liter of each probe. The thermal cycling conditions were 95°C for 10 minutes, then 40 cycles of 95°C for 15 seconds and 1 minute at the annealing temperature of 59°C. Two negative controls were included for each 96-well plate. Plates were read on the ABI 7900HT Sequence Detection System using the allelic discrimination endpoint analysis mode of the software package version 2.0 (Applied Biosystems).
To screen for DNA variation in the exons around the positive markers, we amplified eight of the exons from 48 probands for screening by denaturing high performance chromatography. Overlapping sets of primers were designed to cover the exons as well as the intron-exon splice junctions.
Statistical Analysis
All data were screened for Mendelian errors using PEDSTATS, and MERLIN was used to detect any crossovers between markers (18) . This data set was free of any detectable Mendelian errors, and none of the markers used in the analyses deviated from the Hardy-Weinberg equilibrium. One polymorphism, rs2117655, was found to have Mendelian errors and was not in Hardy-Weinberg equilibrium. By sequencing we identified a second polymorphism next to the polymorphism that interfered with the interpretation of the assay, and genotypes from this marker were not analyzed further. For each marker included in the analyses, genotypes were complete on 99.4% to 99.9% of the available DNA samples, with an average of 99.7% completion for the 18 markers.
We used the extended transmission disequilibrium test program (19) for analyses of the transmission disequilibrium test of single markers. One thousand permutation tests were conducted using the UNPHASED program (20) to correct p values for multiple testing. This analysis produces a significance level that corrects for the number of markers analyzed while taking into account the correlation between markers. One thousand permutations were run using the “robust permutation” option, which is robust to prior linkage (20) . Association of haplotypes was evaluated using TRANSMIT (21) with the “robust estimator” option. Haplotypes with frequencies less than 10% were pooled, and χ 2 and p values are reported only for those with frequencies greater than 10%. The degree of linkage disequilibrium (LD) between markers was evaluated using Haploview 3.2 ( 22 ; http://www.broad.mit.edu/mpg/haploview).
Results
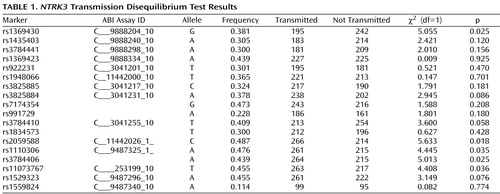
Figure 1 shows the location of the 18 markers we genotyped across the NTRK3 gene in relation to the exon-intron structure and the degree of LD between markers (D′) of the gene. Note that because of the scale of Figure 1 , exons that are separated by small introns are not distinguishable from each other (see http://genome.ucsc.edu/cgi-bin/hgGateway). Of the 18 markers genotyped for the final analyses, five provided evidence of association using the transmission disequilibrium test ( Table 1 ). We note that the exon structure of this gene is complex with alternatively spliced exons indicated in the UCSC Genome Browser (http://genome.ucsc.edu/cgi-bin/hgGateway). Additional exons may still be identified. Our current exon prediction is based on exon nomenclature on the UCSC web site (March 2006, build 36.1). Four of the five positive markers were located in introns 4 through 12, and the fifth was located in intron 16. The markers across introns 4 through 12 were in a region of high LD and were highly correlated, showing a similar transmission pattern. The most significant marker was rs2059588, with a p value of 0.018. This value did not maintain global significance after permutation testing (p=0.2178, SE=0.01305). We screened exons 5 through 12 in the area spanning the region of four of the positive markers using denaturing high-performance liquid chromatography in DNA from 48 of the probands to identify DNA changes with potential to change the coding sequence or the predicted splice sites of the gene. We did not identify any DNA variation in these exons.
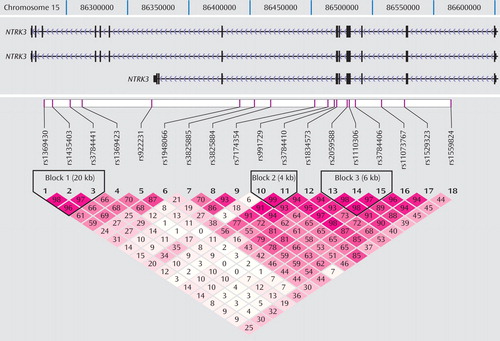
Analyses were based on the genotypes of 603 families with 723 children and adolescents diagnosed with mood disorders with onset of the first episode by age 15. In the figure, note that many of the exons are small and separated by small introns, and on the scale of this map they cannot be distinguished. The position of the markers and genomic structure are taken from University of California, Santa Cruz (UCSC) Genome Browser, build 36.1; UCSC gene predictions are based on RefSeq, UniProt, GenBank, and Comparative Genomics.
Haplotypes were analyzed using the three blocks of strong LD across the gene (LD blocks shown in Figure 1 , results shown in Table 2 ). Blocks were defined by the algorithm set out by Gabriel and colleagues (23) . Haplotype blocks can be defined using a number of different methods, including LD based, diversity based, and recombination. Blocks defined by LD and recombination-based methods generally provide similar blocks. We also compared the blocks defined by the Gabriel et al. algorithm with the blocks defined using the solid spine of LD and the four-gamete rule algorithms in Haploview 3.2 for comparison. All three methods defined the first block as containing the three markers (rs1369430, rs1435403, and rs3784441) located in the 3′ end of the gene. Block 3 was defined by the same markers for both the Gabriel et al. and the four-gamete rule algorithms with an additional two markers (rs11073767 and rs1529323) included in the block defined by the solid spine of LD algorithm.
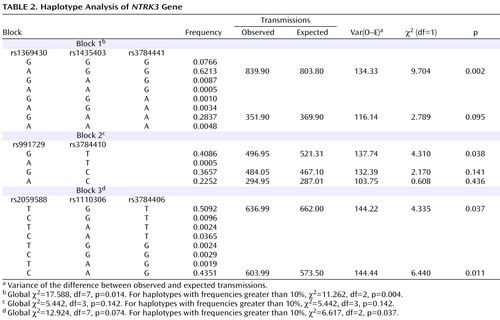
The results were significant for two of the three blocks analyzed. For the first block, composed of markers rs1369430, rs1435403, and rs3784441, the common haplotype (frequency 0.62) was overtransmitted to affected offspring (χ 2 =9.704, df=1, p=0.002), with a global χ 2 value of 11.262 (df=2, p=0.004) for the two haplotypes with frequency greater than 10% and the pooled analyses of the haplotypes with frequency less than 10% ( Table 2 ). For the third block, composed of markers rs2059588, rs1110306, and rs3784406, two haplotypes with frequency greater than 10% were biased in transmission (one overtransmitted and one undertransmitted), with a global χ 2 value of 6.617 (df=2, p=0.037).
Discussion
Previous genome scans for mood disorders have implicated the 15q region (4 , 6 – 8 , 24) . Located in the interval between the most significant single markers and flagged in the 15q region from the Holmans et al. (4) and McGuffin et al. (8) genome scans is the NTRK3 gene, which is located 7 Mb distal to D15S1047 (8) and 5 Mb proximal to D15S652 (4) . This gene is also located 9.5 Mb proximal to the most significant marker on 15q from the Camp et al. study (6) .
The results reported here, particularly the significant results from the haplotype analyses, indicate that genetic variation in the NTRK3 gene could contribute to the linkage signals in the 15q region reported in genome scans for mood disorders. The significance of the most positive single marker results, after correcting for multiple tests, is quite modest, particularly given the number of informative transmissions provided by this large sample of families. This may indicate that the gene is not a major contributor to the overall risk for depression as previously indicated from linkage studies of this region (25) . However, as we have not identified the functional DNA change contributing to depression, the amount of LD between the chosen markers and the functional DNA changes will influence the power of the analyses. When we started our study of this gene, 10 tag SNPs were identified based on HapMap, release 19/phase II (October 2005). The current version of HapMap (release 22/phase II, April 2007) indicates that 57 markers would be required to tag the major haplotypes with r 2 >0.80 and minor allele frequency >0.20. As additional genetic variation is identified for this gene, additional markers may be required. Thus, the full complexity of LD is difficult to capture at this point. Markers with weak LD to the functional DNA variants will underestimate the contribution of a gene to the phenotype, and this will undoubtedly influence the power to fully detect the contribution of this gene to mood disorders. Furthermore, if there are multiple DNA changes contributing to the phenotype on different haplotypes, association analyses will not provide evidence for a strong relationship. Thus, until the functional DNA changes are identified, the risk conferred by this gene cannot be fully estimated.
Independent support for this gene as a contributor to early-onset depression was presented at the 2007 World Congress on Psychiatric Genetics (26) . Interestingly, the associated markers in that study were located in the same region where we identify association in this sample. This independent support for association is encouraging, and functional studies are now warranted. Given the large size (∼400 kb) and complex LD structure of NTRK3 , identifying the contributing DNA changes is likely to be challenging. Our association results point to a large 28-kb region spanning exons 5–12 as well as a 3′ region. We have ruled out coding region changes in the exons we have screened, suggesting the possibility that changes in a gene regulatory element may contribute to risk. Genetic variation that results in changes to gene expression, rather than variation in the coding regions, is predicted to play a major role in complex traits (27 – 29) . The tasks of identifying the regulatory elements and determining the contribution of DNA variation within the region will not be trivial. Regulatory elements can be located anywhere within a gene as well as in the area surrounding the gene, even megabases away (30) . Transcription factor binding sites are small (∼5–8 bp), and degenerate, which makes it difficult to use bioinformatic tools alone to predict regulatory elements (31) . Redundancy in the sequence of the transcription binding sites makes it difficult to predict the impact of a single nucleotide change, and because of the modularity of the binding sites, a combination of changes may be required to result in a change of function (31) . Recently the position of modified histones (e.g., methylation and acetylation) has been used to map regulatory elements, and we plan to use chromatin immunoprecipitation to modified histones and microarrays (ChIP-chip) to map regulatory regions across the gene (32; Z. Xu et al., unpublished 2008 data; J.M. Couto et al., unpublished 2008 data).
Twin and family studies indicate that mood disorders are complex, with multiple genes involved, and any one gene will be unlikely to have a large contribution to risk. Association studies now point to a few candidate genes with support from multiple studies (33) , but currently it is unknown how these genes work, either independently or in concert, to contribute to risk. On smaller subsets of the sample of families used here, we have previously identified association to the genes encoding BDNF (12) , arginine vasopressin (AVP) (E.L. Dempster et al., unpublished 2008 data), and the receptor for arginine vasopressin 1B (34) .
Several lines of evidence suggest the possibility of interaction of BDNF and the hypothalamic-pituitary-adrenal (HPA) axis in risk for mood disorders, including the observation that glucocorticoids down-regulate the expression of BDNF (35) . BDNF expression appears to co-localize with AVP and corticotropin-releasing hormone (CRH) in the hypothalamic paraventricular nucleus (36 , 37) . Studies show that immobilization stress in rats induces an increase in BDNF expression that precedes the increase of both CRH and AVP in the hypothalamic paraventricular nucleus (37) , and chronic exogenous administration of BDNF into the brains of rats was found to mediate changes in the HPA axis (38) . The relationship of NTRK3 to the HPA axis, on the other hand, is not clear. One study indicated that NTRK3 mRNA is not regulated by corticosterone in the rat hippocampus (39) , whereas a later study indicated that early postnatal corticosterone regulates neurotrophins including NTRK3 in the hippocampus (40) . Thus, at present, an integrated model to how these genes contribute to risk is not possible. The association findings reported here for NTRK3 and the identification of functional variants will likely spark more focused functional studies on the interrelationship of these genes.
1. Kessler RC, Avenevoli S, Ries MK: Mood disorders in children and adolescents: an epidemiologic perspective. Biol Psychiatry 2001; 49:1002–1014Google Scholar
2. Kovacs M, Devlin B, Pollock M, Richards C, Mukerji P: A controlled family history study of childhood-onset depressive disorder. Arch Gen Psychiatry 1997; 54:613–623Google Scholar
3. Thapar A, Rice F: Twin studies in pediatric depression. Child Adolesc Psychiatr Clin N Am 2006; 15:869–881Google Scholar
4. Holmans P, Zubenko GS, Crowe RR, DePaulo JR Jr, Scheftner WA, Weissman MM, Zubenko WN, Boutelle S, Murphy-Eberenz K, MacKinnon D, McInnis MG, Marta DH, Adams P, Knowles JA, Gladis M, Thomas J, Chellis J, Miller E, Levinson DF: Genomewide significant linkage to recurrent, early-onset major depressive disorder on chromosome 15q. Am J Hum Genet 2004; 74:1154–1167Google Scholar
5. Zubenko GS, Maher B, Hughes HB 3rd, Zubenko WN, Stiffler JS, Kaplan BB, Marazita ML: Genome-wide linkage survey for genetic loci that influence the development of depressive disorders in families with recurrent, early-onset, major depression. Am J Med Genet B Neuropsychiatr Genet 2003; 123:1–18Google Scholar
6. Camp NJ, Lowry MR, Richards RL, Plenk AM, Carter C, Hensel CH, Abkevich V, Skolnick MH, Shattuck D, Rowe KG, Hughes DC, Cannon-Albright LA: Genome-wide linkage analyses of extended Utah pedigrees identifies loci that influence recurrent, early-onset major depression and anxiety disorders. Am J Med Genet B Neuropsychiatr Genet 2005; 135:85–93Google Scholar
7. Levinson DF, Evgrafov OV, Knowles JA, Potash JB, Weissman MM, Scheftner WA, Depaulo JR Jr, Crowe RR, Murphy-Eberenz K, Marta DH, McInnis MG, Adams P, Gladis M, Miller EB, Thomas J, Holmans P: Genetics of Recurrent Early-Onset Major Depression (GenRED): significant linkage on chromosome 15q25-q26 after fine mapping with single nucleotide polymorphism markers. Am J Psychiatry 2007; 164:259–264Google Scholar
8. McGuffin P, Knight J, Breen G, Brewster S, Boyd PR, Craddock N, Gill M, Korszun A, Maier W, Middleton L, Mors O, Owen MJ, Perry J, Preisig M, Reich T, Rice J, Rietschel M, Jones L, Sham P, Farmer AE: Whole genome linkage scan of recurrent depressive disorder from the depression network study. Hum Mol Genet 2005; 14:3337–3345Google Scholar
9. Duman RS, Heninger GR, Nestler EJ: A molecular and cellular theory of depression. Arch Gen Psychiatry 1997; 54:597–606Google Scholar
10. Duman RS: Depression: a case of neuronal life and death? Biol Psychiatry 2004; 56:140–145Google Scholar
11. Strauss J, Barr CL, George CJ, King N, Shaikh S, Devlin B, Kovacs M, Kennedy JL: Association study of brain-derived neurotrophic factor in adults with a history of childhood onset mood disorder. Am J Med Genet B Neuropsychiatr Genet 2004; 131:16–19Google Scholar
12. Strauss J, Barr CL, George CJ, Devlin B, Vetró A, Kiss E, Baji I, King N, Shaikh S, Lanktree M, Kovacs M, Kennedy JL: Brain-derived neurotrophic factor variants are associated with childhood-onset mood disorder: confirmation in a Hungarian sample. Mol Psychiatry 2005; 10:861–867Google Scholar
13. Sklar P, Gabriel SB, McInnis MG, Bennett P, Lim YM, Tsan G, Schaffner S, Kirov G, Jones I, Owen M, Craddock N, DePaulo JR, Lander ES: Family-based association study of 76 candidate genes in bipolar disorder: BDNF is a potential risk locus. Mol Psychiatry 2002; 7:579–593Google Scholar
14. Neves-Pereira M, Mundo E, Muglia P, King N, Macciardi F, Kennedy JL: The brain-derived neurotrophic factor gene confers susceptibility to bipolar disorder: evidence from a family-based association study. Am J Hum Genet 2002; 71:651–655Google Scholar
15. Liu X, Gentzler AL, Tepper P, Kiss E, Kothencné VO, Tamás Z, Vetró A, Kovacs M: Clinical features of depressed children and adolescents with various forms of suicidality. J Clin Psychiatry 2006; 67:1442–1450Google Scholar
16. Sherrill JT, Kovacs M: Interview Schedule for Children and Adolescents (ISCA). J Am Acad Child Adolesc Psychiatry 2000; 39:67–75Google Scholar
17. McGuffin P, Rijsdijk F, Andrew M, Sham P, Katz R, Cardno A: The heritability of bipolar affective disorder and the genetic relationship to unipolar depression. Arch Gen Psychiatry 2003; 60:497–502Google Scholar
18. Abecasis GR, Cherny SS, Cookson WO, Cardon LR: Merlin: rapid analysis of dense genetic maps using sparse gene flow trees. Nat Genet 2002; 30:97–101Google Scholar
19. Sham PC, Curtis D: An extended transmission/disequilibrium test (TDT) for multi-allele marker loci. Ann Hum Genet 1995; 59:323–336Google Scholar
20. Dudbridge F: Pedigree disequilibrium tests for multilocus haplotypes. Genet Epidemiol 2003; 25:115–121Google Scholar
21. Clayton D, Jones H: Transmission/disequilibrium tests for extended marker haplotypes. Am J Hum Genet 1999; 65:1161–1169Google Scholar
22. Barrett JC, Fry B, Maller J, Daly MJ: Haploview: analysis and visualization of LD and haplotype maps. Bioinformatics 2005; 21:263–265Google Scholar
23. Gabriel SB, Schaffner SF, Nguyen H, Moore JM, Roy J, Blumenstiel B, Higgins J, DeFelice M, Lochner A, Faggart M, Liu-Cordero SN, Rotimi C, Adeyemo A, Cooper R, Ward R, Lander ES, Daly MJ, Altshuler D: The structure of haplotype blocks in the human genome. Science 2002; 296:2225–2229Google Scholar
24. Holmans P, Weissman MM, Zubenko GS, Scheftner WA, Crowe RR, Depaulo JR Jr, Knowles JA, Zubenko WN, Murphy-Eberenz K, Marta DH, Boutelle S, McInnis MG, Adams P, Gladis M, Steele J, Miller EB, Potash JB, Mackinnon DF, Levinson DF: Genetics of Recurrent Early-Onset Major Depression (GenRED): final genome scan report. Am J Psychiatry 2007; 164:248–258Google Scholar
25. McGuffin P, Cohen S, Knight J: Homing in on depression genes. Am J Psychiatry 2007; 164:195–197Google Scholar
26. Verma R, Holmans P, Knowles JA, Cutler DJ, Grover D, Evgrafov OV, et al. Association of common variation in NTRK3 with major depression: evidence from fine-mapping of a chromosome 15q25–26 linkage region and follow-up sequencing. Presented at the 15th World Congress on Psychiatric Genetics, New York, Oct 7–11, 2007Google Scholar
27. Knight JC: Regulatory polymorphisms underlying complex disease traits. J Mol Med 2005; 83:97–109Google Scholar
28. Buckland PR, Hoogendoorn B, Coleman SL, Guy CA, Smith SK, O’Donovan MC: Strong bias in the location of functional promoter polymorphisms. Hum Mutat 2005; 26:214–223Google Scholar
29. Rockman MV, Wray GA: Abundant raw material for cis-regulatory evolution in humans. Mol Biol Evol 2002; 19:1991–2004Google Scholar
30. Lettice LA, Heaney SJ, Purdie LA, Li L, de Beer P, Oostra BA, Goode D, Elgar G, Hill RE, de Graaff E: A long-range Shh enhancer regulates expression in the developing limb and fin and is associated with preaxial polydactyly. Hum Mol Genet 2003; 12:1725–1735Google Scholar
31. Wasserman WW, Sandelin A: Applied bioinformatics for the identification of regulatory elements. Nat Rev Genet 2004; 5:276–287Google Scholar
32. Heintzman ND, Stuart RK, Hon G, Fu Y, Ching CW, Hawkins RD, Barrera LO, Van Calcar S, Qu C, Ching KA, Wang W, Weng Z, Green RD, Crawford GE, Ren B: Distinct and predictive chromatin signatures of transcriptional promoters and enhancers in the human genome. Nat Genet 2007; 39:311–318Google Scholar
33. Craddock N, Forty L: Genetics of affective (mood) disorders. Eur J Hum Genet 2006; 14:660–668Google Scholar
34. Dempster EL, Burcescu I, Wigg K, Kiss E, Baji I, Gadoros J, Tamás Z, Kennedy JL, Vetró A, Kovacs M, Barr CL: Evidence of an association between the vasopressin V1b receptor gene (AVPR1B) and childhood-onset mood disorders. Arch Gen Psychiatry 2007; 64:1189–1195Google Scholar
35. Grundy PL, Patel N, Harbuz MS, Lightman SL, Sharples PM: Glucocorticoids modulate BDNF mRNA expression in the rat hippocampus after traumatic brain injury. Neuroreport 2000; 11:3381–3384Google Scholar
36. Castren E, Thoenen H, Lindholm D: Brain-derived neurotrophic factor messenger RNA is expressed in the septum, hypothalamus, and in adrenergic brain stem nuclei of adult rat brain and is increased by osmotic stimulation in the paraventricular nucleus. Neuroscience 1995; 64:71–80Google Scholar
37. Givalois L, Naert G, Rage F, Ixart G, Arancibia S, Tapia-Arancibia L: A single brain-derived neurotrophic factor injection modifies hypothalamo-pituitary-adrenocortical axis activity in adult male rats. Mol Cell Neurosci 2004; 27:280–295Google Scholar
38. Naert G, Ixart G, Tapia-Arancibia L, Givalois L: Continuous i.c.v. infusion of brain-derived neurotrophic factor modifies hypothalamic-pituitary-adrenal axis activity, locomotor activity, and body temperature rhythms in adult male rats. Neuroscience 2006; 139:779–789Google Scholar
39. Schaaf MJ, Hoetelmans RW, de Kloet ER, Vreugdenhil E: Corticosterone regulates expression of BDNF and trkB but not NT-3 and trkC mRNA in the rat hippocampus. J Neurosci Res 1997; 48:334–341Google Scholar
40. Roskoden T, Otten U, Schwegler H: Early postnatal corticosterone administration regulates neurotrophins and their receptors in septum and hippocampus of the rat. Exp Brain Res 2004; 154:183–191Google Scholar