Association of the Tau Haplotype H2 With Age at Onset and Functional Alterations of Glucose Utilization in Frontotemporal Dementia
Abstract
Objective: The microtubule-associated protein tau gene ( MAPT ) contains two extended haplotypes, H1 and H2, which have been linked with sporadic tauopathies. However, there is little evidence as to how these haplotypes may influence the clinical features of the disease. The aim of this study was to investigate the MAPT haplotypes in relation to risk for, and functional alterations of glucose metabolism in, patients with frontotemporal dementia (FTD). Method: The authors investigated MAPT haplotypes in 142 individuals with FTD and 292 comparison subjects. Additionally, in a subset of 41 individuals with FTD and 16 comparison subjects, the authors undertook functional [ 18 F]fluorodeoxyglucose positron emission tomography (PET) imaging. Results:MAPT haplotype distribution did not differ significantly between individuals with FTD and comparison subjects. However, the H2 haplotype was clinically associated with an earlier age at onset of FTD, which presented in a dose-dependent manner. Correspondingly, PET analysis revealed functional differences in glucose utilization patterns between MAPT haplotypes, with H2 carriers having a more pronounced hypometabolism in frontal brain areas than H1 carriers, which could not be accounted for by differences in duration of illness. Conclusions: While the extended MAPT H1 and H2 haplotypes do not appear to confer risk for disease development, the H2 haplotype appears to modify age at onset and functionally shows a more severe decline of glucose utilization in frontal brain areas.
Frontotemporal dementia (FTD) is the common umbrella term for a clinically heterogeneous group of neurodegenerative diseases that present with focal cerebral atrophies of the frontal and/or temporal lobes. The major clinical presentations of the disease include the frontal/behavioral variant of FTD, which presents with behavioral, mood, and personality changes; primary progressive aphasia, with impairment of expressive language; and semantic dementia, a fluent anomia with impaired comprehension. With progression of the disease, these clinical features tend to overlap. Other phenotypes belonging to this group of diseases include FTD with parkinsonism linked to chromosome 17, progressive supranuclear palsy, and corticobasal degeneration, all of which present with parkinsonian-like symptoms (1 , 2) . The finding that most of these neurodegenerative diseases, as well as Alzheimer’s disease, are characterized by fibrillar aggregates of the microtubule-associated protein tau has led to use of the neuropathology/biochemistry-based classification term tauopathies . While mutations of the tau protein gene ( MAPT ) on chromosome 17q21 have been identified as the cause of FTD with parkinsonism linked to chromosome 17 (3 , 4) , MAPT does not appear to be mutated in the other FTDs.
However, the region containing MAPT has been shown to contain two extended haplotypes, termed H1 and H2, whose occurrence has been suggested to have been an ancient event (5) and in which studies suggest an absence of recombination (6) . The H1 haplotype is the predominant haplotype in all ethnic groups, whereas the H2 haplotype seems to be primarily of European origin (7) . Functional differences in transcriptional activity have been attributed to the different haplotypes, with the H1 haplotype reported to have more activity than the H2 haplotype (8) .
Regarding genetic associations with the tauopathies, there is considerable evidence to link the H1 haplotype with progressive supranuclear palsy and corticobasal degeneration (5 , 9 – 12) , as well as with Parkinson’s disease (8 , 13 – 15) . However, there has been far less consensus as to the nature of the MAPT haplotypes’ association with FTD. Some reports suggest that there is no association (16 – 18) , while others report minor risk associated with the H1 haplotype, either with (19) or independent of apolipoprotein E (20) . More recently, carriage of the H2 haplotype was reported to be associated with a lower age at onset of FTD, although no increased risk of the disease was attributed to either haplotype (21) . This lack of association with an increased risk of FTD was supported by the findings of Ghidoni and colleagues (22) , who reported no association with sporadic FTD. However, these authors did report a significant overrepresentation of the H2 haplotype in patients with familial FTD, who, in all but one case, lacked MAPT mutations (22) .
Thus, although there is a considerable literature on the genetic associations of the MAPT haplotypes with tauopathies, there is little evidence as to how these haplotypes may influence the clinical course or neuropathological processes of tauopathies. The aim of this study was to investigate whether the extended MAPT haplotypes H1 and H2 are associated with FTD and to explore whether inheritance of these haplotypes translates functionally to different patterns of cerebral glucose metabolism.
Method
Study Group
Patients were recruited between 1998 and 2003 at two university-based research units for cognitive disorders that have a primary research focus on FTD (Munich University of Technology and University of Regensburg). The study group comprised 142 patients with FTD with no family history of the disorder. The clinical diagnosis of FTD was made according to the Lund-Manchester revised consensus criteria (23) . All individuals in the study group were diagnosed with the frontal/behavioral variant of FTD and had no other subcategory of the disease (i.e., semantic dementia, primary progressive aphasia, progressive supranuclear palsy, or corticobasal degeneration). All patients underwent a thorough diagnostic evaluation, physical examination, and laboratory screening, including brain imaging whenever possible (that is, except when patient compliance was an issue, such as with patients unable to sit still). Patients who met diagnostic criteria for Alzheimer’s disease, Lewy body disease, cerebrovascular disease, schizophrenia, or alcoholism were excluded from the study.
For the population-based comparison group, 292 individuals were recruited from geriatric day care units and screened for cognitive deficits with the Mini-Mental State Examination (MMSE) (24) ; individuals who had an MMSE score below 28 or who presented with psychiatric symptoms, such as depression, delusions, and schizophrenia, were excluded.
For a subset of 41 individuals in the study group (all recruited at Munich University of Technology), cranial magnetic resonance imaging (MRI) and functional [ 18 F]fluorodeoxyglucose (FDG) positron emission tomography (PET) imaging data (all procured at the same site), as well as data from the Consortium to Establish a Registry for Alzheimer’s Disease (CERAD) Neuropsychological Battery (25) , were also available. A total CERAD Neuropsychological Battery score was calculated for each patient according to recently published criteria (the subtest addition method) (26) to control for cognitive status in the statistical analyses of PET data. Briefly, scores from the individual subtests (excluding the MMSE score) were summed into a total composite score (maximum for verbal fluency set at 24 points, maximum total score, 100 points). This score was preferred to the MMSE and other neuropsychological tests because it probes a wider spectrum of cognitive function using more appropriate test paradigms. In the majority of these study participants, data from the Frontal Behavioral Inventory (27) and the Neuropsychiatric Inventory (28) were also available.
Sixteen cognitively healthy comparison subjects were also included in the PET substudy. Data for these individuals came from a preexisting data set of comparison subjects that had been collected for clinical and scientific purposes in the same unit for cognitive disorders (29) . The FDG PET data of these volunteers had been acquired following the same criteria as for the patients, and the population was age-matched to the patient group (mean age=65.0 years, SD=8.0; 43.8% male). The scans of the comparison subjects were acquired on the same scanner, using the same acquisition protocol, reconstruction software, and image-processing procedures. All comparison subjects had undergone brain MRI and neuropsychological evaluation without detection of abnormalities, and none had any history of psychiatric or neurological illness.
Informed written consent was obtained from each participant after the purpose and the procedures of the study had been fully explained to them. The study protocol was approved by the local ethics committees and the radiation protection authorities.
Genetic Analyses
DNA was extracted from blood samples by standard procedures, and APOE genotype was determined by using polymerase chain reaction and restriction enzyme digestion, as described elsewhere (30) . A 238bp insertion/deletion polymorphism within intron 9 ( del-In 9) of MAPT was first described by Baker and colleagues (5) , and the presence of the 238bp insertion has been shown to tag all H1 haplotypes (31) , thus allowing the differentiation of the H1 and H2 haplotypes. Analysis of del-In 9, and thus determination of the two divergent clades, H1 and H2, was performed as described by Baker et al. (5) . No individual carried any mutation within MAPT .
PET Scan Acquisition and Data Processing
Regional cerebral glucose metabolism was measured by using FDG PET imaging, performed under standard resting conditions (eyes closed, in dimmed ambient light and a silent environment), with the patient having fasted for at least 4 hours. With the patient at rest, 370 MBq of FDG was injected. Thirty minutes later, PET imaging was performed with a Siemens ECAT EXACT HR+ scanner (CTI, Knoxville, Tenn.). A sequence of three frames (10 minutes, 5 minutes, and 5 minutes) was started (three-dimensional mode, with a total axial field of view of 15.52 cm) and later combined into a single frame. Attenuation correction was performed using a transmission scan. Data were corrected for random, dead time, and scatter, and images were reconstructed by filtered back-projection with a Hamm filter (cutoff frequency 0.5 cycles/projection element), resulting in 63 slices in a 128×128 pixel matrix (pixel size=2.06 mm) and interplane separation of 2.425 mm.
Statistical parametric mapping software (SPM2, Wellcome Department of Cognitive Neurology, London) based on Matlab, version 6.5 (MathWorks, Natick, Mass.), was used for image realignment, transformation into standard stereotactic space, smoothing, and statistical analysis, as published previously (32) . Images were smoothed using a Gaussian kernel (12×2×12 mm full width at half maximum). Individual global counts were normalized by proportional scaling to a mean value of 50 mg/100 ml per minute.
Statistical Evaluation
Analysis of all demographic and genetic data was performed with SPSS, version 12.0 (SPSS, Inc., Chicago). Demographic data were tested with the Mann-Whitney U test and Student’s t test, for continuous non-normally and normally distributed variables, respectively. Categorical variables were analyzed with either Pearson’s χ 2 or Fisher’s exact test, as appropriate. Association of the MAPT haplotypes with risk of FTD was determined with logistic regression, controlling for gender and age. Associations with age at onset were assessed with linear regression analysis, adjusting for current age.
Statistical evaluation of imaging data included two steps. First, regional cerebral glucose metabolism was compared voxel-by-voxel between healthy comparison subjects and each of the two patient groups (H1 homozygotes and H2 carriers) to identify brain regions with significantly reduced glucose utilization in patients in the study group according to their MAPT haplotype (two-sample t test). In order to minimize false positive findings, only voxels surviving a significance level of p (corrected) <0.05 after correction for multiple comparisons according to random field theory were considered for interpretation in our analyses. Cluster size was set to a minimum of 200 contiguous voxels above a peak height of p=0.05. Second, a group comparison was performed between the regional cerebral glucose metabolism of the two patient groups (two-sample t test), controlling for age, gender, duration of illness, and CERAD Neuropsychological Battery total score. Statistically significant group differences were expected only in brain regions where glucose utilization was lower in the two patient groups than in the healthy comparison group. A lower threshold of p<0.001, uncorrected for multiple comparisons, was applied for this type of analysis, as in previous studies (33) . Montreal Neurological Institute coordinates (34) were transformed to Talairach coordinates (35) using the Matlab function mni2tal (36) . Anatomical regions were identified using the Talairach Daemon Client, version 2.0 (37) .
Results
Table 1 presents the distributions of age, age at onset of symptoms, sex, and MAPT haplotype for the study and comparison groups.

MAPT H1/H2 Haplotype Analysis in FTD
Haplotype (i.e., del-In9 ) frequencies in both patient groups and in the entire study group did not differ significantly from Hardy-Weinberg equilibrium. No significant difference in age or the frequency of the APOE e4 allele was observed between the comparison and study groups. The study group had a higher frequency of males. A logistic regression analysis controlling for gender revealed that MAPT H1 or H2 haplotypes did not confer an increased risk of FTD in either a trend (H1/H1 versus H1/H2 versus H2/H2) or a recessive model (H1/H2 + H2/H2 versus H1/H1).
Linear regression analysis adjusting for current age revealed that H2 carriers had a significantly (p=0.009) lower average age (1.5 years) at onset of symptoms. A gene dosage-dependent trend toward decreasing age at onset with H2 dosage was observed (H2/H2, mean=56.50 years [SD=5.91, range=52–65] < H1/H2, mean=58.46 years [SD=9.99, range=38–78] < H1/H1, mean=59.63 years [SD=9.90, range=34–80]), which was significant after linear regression analysis controlling for age (p=0.005), with a statistically determined 1.5 years earlier age at onset for each H2 haplotype (B=–1.473, SE=0.522).
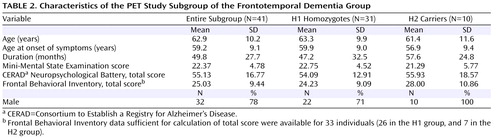
Description of the PET Study Subgroup
FDG PET data were available for 41 of the 142 individuals recruited in this study. Table 2 summarizes the characteristics of the PET study subgroup and the subgroups of H1 and H2 carriers. The PET subgroup contained 31 patients who were homozygous for the common H1 haplotype and 10 who were heterozygous carriers of the H2 haplotype, reflecting a haplotype distribution similar to that of the complete study group. There were no significant differences between groups in mean age, gender distribution, duration of illness (defined as the period between age at onset of symptoms and FDG PET assessment), age at onset of symptoms, and MMSE and CERAD Neuropsychological Battery scores. While H2 carriers tended to have a higher score on the Frontal Behavioral Inventory (see Table 2 ), this difference did not reach statistical significance, and there were no differences in the individual items of this instrument or in the Neuropsychiatric Inventory (data not shown).
Group Comparison Between H1 Carriers and Healthy Comparison Subjects
After correction for multiple comparisons, the analyses showed an extensive bilateral area in the frontal cortex, including the superior, middle, and inferior frontal gyri and the anterior cingulate gyrus, where glucose utilization was significantly lower in patients with the H1 haplotype compared with healthy comparison subjects (cluster of 9,442 contiguous voxels, maximum at Talairach coordinates –48, 23, 32 [z=6.42], left middle frontal gyrus; submaxima at –50, 40, –12 [z=6.38], left inferior frontal gyrus, and 44, 27, 41 [z=6.33], right middle frontal gyrus; see Figure 1 ). There was no statistically significant difference in metabolic activity in the temporal lobe or other cortical regions.

a (A) SPM2 “glass brain” representation of the brain regions with significantly reduced glucose metabolism in the patient group as compared with the healthy comparison group (p<0.05, corrected for multiple comparisons) and anatomical localization, as projected on (B) sagittal, (C) coronal, and (D) axial sections of a normal MRI, spatially normalized into the Montreal Neurological Institute template (crossbars at the localization of the global maximum at coordinates –48, 23, 32, left middle frontal gyrus).
Group Comparison Between H2 Carriers and Healthy Comparison Subjects
An even more extensive bilateral frontal hypometabolic area, including the rectal gyrus, the superior, middle, and inferior frontal gyri, the anterior cingulate gyrus, and the superior temporal gyrus, was found in patients with the H2 haplotype as compared with healthy comparison subjects (cluster of 14,133 contiguous voxels, maximum at Talairach coordinates –6, 22, –21 [z=6.78], right rectal gyrus; submaxima at 4, 36, –25 [z=6.60], right rectal gyrus, and 10, 26, –26 [z=6.48], right rectal gyrus; Figure 2 ).

a (A) SPM2 “glass brain” representation of the brain regions with significantly reduced glucose metabolism in the patient group as compared with the healthy comparison group (p<0.05, corrected for multiple comparisons) and anatomical localization, as projected on (B) sagittal, (C) coronal, and (D) axial sections of a normal MRI, spatially normalized into the Montreal Neurological Institute template (crossbars at the localization of the global maximum at coordinates 4, 36, –25, right rectal gyrus).
Group Comparison Between H1 and H2 Carriers
In the group comparison between the homozygous carriers of the H1 haplotype and the heterozygous carriers of the H2 haplotype, two extensive clusters with reduced glucose utilization in the left frontal cortex were detected in the analysis of when H2 metabolism was less than H1 metabolism after controlling for age at onset, duration, gender, and cognitive test scores ( Figure 3 ). These areas included the superior and medial frontal gyri in both hemispheres (cluster of 2,918 contiguous voxels, maximum at Talairach coordinates 6, 29, 43 [z=3.88], right medial frontal gyrus; submaxima at 4, 16, 56 [z=3.55], right superior frontal gyrus, and –14, 40, 26 [z=3.13], left medial frontal gyrus) and in the left inferior frontal gyrus (cluster of 874 contiguous voxels, maximum at Talairach coordinates –44, 23, –8 [z=3.49]). No differences in metabolism patterns were observed for the reverse comparison, that is, when H1 metabolism was less than H2 metabolism.

a (A) SPM2 “glass brain” representation of the brain regions with significantly reduced glucose metabolism in the H2 group as compared with the H1 group (p<0.05, corrected for multiple comparisons) and anatomical localization, as projected on (B) sagittal, (C) coronal, and (D) axial sections of a normal MRI, spatially normalized into the Montreal Neurological Institute template (crossbars at the localization of the global maximum at coordinates –14, 40, 26, left medial frontal gyrus).
Discussion
We found that the MAPT H1 and H2 haplotypes were not associated with a significant difference in the risk of developing FTD. However, the H2 haplotype was associated with a lower age, by 1.5 years, at onset of symptoms. While this difference was found to be statistically significant, it is not as pronounced as the approximate 5-year difference reported previously (21) . The lack of a significant difference in the frequencies between comparison subjects and patients with FTD cannot be attributed to a departure from expected H2 allele frequency in a Caucasian population, as the reported H2 allele frequency in the comparison group (0.204) was comparable to the reported frequency of the H2 haplotype in a meta-analysis of 12 studies (0.21) (38) . In functional investigations using FDG PET, we observed that H2 carriers presented with a significant reduction of glucose utilization in the left inferior frontal gyrus and the superior and medial frontal gyri in both hemispheres, thus supporting the functional relevance of our findings. It should also be noted that the significant decrease in glucose utilization seen in H2 carriers was observed after controlling for demographic variables, including age at onset, duration of illness, and severity of dementia as measured by the CERAD Neuropsychological Battery. This suggests that the more extensive hypometabolism pattern seen in H2 carriers is not accounted for by longer duration of illness and that the H2 haplotype confers, in some way, a heightened severity of frontotemporal degeneration. However, this did not correspond to significant differences in clinical measures, such as behavioral symptoms, even though H2 individuals tended to have a higher total score on the Frontal Behavioral Inventory, even after correcting for severity of dementia. Therefore, the observed differences in glucose utilization were not a reflection of differences in the spectrum or severity of symptoms as measured in this study. The pathogenic mechanisms underlying these rather complex findings of, in some way, a more aggressive course of the disease without mediating risk for the disease itself are not entirely clear but may be interpreted best by a scenario of H2 being a modulator of the disease once the neurodegenerative process has started. A potential explanation for these differences may be through haplotypic differences (H1>H2) in transcriptional activity, which have previously been reported (8) . Whether this translates into differences at the protein level needs to be examined, but a scenario of too much or not enough tau protein may be perpetuated by the different MAPT haplotypes. This may result in differing degrees of susceptibility to an already initiated neurodegenerative process, which in turn influences the course of the already initiated frontotemporal degeneration. A final observation is that the hypometabolism (H2 versus H1) shows a slight hemispheric asymmetry (lateralized to the left). Since FDG PET was undertaken in a resting state, any impact of handedness would have a negligible impact on these results. This left>right asymmetric pattern has been reported previously (39) , where it was suggested to be another metabolic feature that differentiated FTD from Alzheimer’s disease or other causes of dementia.
A potential limitation of this study is the use of a total score of the CERAD Neuropsychological Battery subtests to control for cognitive performance in patients with FTD; this battery was originally designed for patients with Alzheimer’s disease and thus may not cover every aspect of cognitive decline in FTD. However, the CERAD Neuropsychological Battery covers a wide spectrum of cognitive impairment, and the effects of misclassification of illness severity would be equally distributed across the study group, if at all present. A composite score of several neuropsychological tests specifically designed to assess cognitive impairment in patients with FTD might have suited the needs of the study even better and possibly would enable the translation of functional imaging data into clinical or neuropsychological consequences. However, because of FTD-related problems with patient compliance during assessments, extensive neuropsychological test data aiming at frontal functions were not available for a sufficient number of patients. Furthermore, this situation limited the investigation of the impact of MAPT haplotype on behavioral symptoms and, in turn, of any possible correlation of PET patterns with severity of behavioral symptoms.
Another point that needs to be taken into account is that because no atrophy correction was included in the statistical analyses of the PET images, effects of brain atrophy cannot be ruled out entirely. Cortical atrophy in older individuals might lead to an underestimation of regional cerebral glucose metabolism (40) , and local atrophy due to neurodegeneration may contribute to the reduction of the FDG PET signal (41) . In patients with Alzheimer’s disease, it has been demonstrated that deficits in regional cerebral glucose metabolism were not merely a consequence of atrophy and that they persisted even after correction for atrophy (42) . Nevertheless, atrophy to some extent certainly contributes to signal loss because of partial volume effects in more advanced stages. Thus, the lack of atrophy correction does not detract from these findings; in fact, structural defects within the described areas would be also assigned to the H2 haplotype and, as a consequence, would rather emphasize the malicious nature of the H2 haplotype.
The final point that needs to be addressed pertains to age at onset and duration of illness. Both of these constructs must be acknowledged as estimates, and some error may occur in these measures. However, in relation to the findings of this study, if any error is present, it is likely to be systematic and thus present in both H1 and H2 carriers. Furthermore, any impact of genotype on estimates of age at onset played no role in these findings, as age at onset was determined from a separate informant interview prior to genotyping (so the interviewer was blind to genotype) and was thus an objective estimate.
In conclusion, in this study we found that neither the H1 nor the H2 haplotype of the MAPT gene confers risk for FTD, although H2 carriers presented with clinical symptoms at a significantly earlier age. Additionally, H2 carriers had a more severe reduction of glucose utilization, which remained even after controlling for age at onset and duration. These findings suggest that the MAPT haplotypes may confer differential effects at least on the progression of the disease. Further studies aiming at the characterization of functional differences between both MAPT haplotypes are needed to elucidate the underlying pathomechanism of our findings.
1. Kertesz A: Pick complex: an integrative approach to frontotemporal dementia: primary progressive aphasia, corticobasal degeneration, and progressive supranuclear palsy. Neurologist 2003; 9:311–317Google Scholar
2. Kertesz A, McMonagle P, Blair M, Davidson W, Munoz DG: The evolution and pathology of frontotemporal dementia. Brain 2005; 128:1996–2005Google Scholar
3. Hutton M, Lendon CL, Rizzu P, Baker M, Froelich S, Houlden H, Pickering-Brown S, Chakraverty S, Isaacs A, Grover A, Hackett J, Adamson J, Lincoln S, Dickson D, Davies P, Petersen RC, Stevens M, de Graaff E, Wauters E, van Baren J, Hillebrand M, Joosse M, Kwon JM, Nowotny P, Che LK, Norton J, Morris JC, Reed LA, Trojanowski J, Basun H, Lannfelt L, Neystat M, Fahn S, Dark F, Tannenberg T, Dodd PR, Hayward N, Kwok JB, Schofield PR, Andreadis A, Snowden J, Craufurd D, Neary D, Owen F, Oostra BA, Hardy J, Goate A, van Swieten J, Mann D, Lynch T, Heutink P: Association of missense and 5’-splice-site mutations in tau with the inherited dementia FTDP-17. Nature 1998; 393:702–705Google Scholar
4. Spillantini MG, Bird TD, Ghetti B: Frontotemporal dementia and parkinsonism linked to chromosome 17: a new group of tauopathies. Brain Pathol 1998; 8:387–402Google Scholar
5. Baker M, Litvan I, Houlden H, Adamson J, Dickson D, Perez-Tur J, Hardy J, Lynch T, Bigio E, Hutton M: Association of an extended haplotype in the tau gene with progressive supranuclear palsy. Hum Mol Genet 1999; 8:711–715Google Scholar
6. Pastor P, Ezquerra M, Tolosa E, Munoz E, Marti MJ, Valldeoriola F, Molinuevo JL, Calopa M, Oliva R: Further extension of the H1 haplotype associated with progressive supranuclear palsy. Mov Disord 2002; 17:550–556Google Scholar
7. Evans W, Fung HC, Steele J, Eerola J, Tienari P, Pittman A, Silva R, Myers A, Vrieze FW, Singleton A, Hardy J: The tau H2 haplotype is almost exclusively Caucasian in origin. Neurosci Lett 2004; 369:183–185Google Scholar
8. Kwok JB, Teber ET, Loy C, Hallupp M, Nicholson G, Mellick GD, Buchanan DD, Silburn PA, Schofield PR: Tau haplotypes regulate transcription and are associated with Parkinson’s disease. Ann Neurol 2004; 55:329–334Google Scholar
9. Houlden H, Baker M, Morris HR, MacDonald N, Pickering-Brown S, Adamson J, Lees AJ, Rossor MN, Quinn NP, Kertesz A, Khan MN, Hardy J, Lantos PL, St George-Hyslop P, Munoz DG, Mann D, Lang AE, Bergeron C, Bigio EH, Litvan I, Bhatia KP, Dickson D, Wood NW, Hutton M: Corticobasal degeneration and progressive supranuclear palsy share a common tau haplotype. Neurology 2001; 56:1702–1706Google Scholar
10. Pittman AM, Myers AJ, Duckworth J, Bryden L, Hanson M, Abou-Sleiman P, Wood NW, Hardy J, Lees A, de Silva R: The structure of the tau haplotype in controls and in progressive supranuclear palsy. Hum Mol Genet 2004; 13:1267–1274Google Scholar
11. Liu WK, Le TV, Adamson J, Baker M, Cookson N, Hardy J, Hutton M, Yen SH, Dickson DW: Relationship of the extended tau haplotype to tau biochemistry and neuropathology in progressive supranuclear palsy. Ann Neurol 2001; 50:494–502Google Scholar
12. Conrad C, Andreadis A, Trojanowski JQ, Dickson DW, Kang D, Chen X, Wiederholt W, Hansen L, Masliah E, Thal LJ, Katzman R, Xia Y, Saitoh T: Genetic evidence for the involvement of tau in progressive supranuclear palsy. Ann Neurol 1997; 41:277–281Google Scholar
13. Skipper L, Wilkes K, Toft M, Baker M, Lincoln S, Hulihan M, Ross OA, Hutton M, Aasly J, Farrer M: Linkage disequilibrium and association of MAPT H1 in Parkinson disease. Am J Hum Genet 2004; 75:669–677Google Scholar
14. Farrer M, Skipper L, Berg M, Bisceglio G, Hanson M, Hardy J, Adam A, Gwinn-Hardy K, Aasly J: The tau H1 haplotype is associated with Parkinson’s disease in the Norwegian population. Neurosci Lett 2002; 322:83–86Google Scholar
15. Zhang J, Song Y, Chen H, Fan D: The tau gene haplotype H1 confers a susceptibility to Parkinson’s disease. Eur Neurol 2005; 53:15–21Google Scholar
16. Bernardi L, Maletta RG, Tomaino C, Smirne N, Di Natale M, Perri M, Longo T, Colao R, Curcio SA, Puccio G, Mirabelli M, Kawarai T, Rogaeva E, St George-Hyslop PH, Passarino G, De Benedictis G, Bruni AC: The effects of APOE and tau gene variability on risk of frontotemporal dementia. Neurobiol Aging 2006; 5:702–709Google Scholar
17. Sobrido MJ, Miller BL, Havlioglu N, Zhukareva V, Jiang Z, Nasreddine ZS, Lee VM, Chow TW, Wilhelmsen KC, Cummings JL, Wu JY, Geschwind DH: Novel tau polymorphisms, tau haplotypes, and splicing in familial and sporadic frontotemporal dementia. Arch Neurol 2003; 60:698–702Google Scholar
18. Zekanowski C, Peplonska B, Styczynska M, Gustaw K, Kuznicki J, Barcikowska M: Mutation screening of the MAPT and STH genes in Polish patients with clinically diagnosed frontotemporal dementia. Dement Geriatr Cogn Disord 2003; 16:126–131Google Scholar
19. Verpillat P, Camuzat A, Hannequin D, Thomas-Anterion C, Puel M, Belliard S, Dubois B, Didic M, Michel BF, Lacomblez L, Moreaud O, Sellal F, Golfier V, Campion D, Clerget-Darpoux F, Brice A: Association between the extended tau haplotype and frontotemporal dementia. Arch Neurol 2002; 59:935–939Google Scholar
20. Hughes A, Mann D, Pickering-Brown S: Tau haplotype frequency in frontotemporal lobar degeneration and amyotrophic lateral sclerosis. Exp Neurol 2003; 181:12–16Google Scholar
21. Borroni B, Yancopoulou D, Tsutsui M, Padovani A, Sawcer SJ, Hodges JR, Spillantini MG: Association between tau H2 haplotype and age at onset in frontotemporal dementia. Arch Neurol 2005; 62:1419–1422Google Scholar
22. Ghidoni R, Signorini S, Barbiero L, Sina E, Cominelli P, Villa A, Benussi L, Binetti G: The H2 MAPT haplotype is associated with familial frontotemporal dementia. Neurobiol Dis 2006; 22:357–362Google Scholar
23. Neary D, Snowden JS, Gustafson L, Passant U, Stuss D, Black S, Freedman M, Kertesz A, Robert PH, Albert M, Boone K, Miller BL, Cummings J, Benson DF: Frontotemporal lobar degeneration: a consensus on clinical diagnostic criteria. Neurology 1998; 51:1546–1554Google Scholar
24. Folstein MF, Folstein SE, McHugh PR: “Mini-Mental State”: a practical method for grading the cognitive state of patients for the clinician. J Psychiatr Res 1975; 12:189–198Google Scholar
25. Morris JC, Mohs RC, Rogers H, Fillenbaum G, Heyman A: Consortium to Establish a Registry for Alzheimer’s Disease (CERAD) clinical and neuropsychological assessment of Alzheimer’s disease. Psychopharmacol Bull 1988; 24:641–652Google Scholar
26. Chandler MJ, Lacritz LH, Hynan LS, Barnard HD, Allen G, Deschner M, Weiner MF, Cullum CM: A total score for the CERAD neuropsychological battery. Neurol 2005; 65:102–106Google Scholar
27. Kertesz A, Nadkarni N, Davidson W, Thomas AW: The Frontal Behavioral Inventory in the differential diagnosis of frontotemporal dementia. J Int Neuropsychol Soc 2000; 6:460–468Google Scholar
28. Cummings JL, Mega M, Gray K, Rosenberg-Thompson S, Carusi DA, Gornbein J: The Neuropsychiatric Inventory: comprehensive assessment of psychopathology in dementia. Neurology 1994; 44:2308–2314Google Scholar
29. Drzezga A, Lautenschlager N, Siebner H, Riemenschneider M, Willoch F, Minoshima S, Schwaiger M, Kurz A: Cerebral metabolic changes accompanying conversion of mild cognitive impairment into Alzheimer’s disease: a PET follow-up study. Eur J Nucl Med Mol Imaging 2003; 30:1104–1113Google Scholar
30. Zivelin A, Rosenberg N, Peretz H, Amit Y, Kornbrot N, Seligsohn U: Improved method for genotyping apolipoprotein E polymorphisms by a PCR-based assay simultaneously utilizing two distinct restriction enzymes. Clin Chem 1997; 43:1657–1659Google Scholar
31. Myers AJ, Kaleem M, Marlowe L, Pittman AM, Lees AJ, Fung HC, Duckworth J, Leung D, Gibson A, Morris CM, de Silva R, Hardy J: The H1c haplotype at the MAPT locus is associated with Alzheimer’s disease. Hum Mol Genet 2005; 14:2399–2404Google Scholar
32. Friston K, Holmes A, Worsley K, Poline J, Frith C: Statistical parametric mapping in functional imaging: a general linear approach. Hum Brain Mapp 1995; 2:189–210Google Scholar
33. Drzezga A, Darsow U, Treede RD, Siebner H, Frisch M, Munz F, Weilke F, Ring J, Schwaiger M, Bartenstein P: Central activation by histamine-induced itch: analogies to pain processing: a correlational analysis of O-15 H 2 O positron emission tomography studies. Pain 2001; 92:295–305 Google Scholar
34. Evans AC, Collins DL, Mills SR, Brown ED, Kelly RL, Peters TM: 3D statistical neuroanatomical models from 305 MRI volumes. Proceedings of the IEEE-Nuclear Science Symposium and Medical Imaging Conference, 1993, pp 1813–1817Google Scholar
35. Talairach J, Tournoux P: Co-Planar Stereotaxic Atlas of the Human Brain: Three-Dimensional Proportional System: An Approach to Cerebral Imaging. New York, Thieme Medical, 1988Google Scholar
36. Duncan J, Seitz RJ, Kolodny J, Bor D, Herzog H, Ahmed A, Newell FN, Emslie H: A neural basis for general intelligence. Science 2000; 289:457–460Google Scholar
37. Lancaster JL, Summerlin JL, Rainey L, Freitas CS, Fox PT: The Talairach Daemon: a database server for Talairach atlas labels. Neuroimage 1997; 5(4):S633Google Scholar
38. Bertram L, McQueen M, Mullin K, Blacker D, Tanzi R: The AlzGene Database, Alzheimer Research Forum. http://www.alzgene.orgGoogle Scholar
39. Jeong Y, Cho SS, Park JM, Kang SJ, Lee JS, Kang E, Na DL, Kim SE: 18F-FDG PET findings in frontotemporal dementia: an SPM analysis of 29 patients. J Nucl Med 2005; 46:233–239Google Scholar
40. Meltzer CC, Kinahan PE, Greer PJ, Nichols TE, Comtat C, Cantwell MN, Lin MP, Price JC: Comparative evaluation of MR-based partial-volume correction schemes for PET. J Nucl Med 1999; 40:2053–2065Google Scholar
41. Baron JC, Chetelat G, Desgranges B, Perchey G, Landeau B, de la Sayette V, Eustache F: In vivo mapping of gray matter loss with voxel-based morphometry in mild Alzheimer’s disease. Neuroimage 2001; 14:298–309Google Scholar
42. Alavi A, Newberg AB, Souder E, Berlin JA: Quantitative analysis of PET and MRI data in normal aging and Alzheimer’s disease: atrophy weighted total brain metabolism and absolute whole brain metabolism as reliable discriminators. J Nucl Med 1993; 34:1681–1687Google Scholar