Abnormal fMRI Brain Activation in Euthymic Bipolar Disorder Patients During a Counting Stroop Interference Task
Abstract
Background: Bipolar disorder is characterized by disturbed mood homeostasis accompanied by cognitive impairments that appear to persist during euthymia. Cognitive probes, coupled with neuroimaging, provide an approach toward clarifying the neurophysiology of bipolar disorder. METHOD: Sixteen patients with euthymic bipolar disorder and 16 healthy subjects underwent functional magnetic resonance imaging (fMRI) while performing a counting Stroop interference task and a control condition. Task performance was correlated with regional brain activation differences between groups, and the effect on brain activation of receiving versus not receiving medications was evaluated. RESULTS: Bipolar patients exhibited impaired task performance relative to the healthy subjects. In addition, the two groups demonstrated significantly different patterns of brain activation during the interference task. Healthy subjects exhibited relatively increased activation in temporal cortical regions, middle frontal gyrus, putamen, and midline cerebellum. Bipolar subjects exhibited relatively greater activation in the medial occipital cortex. The groups demonstrated different associations between task performance and fMRI activation in these brain regions. No differences in activation in these regions were observed between patients who were versus those who were not receiving medications; however, patients receiving medications exhibited greater activation in the anterior cingulate and dorsolateral prefrontal cortex. CONCLUSIONS: These differences suggest that patients with euthymic bipolar disorder fail to activate brain regions associated with performance of an interference task, which may contribute to impaired task performance. Medications do not explain these differences but may influence activation of brain regions primarily associated with performing an interference task.
Although bipolar disorder is characterized by a loss of emotional homeostasis, particularly the development of mania, cognitive symptoms represent a significant part of this illness. Bearden et al. (1) highlighted that bipolar patients exhibit attentional, memory, and executive impairments that are worse during acute affective episodes but persist during euthymia. The association of cognitive abnormalities with mood episodes is not surprising, given the reciprocal connection between brain networks that modulate mood and cognitive functions (2). However, the persistence of cognitive deficits in the absence of mood symptoms, i.e., during euthymia, suggests that these symptoms may reflect the underlying dysfunctional neurophysiology of bipolar disorder more directly, independent of mood state.
During euthymia, bipolar patients exhibit minimal symptoms by definition, although a persistent vulnerability for mood dysregulation is always present. This persistent vulnerability has been hypothesized to result from overreactive emotional (i.e., anterior limbic) brain networks (3–5), which may be reflected in cognitive disturbances (i.e., through reciprocal interactions between cognitive and mood networks) even during euthymia. Consistent with this hypothesis, we recently reported evidence of anterior limbic overactivation during a simple attentional task in euthymic, unmedicated bipolar patients (4). Although patients with euthymic bipolar disorder in this study performed the task similarly to healthy subjects, they exhibited activation in different cortical regions, perhaps to compensate for interference from emotional brain networks in order to maintain task performance. A next step in this research direction is to incorporate a more challenging attentional task in which compensatory mechanisms might be overwhelmed in patients but not healthy subjects, thereby further differentiating brain activation patterns between these groups.
One approach toward developing a more difficult attentional task is to incorporate cognitive interference. Cognitive interference refers to the introduction of a secondary stimulus that interferes with the processing of the primary stimulus. In the classic Stroop interference task, subjects are presented names of colors (e.g., “red,” “blue”) written in colored ink and are asked to identify the color of the ink. In the original description, Stroop found that subjects were slower at identifying the color of the ink when it was discordant with the word (e.g., the word “red” written in blue ink) than when simply identifying colored squares (6). This and similar tasks are widely used in cognitive research, and bipolar patients often exhibit decreased Stroop task performance compared with healthy subjects (1). The classic color Stroop task is difficult to study using functional magnetic resonance imaging (fMRI) since it requires verbal responses, which introduce movement that interferes with image acquisition. To address this problem, Bush et al. (7) developed a counting Stroop interference task that can be integrated within the fMRI environment. The validity of this interference task was supported by 1) delayed responses in the interference versus control condition in healthy subjects and 2) the expected activation in anterior cingulate and dorsolateral prefrontal cortex consistent with radioimaging studies of other Stroop interference tasks.
With these considerations in mind, we used a counting Stroop interference task as a cognitive probe to compare brain activation between patients with euthymic bipolar disorder and healthy subjects. Euthymic subjects were studied to minimize the effects of active mood symptoms on the results (4). From previous work (1, 4, 8, 9), we predicted that bipolar patients would exhibit poorer performance than healthy subjects on the interference task that would be associated with between-group differential activation in prefrontal (ventrolateral, dorsolateral, and anterior cingulate) brain regions.
Method
Subjects
Sixteen patients with DSM-IV type I bipolar disorder were recruited from the University of Cincinnati First-Episode Mania Study and then followed every 4 months for up to 8 years (10). From ratings obtained for this study, euthymic patients were identified, defined by at least 4 weeks of Young Mania Rating Scale (11) total scores ≤5 and Hamilton Depression Rating Scale (12) total scores ≤7. Subjects were followed to ensure that they remained euthymic for at least 1 month after the MRI exam as well. Sixteen healthy comparison subjects were recruited from the patients’ communities and were group matched to the patients by age, sex, and ethnicity. Healthy subjects had no history of major psychiatric disorders in themselves or first-degree family members. All bipolar and healthy subjects met the following inclusion criteria: 1) age 18–45 years; 2) no history of alcohol or drug dependence; 3) no alcohol or drug abuse for at least 3 months before the scan; 4) no history of mental retardation nor documented IQ <70; 5) right-handed; 6) no history of major medical or neurological disorders that were felt by the investigators to influence fMRI results; 7) no contraindication for an MRI study; and 8) ability to communicate in English. Female subjects were also given pregnancy tests; a negative result was required for study inclusion. All subjects provided written informed consent for this study after the risks and procedures were explained in full. The University of Cincinnati and Children’s Hospital Medical Center Institutional Review Boards approved this study.
Clinical Assessments
A diagnosis of bipolar disorder (patients) or the absence of a psychiatric condition (healthy subjects) was established using the Structured Clinical Interview for DSM-IV Axis I Disorders, Patient Edition (SCID-P) (13) administered by experienced research clinicians (interrater kappa >0.90) (10). In addition to symptom assessments for the outcome study, all subjects were administered the Young Mania Rating Scale and Hamilton Depression Rating Scale at the time of the MRI examination. The patients had an average age at illness onset of 23 years (SD=8) and average illness duration of 4.8 years (SD=4.4).
Substance use disorders were identified using the SCID-P and the Addiction Severity Index (14). In addition, urine toxicology screen results (which had to be negative for participation) were obtained at the time of the MRI exam. A medical review of systems performed by a licensed physician identified potentially exclusionary medical problems. All subjects were medically healthy. Demographic information was obtained by direct interview. Finally, right-handedness was verified using the Crovitz Handedness Scale (15). Eight patients (50%) were receiving medications at the time of the fMRI examination: one was receiving olanzapine monotherapy, and the remaining seven were being treated with various combinations of divalproex (N=4), olanzapine (N=4), venlafaxine (N=2), topiramate (N=2), bupropion (N=2), risperidone (N=1), quetiapine (N=1), paroxetine (N=1), trazodone (N=1), and clonazepam (N=1).
Cognitive Tasks
A counting Stroop interference task was the experimental cognitive task of interest and was modeled after that described by Bush et al. (7), who found that this task activated regions of the anterior cingulate (Brodmann’s area 24/32) and dorsolateral prefrontal areas (Brodmann’s area 9/46) similar to the classic color Stroop task while permitting a button response that could be used in an fMRI environment (in which a speaking response is precluded). In this task, subjects were presented with lists of one to four words using nonferromagnetic goggles (Resonance Technologies, Inc.) that provided a visual presentation that mimics a computer monitor and obscures the peripheral field of view. The words listed were the names of the numbers “one,” “two,” “three,” and “four.” Subjects were instructed to press a button on a response box corresponding to the number of words listed. In the control condition, the number of words on the screen corresponded to the word presented, e.g., the word “two” was listed twice. In the interference condition, the number of words listed was discordant with the word presented (e.g., the word “two” was listed only once or the word “four” was listed twice). The responses were electronically recorded to calculate response parameters (false hits [i.e., incorrect responses], percentage of correct responses, and reaction time). The control task was designed to control for word presentation and general MRI environmental stimuli, as well as the noninterference attentional components necessary to complete both tasks.
Image Acquisition
Images were obtained using a 3.0-T Bruker Biospec MRI scanner (Bruker Medizintechnik, Karlsruhe, Germany), specifications and procedures for which have been previously described (4, 8). Following an alignment scan and a shim procedure, a high-resolution, T1-weighted, three-dimensional brain scan was obtained using a modified driven equilibrium Fourier transform sequence (TI=550 msec, TR=16.5 msec, TE=4.3 msec, field of view=25.6×19.2×14.4 cm, matrix 256×128×96 pixels, flip angle=20°). This scan was used for neuroanatomic localization of activation maps. fMRI scans were acquired using a T2*-weighted gradient-echo echo planar imaging pulse sequence (TR/TE=3000/38 msec, field of view=25.6×25.6 cm, matrix=64×64 pixels, slice thickness=5 mm, flip angle=90°). Twenty-four contiguous 5-mm axial slices extending from the inferior cerebellum to encompass the cerebrum were selected from a sagittal localizer scan (4, 8).
During fMRI sessions, subjects performed the interference and control tasks in an alternating boxcar design. A boxcar rather than an event-related design was chosen to maximize signal-to-noise. The interference and control tasks were given in alternating blocks of 30 seconds with lists being presented at 1500-msec intervals for a total of 20 word lists/block. Data from the first (control task) interval were discarded during postprocessing to avoid nonequilibrium intensity modulation effects. Following that first interval, five alternating blocks of each task were obtained. High-frequency noise was filtered in preprocessing, and binary masking was applied to remove pixels outside the brain (4, 8). Linear and quadratic drift components in the temporal baseline of each pixel were removed using a quadratic drift correction algorithm. Foam padding minimized subjects’ head movements. Images were corrected for motion by using a pyramid coregistration technique without landmarks (4, 10). All images had less than 2 mm of movement.
Analysis
Comparisons of demographic variables were made using t tests for continuous variables and chi-square or Fisher’s exact tests for dichotomous variables. Comparisons in response parameters were made using analysis of covariance (Proc GLM in SAS [SAS Institute, Cary, N.C.]) adjusted for education differences between groups.
Image data were processed by using the Children’s Hospital Imaging Processing Software (4, 8). Composite images were analyzed to determine activation differences between groups. Smoothing was applied (6 mm full width at half maximum) and t statistics calculated, contrasting voxels across the interference and control tasks. The t maps were transformed to Talairach space. Then a t statistic was determined for each voxel across subjects to create group-specific (i.e., within-group) composite activation maps. Voxel-by-voxel comparisons were then made between subject groups. In order to protect against type I error in these analyses, a minimum cluster size of 15 with a significance threshold of p<0.05 was used to identify activation, consistent with our previous work (4, 8) and as recommended by Xiong et al. (16). Functional maps were coregistered to averaged T1-weighted, modified, driven equilibrium, Fourier- transformed structural images for interpretation.
In order to better interpret activation differences, we examined correlations among those brain regions of activation that significantly differed between groups and task performance measures. Specifically, functional regions of interest were defined as those areas that showed significant group differences in activation in the primary analysis. Then, correlations between interference task performance measures and activation at each voxel within these specific functional regions of interest only were calculated. By restricting the correlation analysis to those regions showing differences between groups, we could increase statistical power. We defined significant correlations as r>0.62 corresponding to a significance threshold of p<0.01. For simplicity, the maximal r value (for those voxels with r>0.62) for each region is reported. We have used these methods previously (4). Finally, to examine potential medication effects, brain activation maps were compared between patients who were versus those who were not receiving medications (N=8 per group), using the same statistical contrasts as in the comparisons of the bipolar and healthy subjects. The intent of this analysis is to provide information to help interpret the primary analyses; as an analysis of direct medication effects it should be viewed as exploratory only.
Results
Demographics and Task Performance
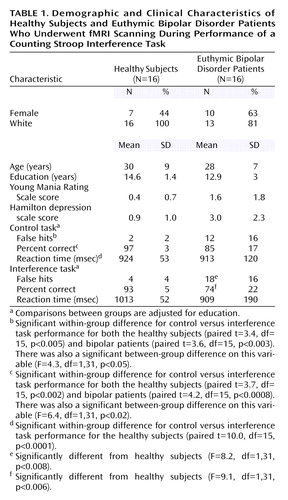
The patient and healthy subject groups were closely matched on demographic variables (Table 1). The patients exhibited less educational achievement (t=2.0, df=15, p<0.06), which was therefore used as a covariate in analyses. Although significant between-group differences were seen for Young Mania Rating Scale scores (t=2.5, df=30, p<0.03) and Hamilton depression scale ratings (t=3.4, df=30, p<0.004), the means and variability of these symptom ratings were so low that the differences are clinically meaningless. The groups also demonstrated differences in performance measures for both the interference and control tasks. In general, the patients demonstrated more false hits (i.e., incorrect responses) (control task: F=4.3, df=1, 31, p<0.05; interference task: F=8.2, df=1, 31, p<0.008) and a lower percentage of correct responses (control task: F=6.4, df=1, 31, p<0.02; interference task: F=9.1, df=1, 31, p<0.006) than healthy subjects. To determine whether performance differences in the interference task simply reflected differences in the control task, we compared the groups on false hits and percent of correct responses while covarying for control task performance. Even after we controlled for differences in control task performance, patients exhibited significantly more false hits (F=5.4, df=1, 31, p<0.03) and tended to have fewer correct responses (F=3.2, df=1, 31, p=0.08) than healthy subjects, suggesting a specific interference effect. Additionally, both healthy and bipolar subjects exhibited significantly more false hits and a significantly lower percentage of correct responses in the interference condition than the control task. In contrast, whereas the healthy subjects were significantly slower performing the interference than control task, the reaction time between these two tasks in the bipolar patients did not differ (Table 1). However, both groups (as well as all individual subjects) exhibited percentage correct response rates well in excess of random chance (i.e., 25% correct responses), suggesting that they were actively engaged in the task. Finally, we examined associations between illness duration on task performance variables and none showed significant correlations (r<0.33, p>0.20 in all cases).
Individual Group Activation During the Tasks
Both healthy and bipolar subjects showed expected activation in regions commonly associated with interference task performance, namely the anterior cingulate (Brodmann’s area 24/32) and dorsolateral prefrontal cortex (Brodmann’s area 9/46) as well as visual association areas (9) as illustrated in Figure 1 (activated areas corresponded to p<0.05 with cluster size of 20 voxels).
fMRI Group Comparisons in Activation
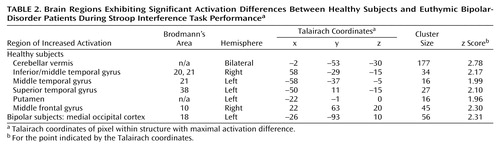
Figure 2 illustrates areas of significant regional brain activation differences, adjusted for differences in education, in bipolar versus healthy subjects while performing the interference relative to the control task, as listed in Table 2. Healthy subjects showed relative greater activation in the cerebellar vermis, right inferior/middle temporal gyrus (Brodmann’s area 20, 21), left middle temporal gyrus (Brodmann’s area 21), left superior temporal gyrus (Brodmann’s area 38), left putamen, and right middle frontal gyrus (Brodmann’s area 10). Bipolar patients demonstrated increased activation in the left medial occipital cortex (Brodmann’s area 18). Activation in brain areas commonly associated with Stroop tasks, i.e., the anterior cingulate and dorsolateral prefrontal cortex (Figure 1) did not significantly differ between groups (Figure 2).
Correlations in fMRI Activation and Task Performance
Significant correlations between regions of differential fMRI activation and interference task performance are listed in Table 3. In healthy subjects, activation of the right middle temporal gyrus (Brodmann’s area 21) was significantly negatively correlated with the percentage of correct responses but positively correlated with false hits. However, in the bipolar subjects, the reverse associations were observed. Additionally, healthy subjects exhibited significant associations between task performance measures and activation in the medial occipital cortex (Brodmann’s area 18) and putamen that were not observed in the bipolar patients.
Medication Effects
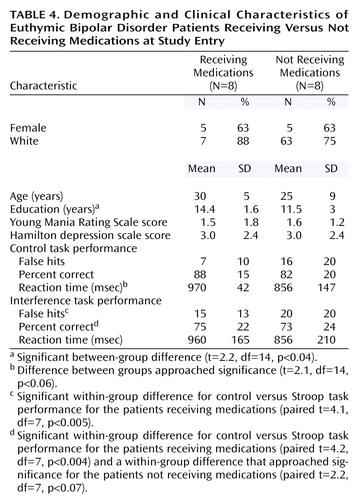
To identify potential medication effects, the eight patients with euthymic bipolar disorder not receiving medication at the time of the scan were compared to the eight patients receiving medications. The groups were generally well matched clinically and demographically (Table 4). The patients receiving medications exhibited significantly more false hits and a lower percentage of correct responses on the interference compared with the control task; these significant differences were not observed in the patients not receiving medications. Otherwise, task performance was similar. Brain activation in the medicated and medication-free subjects did not significantly differ in any of the brain regions that differed between healthy and bipolar subjects (Figure 3). However, patients receiving medication showed greater activation in the dorsolateral prefrontal cortex (middle frontal gyrus, Brodmann’s area 9) and anterior cingulate (Brodmann’s area 32) (Figure 3) than did unmedicated patients.
Discussion
As predicted, the bipolar patients exhibited significantly poorer performance than the healthy subjects on the counting Stroop interference task, which persisted even after we controlled for an unexpected poorer performance on the control task. The pattern of impairments in the bipolar subjects suggests an impulsive response bias that was associated with more incorrect responses (false hits) and a failure to slow down during the interference condition in order to improve performance (as healthy subjects did). Consequently, this tendency in the patients toward impulsive responding may be reflected in brain activation differences.
Both the healthy and bipolar subjects exhibited activation of the anterior cingulate (Brodmann’s area 24/32) and dorsolateral prefrontal brain regions (Brodmann’s area 9) while performing the Stroop task. As noted previously, these regions have been shown to consistently activate during interference tasks (7), and activation in these regions did not significantly differ between groups. Instead, the bipolar patients demonstrated a pattern of less activation in temporal regions, midline cerebellum, ventrolateral prefrontal cortex, and putamen, suggesting failure to activate secondary brain regions involved in this task. Since bipolar patients did not slow their responses in the more demanding interference condition, i.e., they did not exhibit the same speed-accuracy tradeoff as the healthy subjects, it suggests that activation of these brain areas may contribute to effective task performance, perhaps by modulating impulse control.
Activation of the midline cerebellum, striatum, and superior temporal gyrus has been associated with error detection and response inhibition (17–20). In the current study, putamen activation was inversely correlated with reaction time in healthy subjects (but not bipolar patients), supporting its role in these functions. Moreover, in healthy subjects, activation in the right middle temporal gyrus was inversely correlated with the percentage of correct responses, and directly correlated with incorrect responses, suggesting that this region, too, may have been involved in error detection and correction. In contrast, the bipolar patients demonstrated the opposite correlations in the temporal cortex, and no significant correlations in the occipital cortex or putamen, suggesting failure to appropriately activate these brain areas to compensate for interference. Additionally, activation in the ventrolateral prefrontal cortex (Brodmann’s area 10) has been associated with decision making and resolving conflict (21), and it appears to be recruited as cognitive tasks become more difficult (22). Similar to our finding in this study, previous investigators identified decreased activation in the right ventrolateral prefrontal cortex during a decision-making task in mania (23) and blunted activation in the homologous left hemisphere region across mood states in bipolar patients during a Stroop task (9). In addition, previous neuroimaging studies have identified structural, functional, and neurochemical abnormalities in many of these same brain regions, including the superior temporal gyrus (24, 25), midline cerebellum (26–28), and striatum (29, 30). Together, the activation differences and associations with task performance observed in this study suggest that the bipolar patients underactivated brain regions that are involved in error detection, response inhibition, and conflict resolution, thereby leading to poorer task performance and a more impulsive response pattern, as evidenced by the lack of a speed-accuracy tradeoff. The specific reasons why this network of error detection/response inhibition brain regions was underactivated in these patients is not clear. However, our previous work suggests that abnormalities within primary mood networks in bipolar disorder, even during dysthymia, may disrupt cognitivenetworks (4) because of reciprocal activation of these systems. The underactivation in this error detection/response inhibition network may reflect this disruption. Alternatively, bipolar patients may have primary dysfunction within this network. Additional imaging studies that integrate emotional, cognitive, and impulse control paradigms would be useful to examine these possibilities.
Since none of the brain regions differentially activated between bipolar and healthy subjects were also differentially activated between patients who were versus those who were not receiving medication, it minimizes the likelihood that the group differences resulted from medication exposure in the bipolar subjects. Instead, medication use was associated with activation in the dorsolateral prefrontal cortex and anterior cingulate. One interpretation of this finding is that medications help to restore function in these brain regions primarily involved in interference tasks, leading to increased activation. Consistent with this suggestion, the patients receiving medications exhibited numerical, although not significant, improvement in task performance. Specifically, the effect of medication appeared to slow and decrease variability in reaction time in the control task so that response patterns were more similar to healthy subjects in the medicated than the unmedicated groups. However, the small number of subjects and multiple medications administered limit comparisons between medicated and unmedicated patients. This analysis should be considered exploratory and the results primarily speculative; the main utility of this analysis is to aid in interpreting this particular confound for the larger (i.e., healthy versus bipolar) comparison.
Several other limitations must be considered when interpreting this study. First, the overall number of subjects is relatively small, such that only large effects were identified. This limitation is particularly true for subgroup comparisons (i.e., patients receiving and not receiving medications), as noted. Nonetheless, this study informs a number of hypotheses for future work with larger subject numbers. Second, the patients receiving medications were being treated with a variety of drug combinations, so that specific medication effects could not be determined with the number of subjects available. The results suggest, however, that medications may alter brain activation in regions that are associated with cognitive tasks so that studies of specific drug effects on cognition (and the corresponding brain activation) in larger subject numbers are warranted. Third, the patients exhibited poorer performance on the control task, which makes interpretation of the study more difficult than if they had exhibited incrementally worse performance only on the interference task. Nonetheless, even after we controlled for the control task differences, differences in interference task performance persisted. Finally, we did not assess for the presence of a history of attention deficit hyperactivity disorder (ADHD) in this group of bipolar patients. ADHD comorbidity is relatively common in bipolar disorder and might contribute to impulsive responding. However, these patients were well known to us from their participation in the outcome study, and no one exhibited obvious symptoms of ADHD, but in the absence of a formal assessment this cannot be certain. Offsetting these limitations are several study strengths including 1) a well-defined, truly euthymic bipolar patient group; 2) measurement of task performance in the scanner to ensure that the task was being attended to and to permit examination of associations between brain activation and task performance; and 3) a specific approach toward examining medication effects.
In summary, during a counting Stroop interference task, patients with euthymic bipolar disorder exhibited significant activation differences from healthy subjects. These differences appeared to occur predominantly in brain regions that activate during error detection, response inhibition, and conflict resolution, suggesting that the bipolar subjects failed to appropriately activate brain areas to prevent impulsive responding.
 |
 |
 |
 |
Received Sept. 7, 2004; revision received Oct. 22, 2004; accepted Oct. 29, 2004. From the Center for Bipolar Disorders Research and the Center for Imaging Research, University of Cincinnati College of Medicine, and the Imaging Research Center, Children’s Hospital Research Foundation, Cincinnati. Address correspondence and reprint requests to Dr. Strakowski, Director, Center for Imaging Research, University of Cincinnati College of Medicine, Cincinnati, OH 45267-0583; [email protected] (e-mail). Supported by grants from the Stanley Medical Research Institute and the National Association for Research in Schizophrenia and Depression as well as an NIMH grant (MH-58170) to Dr. Strakowski.

Figure 1. Regional Activation During Performance of a Stroop Interference Task Relative to a Control Task in 16 Healthy Subjects and 16 Euthymic Bipolar Disorder Patientsa
aFunctional brain activation maps overlaid on T1-weighted anatomic images (Talairach z coordinate=35).

Figure 2. Differential Brain Activation, Adjusted for Education, Between Healthy Subjects and Euthymic Bipolar Disorder Patients During Performance of a Stroop Interference Task Relative to a Control Taska
aAreas in which healthy subjects exhibited greater activation are in blue tones, and areas in which the bipolar patients exhibited greater activation are in yellow/orange tones.

Figure 3. Differential Brain Activation Between Medicated and Medication-Free Euthymic Bipolar Disorder Patients During Performance of a Stroop Interference Taska
aStatistically significant activation was defined as p<0.05 using a combination of voxel cluster size (15) and activation threshold to control for multiple comparisons. Areas in which subjects receiving medication exhibited greater activation included the middle frontal gyrus (Brodmann’s area 9), anterior cingulate (Brodmann’s area 32), and postcentral gyrus (Brodmann’s area 1, 3). No brain regions were observed in which patients not receiving medications had increased activation relative to medicated patients.
1. Bearden CE, Hoffman KM, Cannon TD: The neuropsychology and neuroanatomy of bipolar affective disorder: a critical review. Bipolar Disord 2001; 3:106–150Crossref, Medline, Google Scholar
2. Mayberg HS, Liotti M, Brannan SK, McGinnis S, Mahurin RK, Jerabek PA, Silva JA, Tekell JL, Martin CC, Lancaster JL, Fox PT: Reciprocal limbic-cortical function and negative mood: converging PET findings in depression and normal sadness. Am J Psychiatry 1999; 156:675–682Abstract, Google Scholar
3. Strakowski SM: Differential brain mechanisms in bipolar and unipolar disorders: considerations from brain imaging, in Brain Imaging in Affective Disorders. Edited by Soares JC. New York, Marcel Dekker, 2002, pp 337–362Google Scholar
4. Strakowski SM, Adler CM, Holland SK, Mills NP, DelBello MP: A preliminary fMRI study of sustained attention in unmedicated, euthymic bipolar disorder. Neuropsychopharmacology 2004; 29:1734–1740Crossref, Medline, Google Scholar
5. Ketter TA, Kimbrell TA, George MS, Dunn RT, Speer AM, Benson BE, Willis MW, Danielson A, Frye MA, Herscovitch P, Post RM: Effects of mood and subtype on cerebral glucose metabolism in treatment-resistant bipolar disorder. Biol Psychiatry 2001; 49:97–109Crossref, Medline, Google Scholar
6. Stroop JR: Studies of interference in serial verbal reactions. J Exp Psychol 1935; 18:643–662Crossref, Google Scholar
7. Bush G, Whalen PJ, Rosen BR, Jenike MA, McInerney SC, Rauch SL: The Counting Stroop: an interference task specialized for functional neuroimaging: validation study with functional MRI. Hum Brain Mapp 1998; 6:270–282Crossref, Medline, Google Scholar
8. Adler CM, Holland SK, Schmithorst V, Tuchfarber MJ, Strakowski SM: Changes in neuronal activation in patients with bipolar disorder during performance of a working memory task. Bipolar Disord 2004; 6:540–549Crossref, Medline, Google Scholar
9. Blumberg HP, Leung HC, Skudlarski P, Lacadie CM, Fredericks CA, Harris BC, Charney DS, Gore JC, Krystal JH, Peterson BS: A functional magnetic resonance imaging study of bipolar disorder: state- and trait-related dysfunction in ventral prefrontal cortices. Arch Gen Psychiatry 2003; 60:601–609Crossref, Medline, Google Scholar
10. Strakowski SM, Williams JR, Fleck DE, DelBello MP: Eight-month functional outcome from mania following a first psychiatric hospitalization. J Psychiatr Res 2000; 34:193–200Crossref, Medline, Google Scholar
11. Young RC, Biggs JT, Ziegler VE, Meyer DA: A rating scale for mania: reliability, validity and sensitivity. Br J Psychiatry 1978; 133:429–435Crossref, Medline, Google Scholar
12. Hamilton M: A rating scale for depression. J Neurol Neurosurg Psychiatry 1960; 23:56–62Crossref, Medline, Google Scholar
13. First MB, Spitzer RL, Gibbon M, Williams JBW: Structured Clinical Interview for DSM-IV Axis I Disorders, Patient Edition (SCID-P), version 2. New York, New York State Psychiatric Institute, Biometrics Research, 1997Google Scholar
14. McLellan AT, Kushner H, Metzger D, Peters R, Smith I, Grissom G, Pettinati H, Argeriou M: The fifth edition of the Addiction Severity Index. J Subst Abuse Treat 1992; 9:199–213Crossref, Medline, Google Scholar
15. Crovitz HF, Zener K: A group-test for assessing hand- and eye-dominance. Am J Psychol 1962; 75:271–276Crossref, Medline, Google Scholar
16. Xiong J, Gao J-H, Lancaster JL, Fox PT: Clustered pixels analysis for functional MRI activation studies of the human brain. Hum Brain Mapp 1995; 3:287–301Crossref, Google Scholar
17. Horn NR, Dolan M, Elliott R, Deakin JF, Woodruff PW: Response inhibition and impulsivity: an fMRI study. Neuropsychologia 2003; 41:1959–1966Crossref, Medline, Google Scholar
18. Desmond JE, Gabrieli JD, Glover GH: Dissociation of frontal and cerebellar activity in a cognitive task: evidence for a distinction between selection and search. Neuroimage 1998; 7:368–376Crossref, Medline, Google Scholar
19. Jueptner M, Weiller C: A review of differences between basal ganglia and cerebellar control of movements as revealed by functional imaging studies. Brain 1998; 121:1437–1449Crossref, Medline, Google Scholar
20. Schultz W, Tremblay L, Hollerman JR: Changes in behavior-related neuronal activity in the striatum during learning. Trends Neurosci 2003; 26:321–328Crossref, Medline, Google Scholar
21. Rogers RD, Owen AM, Middleton HC, Williams EJ, Pickard JD, Sahakian BJ, Robbins TW: Choosing between small, likely rewards and large, unlikely rewards activates inferior and orbital prefrontal cortex. J Neurosci 1999; 19:9029–9038Crossref, Medline, Google Scholar
22. Pochon JB, Levy R, Fossati P, Lehericy S, Poline JB, Pillon B, Le Bihan D, Dubois B: The neural system that bridges reward and cognition in humans: an fMRI study. Proc Natl Acad Sci USA 2002; 99:5669–5674Crossref, Medline, Google Scholar
23. Rubinsztein JS, Fletcher PC, Rogers RD, Ho LW, Aigbirhio FI, Paykel ES, Robbins TW, Sahakian BJ: Decision-making in mania: a PET study. Brain 2001; 124:2550–2563Crossref, Medline, Google Scholar
24. Chen HH, Nicoletti MA, Hatch JP, Sassi RB, Axelson D, Brambilla P, Monkul ES, Keshavan MS, Ryan ND, Birmaher B, Soares JC: Abnormal left superior temporal gyrus volumes in children and adolescents with bipolar disorder: a magnetic resonance imaging study. Neurosci Lett 2004; 363:65–68Crossref, Medline, Google Scholar
25. Mitchell RL, Elliott R, Barry M, Cruttenden A, Woodruff PW: Neural response to emotional prosody in schizophrenia and in bipolar affective disorder. Br J Psychiatry 2004; 184:223–230Crossref, Medline, Google Scholar
26. Brambilla P, Harenski K, Nicoletti M, Mallinger AG, Frank E, Kupfer DJ, Keshavan MS, Soares JC: MRI study of posterior fossa structures and brain ventricles in bipolar patients. J Psychiatr Res 2001; 35:313–322Crossref, Medline, Google Scholar
27. Cecil KM, DelBello MP, Sellars MC, Strakowski SM: Proton MR spectroscopy of the frontal lobe and cerebellar vermis in children with mood disorder and a familial risk for bipolar disorders. J Child Adolesc Psychopharmacol 2003; 13:545–555Crossref, Medline, Google Scholar
28. DelBello MP, Strakowski SM, Zimmerman ME, Sax KW, Hawkins JM: MRI analysis of the cerebellum in bipolar disorder. Neuropsychopharmacology 1999; 21:63–68Crossref, Medline, Google Scholar
29. Strakowski SM, DelBello MP, Sax KW, Zimmerman ME, Shear PK, Hawkins JM, Larson ER: Brain magnetic resonance imaging of structural abnormalities in bipolar disorder. Arch Gen Psychiatry 1999; 56:254–260Crossref, Medline, Google Scholar
30. Strakowski SM, DelBello MP, Zimmerman ME, Getz GE, Mills NP, Ret J, Shear P, Adler CM: Ventricular and periventricular structural volumes in first- versus multiple-episode bipolar disorder. Am J Psychiatry 2002; 159:1841–1847Link, Google Scholar