Medial Prefrontal Cortex Activity Associated With Symptom Provocation in Eating Disorders
Abstract
OBJECTIVE: The authors sought to identify neural correlates of eating disorders in order to contribute to the debate on the genesis and classification of eating disorders and provide endophenotypes for genetic research. METHOD: Twenty-six female patients with eating disorders (10 with bulimia nervosa, 16 with anorexia nervosa) and 19 healthy female comparison subjects matched for age and education were presented with food and aversive emotional images while brain activity was recorded with functional magnetic resonance imaging. RESULTS: Women with eating disorders identified the food stimuli as threatening and disgusting. In response to these stimuli, the women with eating disorders had greater activation in the left medial orbitofrontal and anterior cingulate cortices and less activation in the lateral prefrontal cortex, inferior parietal lobule, and cerebellum, relative to the comparison group. In addition, women with bulimia nervosa had less activation in the lateral and apical prefrontal cortex, relative to the comparison group. Between-group differences in response to nonspecific emotional stimuli were found in the occipital cortex, parietal cortex, and cerebellum. CONCLUSIONS: A medial prefrontal response to symptom-provoking stimuli was identified as a common feature of anorexia and bulimia nervosa. This finding supports a conceptualization of eating disorders as being transdiagnostic at the neural level. The abnormal prefrontal reaction is associated with symptom-related material, whereas the occipital and cerebellar differences are nonspecific. An abnormal propensity to activate medial prefrontal circuits in response to inappropriate stimuli is common to eating, obsessive-compulsive, and addictive disorders and may account for the compulsive features of behavior in these conditions.
Eating disorders comprise a spectrum of conditions, of which bulimia nervosa and anorexia nervosa are the major categories. Somatic symptoms (underweight, amenorrhea) are regarded as secondary to a core psychopathology, which is presumed to be encoded as long-standing alterations of cerebral neural circuits (1–3).
Evidence for a neural disturbance in eating disorders is compelling. The clinical syndrome can be reproduced by lesions in the right inferior prefrontal cortex (4, 5). Association with perinatal complications is also suggestive of a cerebral cause (6). Indirect evidence that eating disorders are neural diseases is inferred from neuropsychological, electrophysiological, neuropharmacological, structural neuroimaging, and functional neuroimaging investigations (3).
Functional neuroimaging studies in eating disorders have either investigated brain function at rest or under controlled disorder-specific conditions. Resting-state experiments have found global cerebral hypofunction (7), which is most pronounced in the anterior cingulate and frontal region (8, 9) and in the parietal lobe (7). In bulimia nervosa, parietal hypometabolism (7) and a loss of the normal right > left asymmetry of brain glucose metabolism (10) have been reported.
Controlled-condition experiments have used body shapes, eating, or food presentation to elicit symptom-related brain processes. In anorexia nervosa, perfusion of the frontal lobes (measured by single photon emission tomography [SPECT]) increased while subjects ate cake (11), and, in a functional magnetic resonance (fMRI) experiment, viewing high-caloric drinks elicited responses in the prefrontal cortex, anterior cingulate, insular cortex, and amygdala (12). A positron emission tomography (PET) study did not replicate these findings and reported food-related activity only in visual-associative cortices in seven anorexia nervosa patients who viewed high- versus low-caloric foods (13). Amygdala response to morphed images of subjects’ bodies has been reported in three patients with anorexia nervosa (14). Data on bulimia nervosa are limited. One SPECT study that included five patients with bulimia nervosa showed that high basal frontal perfusion decreased with eating, a response pattern opposite to that seen in anorexia nervosa (15).
A summary of resting- and controlled-condition studies suggests that the same regions (prefrontal cortices, anterior cingulate) show diminished activity at rest but abnormally increased activity in response to food challenge. Some abnormalities (parietal hypometabolism at rest) are common to anorexia nervosa and bulimia nervosa (7), while other (frontal reaction to eating) may differ between these diagnoses (15). These similarities and differences add to the debate on whether eating disorders constitute one entity with a spectrum of manifestations or are several separate syndromes (1, 2).
The propensity to specific attitudes (drive for thinness, fear of fatness) and behaviors (bingeing, restricting) is conceptualized as preferential activation of certain neural pathways and circuits. The functional relevance of neural circuits is inferred from activation patterns recorded in situations with a high probability of symptom manifestation. We used fMRI to investigate brain responses to food images in women with eating disorders and healthy female comparison subjects. Two general hypotheses were tested: 1) there will be activation patterns common to the whole eating disorders group, implying shared neural mechanisms, and 2) there will be responses specific to bulimia nervosa or anorexia nervosa, reflecting variations within the eating disorders spectrum. These differences should be specifically manifest in response to disease-specific material (food images), when symptom-related neural schemata are likely to be activated. To establish stimulus specificity, nonspecific emotionally salient stimuli were used in addition to food images.
Method
Participants
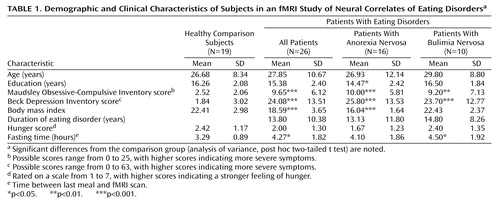
Patients with eating disorders were recruited from the inpatient (N=12) and outpatient (N=16) services of the South London and Maudsley Hospitals. Exclusion criteria were metallic implants, psychotropic medication other than antidepressants, claustrophobia, neurological disease, and axis I mental disease other than eating disorders. Affective and obsessive-compulsive symptoms are integral parts of eating disorders (1, 17), and their presence was not an exclusion criterion. Healthy women were recruited by local advertisement and were screened for abnormal eating habits and for neurological and psychiatric disease. Current and minimum past body mass index values were calculated. The Maudsley Obsessive-Compulsive Inventory (18) and the Beck Depression Inventory (19) were used to measure severity of obsessive-compulsive and depressive symptoms.
After complete description of the study to the subjects, written informed consent was obtained, as approved by the South London and Maudsley Ethical Committee. Nine healthy participants and eight participants with anorexia nervosa were selected as comparison groups for recovered subjects in a parallel study, which is reported elsewhere (20).
Stimuli
Custom-created color photographs depicted savory (e.g., pizza, rice, bread) and sweet (e.g., cake, chocolate) foods presented on plates. Photographs of nonfood items (stationery, household objects, flowers) were individually matched for color and visual complexity based on the ratings by five volunteers.
Emotional aversive photographs were selected from the International Affective Picture System (IAPS) (21) (IAPS numbers 2720, 2730, 3000, 3010, 3030, 3051, 3053, 3071, 3100, 3170, 3261, 9140, 9253, 9300, 9340, 9373, 9405) and contrasted with neutral stimuli matched for color and visual complexity (IAPS numbers 1600, 1670, 5201, 2250, 5390, 5780, 5982, 5990, 5991, 7010, 7020, 7090, 7100, 7150, 7235, 7550, 7950). A complete list of stimuli is available on request from the first author.
Procedure
Participants were asked to eat a meal 3 hours before the experiment and to avoid smoking, eating, and drinking alcoholic or caffeine-containing beverages after the meal. Due to differential compliance, the time since the last meal was longer in the eating disorders group (“fasting time”) (Table 1). After completing questionnaires and rating their feeling of hunger (Table 1), participants were scanned between 5:00 and 7:00 p.m. Food and nonfood images were presented on a rear-projecting screen and viewed by means of a double-mirror periscope fitted to the head coil. Each image was shown for 2.5 seconds and was followed by a blank screen shown for 0.5 seconds. Ten food pictures in a 30-second block (“on” condition) were followed by 10 nonfood pictures (“off” condition). This sequence was repeated five times (with different stimuli) during the 5-minute experiment. Participants received the instruction: “You will be shown pictures of food and other objects. Look at each picture and think how hungry it makes you feel.” An identical procedure was followed with aversive and neutral IAPS images with the following instruction: “You will be presented with a number of color pictures. Look at each of them and think what it makes you feel like.” The order of the two experiments was counterbalanced between subjects. After the scanning, participants rated individual images from 1 (not at all) to 7 (very much) on numeric analogue scales for pleasantness, disgust, and fear. Food pictures were also rated for “desire to eat.”
Image Acquisition
Gradient echo echoplanar images were acquired on a 1.5-T neuro-optimized magnetic resonance system (GE Medical Systems, Milwaukee). One hundred T2*-weighted whole brain volumes were acquired in each experiment (repetition time=3 seconds, echo time=40 msec) in 16 near-axial 7-mm thick slices (0.7-mm interslice gap) depicting blood-oxygen-level-dependent (BOLD) contrast with an in-plane resolution of 3 mm.
Data Analysis and Statistics
After motion correction (22), the estimated BOLD effect was modeled by two Poisson functions with hemodynamic delays of 4 and 8 seconds. This model has been extensively tested and shown to provide a fit equivalent to the physiological model of the BOLD effect. The least-squares model of the weighted sum of these two functions was compared with the signal in each voxel to obtain a goodness of fit statistic. The distribution of this statistic under the null hypothesis was calculated by wavelet-based resampling of the time series. Generic group activation maps, which depicted regions where the BOLD signal was significantly stronger in response to the active images (of food or aversive items) than to the control images (of nonfood or neutral items), were constructed by mapping the observed and randomized test statistics into standard space and computing and testing median activation maps. Between-group differences were established by cluster-level analysis with data randomization between groups to determine the sampling distribution of group differences under the null hypothesis. The probability of occurrence of any cluster in the observed data was computed by reference to the null distribution (23). In each experiment (food, aversive stimuli), four group comparisons were performed: eating disorders group and comparison subjects, anorexia nervosa subjects and comparison subjects, bulimia nervosa subjects and comparison subjects, and anorexia nervosa subjects and bulimia nervosa subjects. To correct for repeated comparisons, a cluster-wise significance threshold was set at p≤0.001. At this level, the cumulative number of expected false positive clusters in all eight comparisons was less than one. Behavioral data were analyzed by using analysis of variance and post hoc two-tailed t tests (uncorrected).
Results
Demographic and Behavioral Data
Of 43 patients with eating disorders who were assessed, nine declined to participate and eight were excluded because of past substance abuse (N=4), claustrophobia (N=1), and dental plates or metal implants (N=3). The final study group consisted of 26 women with an eating disorder and 19 healthy comparison subjects. Ten participants fulfilled the DSM-IV criteria for bulimia nervosa and 16 for anorexia nervosa (nine with the restricting type and seven with the binge-eating/purging type). Ten participants (five with bulimia nervosa and five with anorexia nervosa) were taking antidepressant medication (selective serotonin reuptake inhibitors [SSRIs]). Although efforts were made to minimize delays between recruitment and the experiment, four of the 16 anorexia nervosa patients gained enough weight to be outside the diagnostic weight range at the time of scanning. Inclusion of patients who were taking medication and who had body weight outside the diagnostic range was addressed in the analysis.
The groups did not differ in age, gender (all female), or handedness (one comparison and one anorexia nervosa patient were left-handed). The anorexia nervosa group reported significantly fewer years of education than the comparison group, whereas the bulimia nervosa group did not differ in education from the comparison subjects. Both patient groups scored significantly higher on self-report measures of obsessive-compulsive symptoms and depression (Table 1).
Subjective Rating of Stimuli
The participants with eating disorders rated food stimuli as significantly less desirable, less pleasant, more disgusting, and more fearful than did the comparison subjects; there were no differences in ratings of the nonfood stimuli (Table 2). Aversive stimuli were rated as more strongly negative by eating disorders subjects than by comparison subjects; there were no differences in ratings of the neutral stimuli (Table 2).
Experiment 1: Food Versus Nonfood Stimuli
Generic group activation maps
For the comparison group, activity in the left lateral prefrontal (Brodmann’s area 10, 9), left parietal (Brodmann’s area 7, 40), and bilateral visual (Brodmann’s area 17, 18) cortices and bilaterally in the cerebellum correlated with presentation of food stimuli at p≤0.01 (Figure 1).
For the eating disorders group, food-related activity occurred in the anterior cingulate gyrus (Brodmann’s area 24, 32) (p<0.001), posterior cingulate gyrus (Brodmann’s area 23, 29, 30) (p<0.001), left orbitofrontal cortex (Brodmann’s area 11) (p<0.02), left lateral prefrontal cortex (Brodmann’s area 10), and right cerebellum (posterior lobe, declive). Activations in the anterior cingulate cortex and in the right cerebellum were similar in the bulimia nervosa and anorexia nervosa subgroups. Medial prefrontal activity was more extensive in the bulimia nervosa subgroup, whereas lateral prefrontal activation was detected only in the anorexia nervosa subgroup (Figure 1).
Group comparisons
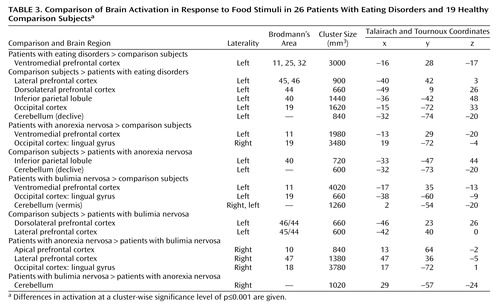
In the eating disorders group, a left-sided cluster subsuming the medial orbitofrontal and anterior cingulate cortices was more active in response to food. This activation was significantly greater not only in the whole eating disorders group, relative to the comparison subjects, but also in the subgroups with bulimia nervosa and anorexia nervosa. Examination of time series revealed a strong reaction (0.5% change in BOLD signal) in this region in the eating disorders group, especially during the first three blocks of the paradigm (Figure 2). In addition, relative to the comparison group, the anorexia nervosa subgroup showed more activity in the lingual gyrus and the bulimia nervosa showed more occipital and cerebellar activity (Table 3, Figure 2).
The left lateral prefrontal cortex, left inferior parietal lobule, left occipital cortex, and posterior cerebellum were significantly less activated in the eating disorders subjects than in the comparison subjects. Responses in these regions in the comparison subjects averaged around 0.25% change in BOLD signal (the time series for the inferior parietal lobule is presented in Figure 2). Inferior parietal lobule and cerebellar activity were more diminished in the anorexia nervosa subjects, whereas lateral prefrontal activity was decreased specifically in the bulimia nervosa subjects, relative to the comparison subjects and to the anorexia nervosa subjects (Table 3, Figure 2).
Exclusion of confounding factors
To address potential confounding factors that were related to inclusion of patients who were taking medication and patients who had gained weight, the group comparisons were repeated after exclusion of these participants. The diagnostically “pure” and medication-free group of 12 patients (five with bulimia nervosa, seven with anorexia nervosa) had significantly higher medial orbitofrontal and anterior cingulate activity and significantly lower lateral prefrontal, inferior parietal lobule, and left cerebellar activity than the comparison subjects. The group of 10 patients who were taking SSRI medication also showed higher orbitofrontal and lower lateral prefrontal activity, relative to the comparison subjects.
To investigate whether differences were related to depressive symptoms, a group of five eating disorders patients with Beck Depression Inventory scores below 14 (the cutoff value for mild depressive symptoms [19]) was selected. Relative to the comparison group, this nondepressed group had greater left orbitofrontal, bilateral medial prefrontal, and anterior cingulate responses and lower left parietal response.
Finally, three eating disorders patients (two with anorexia nervosa, one with bulimia nervosa) reported longer times (fasting times between 7 and 9 hours) than the other subjects since their last meal before the experiment. After exclusion of these three patients, there was no between-group difference in fasting time (p=0.36), but the significance of the between-group differences in the medial and lateral prefrontal cortex, parietal cortex, and cerebellum was not diminished.
Subtypes of anorexia nervosa
Exploratory comparisons of the restricting and binge-eating/purging types of anorexia nervosa were conducted, although the numbers of subjects in the subgroups were small (nine with the restricting type, seven with the binge-eating/purging type). In reaction to food stimuli, left medial prefrontal activation was significantly higher in subjects with the restricting type than in the comparison subjects. In the binge-eating/purging subgroup, significantly different activation, relative to the comparison group, was right-sided and was located in the lateral orbitofrontal cortex (Brodmann’s area 47) and anterior orbitofrontal cortex (Brodmann’s area 10).
When reactions to food were compared between the subgroups, the right anterior prefrontal (Brodmann’s area 10; stereotaxic coordinates 11, 67, –7 [24]) and lateral orbitofrontal (Brodmann’s area 47; coordinates 41, 26, –18) responses were stronger in patients with the binge-eating/purging type; there were no clusters significantly more activated in the patients with the restricting type.
Experiment 2: Aversive Versus Neutral Stimuli
Generic group activation maps
In response to aversive compared to neutral stimuli, there were two main symmetrical foci of activation: dorsolateral prefrontal activations (Brodmann’s area 44, 45, 46) and occipital activations extending into the temporal and parietal cortices (Brodmann’s area 18, 19, 7). This pattern was similar in all groups (Figure 1).
Group comparisons
Group differences in response to aversive emotional stimuli were located in the posterior cortices and in the cerebellum. Response in the right cerebellum was lower in both clinical groups than in the comparison group, whereas the left cerebellar reaction was significantly greater in patients with anorexia nervosa than in the comparison subjects. Greater activity in the visual occipital cortex and in the left inferior parietal lobule was characteristic of the bulimia nervosa patients. There were no between-group differences in the frontal reaction to aversive emotional stimuli (Table 4).
Discussion
Exploration of cerebral activity during presentation of food images has identified activations common to the whole eating disorders group and specific to subgroups with particular eating disorder diagnoses. An abnormal prefrontal reaction was specifically manifested in response to food stimuli, whereas differences in cerebellar, occipital, and parietal activity were present in reaction to both emotional and food images.
In response to food stimuli, patients with eating disorders recruited the medial orbitofrontal cortex and the anterior cingulate instead of the inferior parietal lobule and the left cerebellum, which were activated in the healthy comparison group. The finding of an increased medial prefrontal reaction to food was independently significant for both the anorexia nervosa and bulimia nervosa subgroups and therefore can be considered as a functional neural substrate common to these eating pathologies. The ventromedial prefrontal location of differential activity corresponds to locations where lesions are known to cause eating disorders–like syndromes (4, 5) and to neuroimaging data (8, 9, 11, 12, 15). The orbitofrontal and anterior cingulate cortices are a convergence zone for processing of emotional information and are consistently implicated in the pathogenesis of obsessive-compulsive and affective disorders (25, 26). Because there is phenomenological overlap (1, 17), comorbidity, and familial co-occurrence (27) of these disorders with eating disorders, common neural mechanisms are suspected. Since addiction-like cue reactivity has been described in bulimia nervosa (28), another parallel comes from studies in drug addiction, which show anterior cingulate and orbitofrontal activations related to craving and compulsive drug-taking behaviors (16, 29). From these data, evidence converges on the anterior cingulate and the orbitofrontal cortex as major constituents in a dysfunctional network associated with compulsive and affective phenomena in a group of related disorders.
In our study, the patients with bulimia nervosa differed both from the patients with anorexia nervosa and from the comparison subjects by having decreased activation in the anterior and lateral prefrontal cortex in response to food. As the lateral prefrontal cortex is involved in suppressing undesirable behaviors (30), diminished activity in this region may account for the loss of control in the eating behavior of bulimic patients. Lateral and apical prefrontal activity has been retrospectively associated with good outcome in anorexia nervosa (20). In the future, frontal involvement in response to food may be evaluated as an outcome-modifying factor in bulimia nervosa.
Differences between groups in posterior cortical and cerebellar activation were present in reaction to both food and emotional stimuli. There are few data for comparison. Many neuroimaging studies have omitted the cerebellum or have used it as a baseline reference (11, 15). In this study, diagnosis-specific changes in cerebellar activations have been highlighted. As these activations were present in both the food and aversive emotional stimuli conditions, they are likely to be associated with nonspecific processes, such as attention and arousal.
The present findings are largely compatible with previous reports. In detailed comparisons, however, there are two notable differences. First, activation in the amygdala differentiated anorexia nervosa subjects from comparison subjects in a previous study from our laboratory (12), but in the present investigation there was no significant amygdala activation either in group maps or in between-group comparisons. Methodological differences, which might explain this difference in findings, include the type of stimuli (images of drinks labeled as high- or low-caloric were used previously) and the analytical procedures (more conservative in the current study). A more conclusive answer on the role of amygdala in eating disorders can be expected from studies with regionally optimized acquisition. Second, comparing anorexia nervosa and bulimia nervosa, we have found both common and differential components in frontal response to food stimuli, whereas an opposite pattern of frontal reaction to eating in anorexia nervosa and bulimia nervosa was reported by Nozoe et al. (15). In comparing the two studies’ findings, different provocation paradigms (eating food versus seeing food) and neuroimaging methods (SPECT and fMRI) have to be taken into account. Most notably, Nozoe et al. chose to analyze regions of interest in only three of 35 axial slices; their findings may thus correspond to differential lateral prefrontal changes, while any common aspects of response in the ventromedial cortex may have been missed.
To our knowledge, the current study is the largest functional neuroimaging study in eating disorders to date and the first fMRI study in bulimia nervosa. A direct comparison of anorexia nervosa and bulimia nervosa patients allowed us to evaluate the similarities and differences of these groups. In addition to presentation of food images, a comparison paradigm was used to control for saliency and thus to differentiate between specific and nonspecific processes. Inclusion of subjects who were taking medication and of partially weight-recovered subjects was addressed in a confirmatory analysis by exclusion of the individuals with those characteristics.
Although the number of subjects in the current study is larger than in previous neuroimaging studies, it may not be large enough to explore the full eating disorders spectrum (e.g., subtypes of anorexia nervosa). The capacity of fMRI to detect signal changes is subject to regional differences in signal-to-noise ratio, and therefore the study procedures may be sensitive enough to detect differences in some brain regions but may lack power to do so in other regions (unpublished 2003 data of M. Brammer). Furthermore, fMRI explores paradigm-related changes in brain function but does not identify baseline differences, such as those reported in PET studies (13). The paradigm-related changes of activity reported here will therefore be best appreciated as deviations from a baseline, which itself is altered in eating disorders (7, 15).
The food paradigm was conceived as a symptom-provocation challenge, and the accompanying instruction was biased toward food as opposed to control stimuli. Therefore, the resulting activations cannot be interpreted as pure reactions to food. Because the same procedure was applied for all participants, the group comparisons were not affected by this instruction bias.
In conclusion, an abnormal focus of food-related activity in the medial prefrontal region has been identified in a large number of eating disorders patients. This activity was specifically manifested in response to symptom-related material and was independent of the type of eating disorders, use of medication, presence of depressive symptoms, fasting time, and body-weight status. Distinct aspects of anorexia and bulimia nervosa were reflected in the activity of circuits comprising the lateral and anterior prefrontal cortices. The similarity of findings in eating, obsessive-compulsive, and affective disorders and in addiction raises the possibility of a common compulsion- and affect-related circuit that is based in the medial prefrontal cortex and activated by disease-specific stimuli in these various conditions.
 |
 |
 |
 |
Preliminary results from 18 participants were reported at the 7th Annual Meeting of the Organization for Human Brain Mapping, Brighton, U.K., June 10–14, 2001 (abstract in NeuroImage 2001; 13:S1022). Received May 19, 2003; revision received July 30, 2003; accepted Nov. 7, 2003. From the Institute of Psychiatry, King’s College London; and the Medical Research Council Cognition and Brain Sciences Unit, Cambridge, U.K. Address reprint requests to Dr. Uher, Eating Disorders Unit, Institute of Psychiatry PO59, King’s College London, De Crespigny Park, London, SE5 8AF, UK; [email protected] (e-mail). Supported by grant QLK1-1999-916 from the European Commission Framework V program and the Nina Jackson Eating Disorders Research Charity. Dr. Uher is supported by a Travelling Research Fellowship (grant 065862) from the Wellcome Trust.

Figure 1. Examples of Stimuli and Generic Maps of Brain Activation in Response to Food and Aversive Images in Patients With Eating Disorders and Healthy Comparison Subjectsa
aThree representative axial slices are presented in radiological convention (right hemisphere is on the left-hand side of the image). The vertical position of each slice is determined by the z coordinate, which is given at the bottom of the figure. The depicted activations were associated with the active stimuli at the cluster-wise level of significance of p≤0.01.

Figure 2. Comparison of Brain Activation in Response to Food Stimuli and Time Series of Activation in Patients With Eating Disorders and Healthy Comparison Subjectsa
aDifferences in activation at a cluster-wise significance level of p≤0.001 are shown in red in three representative axial slices. The vertical position of the slices is determined by the z coordinate, which is given at the bottom of the figure. Time series have been extracted from the medial prefrontal and inferior parietal clusters of activity in the composite patient group (N=26) and the healthy comparison group (N=19). After smoothing by a running average of five time points (15 seconds), time series have been plotted against the stimuli presentation paradigm (blue line).
1. Fairburn CG, Harrison PJ: Eating disorders. Lancet 2003; 361:407–416Crossref, Medline, Google Scholar
2. Treasure J, Collier D: The spectrum of eating disorders in humans, in Animal Models: Disorders of Eating Behaviour and Body Composition. Edited by Owen JB, Treasure JL, Collier DA. Dordrecht, Netherlands, Kluwer Academic, 2001, pp 19–49Google Scholar
3. Uher R, Treasure J, Campbell IC: Neuroanatomical bases of eating disorders, in Biological Psychiatry. Edited by D’Haenen HAH, den Boer JA, Willner P. Chichester, UK, John Wiley & Sons, 2002, pp 1173–1180Google Scholar
4. Trummer M, Eustacchio S, Unger F, Tillich M, Flaschka G: Right hemispheric frontal lesions as a cause for anorexia nervosa report of three cases. Acta Neurochir (Wien) 2002; 144:797–801Crossref, Medline, Google Scholar
5. Ward A, Tiller J, Treasure J, Russell G: Eating disorders: psyche or soma? Int J Eat Disord 2000; 27:279–287Crossref, Medline, Google Scholar
6. Cnattingius S, Hultman CM, Dahl M, Sparen P: Very preterm birth, birth trauma, and the risk of anorexia nervosa among girls. Arch Gen Psychiatry 1999; 56:634–638Crossref, Medline, Google Scholar
7. Delvenne V, Goldman S, DeMaertelaer V, Lotstra F: Brain glucose metabolism in eating disorders assessed by positron emission tomography. Int J Eat Disord 1999; 25:29–37Crossref, Medline, Google Scholar
8. Naruo T, Nakabeppu Y, Deguchi D, Nagai N, Tsutsui J, Nakajo M, Nozoe SS: Decreases in blood perfusion of the anterior cingulate gyri in Anorexia Nervosa Restricters assessed by SPECT image analysis. BMC Psychiatry 2001; 1:2Crossref, Medline, Google Scholar
9. Takano A, Shiga T, Kitagawa N, Koyama T, Katoh C, Tsukamoto E, Tamaki N: Abnormal neuronal network in anorexia nervosa studied with I-123-IMP SPECT. Psychiatry Res 2001; 107:45–50Crossref, Medline, Google Scholar
10. Wu JC, Hagman J, Buchsbaum MS, Blinder B, Derrfler M, Tai WY, Hazlett E, Sicotte N: Greater left cerebral hemispheric metabolism in bulimia assessed by positron emission tomography. Am J Psychiatry 1990; 147:309–312Link, Google Scholar
11. Nozoe S, Naruo T, Nakabeppu Y, Soejima Y, Nakajo M, Tanaka H: Changes in regional cerebral blood flow in patients with anorexia nervosa detected through single photon emission tomography imaging. Biol Psychiatry 1993; 34:578–580Crossref, Medline, Google Scholar
12. Ellison Z, Foong J, Howard R, Bullmore E, Williams S, Treasure J: Functional anatomy of calorie fear in anorexia nervosa (letter). Lancet 1998; 352:1192Crossref, Medline, Google Scholar
13. Gordon CM, Dougherty DD, Fischman AJ, Emans SJ, Grace E, Lamm R, Alpert NM, Majzoub JA, Rauch SL: Neural substrates of anorexia nervosa: a behavioral challenge study with positron emission tomography. J Pediatr 2001; 139:51–57Crossref, Medline, Google Scholar
14. Seeger G, Braus DF, Ruf M, Goldberger U, Schmidt MH: Body image distortion reveals amygdala activation in patients with anorexia nervosa—a functional magnetic resonance imaging study. Neurosci Lett 2002; 326:25–28Crossref, Medline, Google Scholar
15. Nozoe S, Naruo T, Yonekura R, Nakabeppu Y, Soejima Y, Nagai N, Nakajo M, Tanaka H: Comparison of regional cerebral blood flow in patients with eating disorders. Brain Res Bull 1995; 36:251–255Crossref, Medline, Google Scholar
16. Maas LC, Lukas SE, Kaufman MJ, Weiss RD, Daniels SL, Rogers VW, Kukes TJ, Renshaw PF: Functional magnetic resonance imaging of human brain activation during cue-induced cocaine craving. Am J Psychiatry 1998; 155:124–126Link, Google Scholar
17. Halmi KA, Sunday SR, Klump KL, Strober M, Leckman JF, Fichter M, Kaplan A, Woodside B, Treasure J, Berrettini WH, Al Shabboat M, Bulik CM, Kaye WH: Obsessions and compulsions in anorexia nervosa subtypes. Int J Eat Disord 2003; 33:308–319Crossref, Medline, Google Scholar
18. Hodgson RJ, Rachman S: Obsessional-compulsive complaints. Behav Res Ther 1977; 15:389–395Crossref, Medline, Google Scholar
19. Beck AT, Steer RA, Brown GK: BDI II Manual. San Antonio, Tex, Psychological Corp, 2002Google Scholar
20. Uher R, Brammer MJ, Murphy T, Campbell IC, Ng VW, Williams SC, Treasure J: Recovery and chronicity in anorexia nervosa: brain activity associated with differential outcomes. Biol Psychiatry 2003; 54:934–942Crossref, Medline, Google Scholar
21. Lang PJ, Bradley MM, Cuthbert BN: International Affective Picture System (IAPS). New York, National Institute of Mental Health Center for the Study of Emotion and Affection, 1999Google Scholar
22. Bullmore ET, Brammer MJ, Rabe-Hesketh S, Curtis VA, Morris RG, Williams SC, Sharma T, McGuire PK: Methods for diagnosis and treatment of stimulus-correlated motion in generic brain activation studies using fMRI. Hum Brain Mapp 1999; 7:38–48Crossref, Medline, Google Scholar
23. Bullmore ET, Suckling J, Overmeyer S, Rabe-Hesketh S, Taylor E, Brammer MJ: Global, voxel, and cluster tests, by theory and permutation, for a difference between two groups of structural MR images of the brain. IEEE Trans Med Imaging 1999; 18:32–42Crossref, Medline, Google Scholar
24. Talairach J, Tournoux P: Co-Planar Stereotaxic Atlas of the Human Brain: Three-Dimensional Proportional System. New York, Thieme Medical, 1988Google Scholar
25. Drevets WC: Neuroimaging and neuropathological studies of depression: implications for the cognitive-emotional features of mood disorders. Curr Opin Neurobiol 2001; 11:240–249Crossref, Medline, Google Scholar
26. Saxena S, Brody AL, Schwartz JM, Baxter LR: Neuroimaging and frontal-subcortical circuitry in obsessive-compulsive disorder. Br J Psychiatry Suppl 1998; 35:26–37Medline, Google Scholar
27. Bellodi L, Cavallini MC, Bertelli S, Chiapparino D, Riboldi C, Smeraldi E: Morbidity risk for obsessive-compulsive spectrum disorders in first-degree relatives of patients with eating disorders. Am J Psychiatry 2001; 158:563–569Link, Google Scholar
28. Carter FA, Bulik CM, McIntosh VV, Joyce PR: Changes in cue reactivity following treatment for bulimia nervosa. Int J Eat Disord 2001; 29:336–344Crossref, Medline, Google Scholar
29. Volkow ND, Fowler JS: Addiction, a disease of compulsion and drive: involvement of the orbitofrontal cortex. Cereb Cortex 2000; 10:318–325Crossref, Medline, Google Scholar
30. Aron AR, Fletcher PC, Bullmore ET, Sahakian BJ, Robbins TW: Stop-signal inhibition disrupted by damage to right inferior frontal gyrus in humans. Nat Neurosci 2003; 6:115–116Crossref, Medline, Google Scholar