Brain Volumes, RBC Status, and Hepatic Function in Alcoholics After 1 and 4 Weeks of Sobriety: Predictors of Outcome
Abstract
OBJECTIVE: The authors asked if hematological indices of RBC status and hepatic function in newly sober alcoholic men are related to abnormalities in brain morphology, change with normalization of brain function during short-term sobriety, and predict prolonged sobriety. METHOD: Alcoholic men received brain magnetic resonance imaging and laboratory assessments on admission and before discharge from an inpatient treatment program. Healthy comparison men were similarly tested. RESULTS: On admission, RBC count, hemoglobin level, and hematocrit were significantly lower in alcoholic subjects than comparison subjects; mean corpuscular volume, SGOT, SGPT, and γ-glutamyl transpeptidase were significantly higher. By discharge, all measures had improved, although RBC count, mean corpuscular volume, and γ-glutamyl transpeptidase levels remained significantly different from those of comparison subjects. Upon admission, alcoholic men had smaller cortical white and gray matter and larger lateral and third ventricle volumes, with reduced lateral ventricle and increased anterior cortical gray matter volumes by discharge. Lower RBC count, hemoglobin level, and hematocrit were associated with lower white matter and higher ventricular volumes at admission. Change in these measures was related to reduction in ventricular volume with treatment. By discharge, associations among RBC count, hemoglobin level, and hematocrit and white matter and ventricular volumes were less marked than at admission. Discharge hemoglobin value and hematocrit discriminated patients who maintained sobriety from those who relapsed. Hepatic function showed limited association with brain measures at admission and discharge. CONCLUSIONS: Hemograms reflect alcohol-related abnormalities in brain morphology, improvement over short-term sobriety, and liability to relapse after treatment.
Long-term alcohol consumption affects brain structure and function as well as many other bodily systems, including liver function and nutritional status. Severe hematic dysfunction (1, 2) and nutritional deficiency (3, 4) occurring independent of heavy alcohol consumption have been associated with global abnormalities in brain morphology that normalize after treatment (5). In alcoholics, associations have been observed between ventricular enlargement, measured with computerized tomography, and measures of hepatic dysfunction (6) or mean corpuscular volume and hematocrit (7). Magnetic resonance imaging (MRI) studies have linked malnutrition and cerebellar shrinkage (8) and mean corpuscular volume and generalized brain shrinkage (9). However, although it is generally accepted that hepatic dysfunction and poor nutritional status may contribute, along with alcohol toxicity, to the brain abnormalities seen in chronic alcoholism, the nature and extent of their contribution and how these associations may change with sobriety have not been well documented.
In this report, we present data on hematological measures obtained approximately 1 week after detoxification and again after 3 weeks of supervised abstinence from a group of men with chronic alcoholism. Although laboratory panels are routinely collected for clinical evaluation in inpatient treatment settings to screen for heavy drinking in general practice or to monitor treatment compliance (e.g., reference 10), quantitative analyses of change in measures reflecting hepatic function or RBC status over the short-term course of treatment are sparse. MRI brain scans, obtained on the same day as the laboratory assessment, showed that the alcoholic men had significant volume deficits in cortical white and gray matter and enlargement of the lateral and third ventricles at the start of treatment relative to healthy comparison subjects (11). After 3 weeks of abstinence, CSF volumes of the lateral ventricles and posterior cortical sulci declined, while anterior cortical gray matter volume increased; changes were not seen in a comparison group retested over the same interval (12).
Studies of the outcome of alcoholism treatment have focused on psychological (e.g., sense of self-efficacy), behavioral (e.g., past drinking and treatment history), and psychobiological (e.g., craving, postacute withdrawal syndrome) antecedents to relapse (13). Few studies, however, have documented the extent to which a patient’s state of physical well-being, as reflected by hepatic or hematological indicators, may contribute to their success in maintaining extended sobriety after completion of formal treatment.
For this report, we asked whether RBC and hepatic status seen at study entry would be related to concurrent abnormalities in brain morphology observed and whether changes in these indices over a period of supervised abstinence would be related to changes in brain morphology. We also asked whether any hematological indicators at treatment completion would predict sobriety outcome over the ensuing months.
Method
Subjects
The details of screening and diagnostic procedures for patients and comparison subjects are provided in earlier reports (11, 12). Demographic and clinical data are presented in Table 1. All subjects gave written informed consent to participate in this study after the procedures had been explained to them.
Patients With Chronic Alcoholism
All patients were veterans of the United States Armed Forces who were seeking treatment for alcoholism at a Department of Veterans Affairs medical center. All 58 patients included in the study met Research Diagnostic Criteria (RDC) (14) for alcoholism; had no past history of hospitalization for a DSM-III-R diagnosis of schizophrenia, major affective disorder, or any other axis I disorder; had no history of medical or neurological illness or trauma that would affect the CNS; or met RDC for substance abuse other than alcohol within the past year. Lifetime alcohol consumption was estimated with a semistructured interview (11, 15, 16).
Alcoholic patients were followed after discharge for 2–12 months. Of the 49 contacted, 17 reported having had no alcoholic drinks since discharge and were classified as abstainers. The rest were classified as relapsers.
Normal Comparison Subjects
The comparison subjects were 58 men, ages 24 to 79, who were recruited from the neighboring community and drawn from a larger group of comparison subjects used in other MRI studies from our laboratory (e.g., references 11, 17, and 18) because they agreed to have a second MRI within a month of the first. The comparison subjects underwent the same psychiatric and medical examinations as the patients. Prospective comparison subjects were excluded if they met RDC for substance abuse in the past year or had consumed the equivalent of four standard drinks per day over more than 1 month.
MRI Scans
Axial spin-echo MRI (field of view=24 cm, matrix=256×256, TE=20 and 80 msec, cardiac-cycle gated effective TR >2400 msec, 256 phase encodes) was used to quantify volumes of cortical gray and white matter and CSF in the lateral and third ventricles. Analysis (12) encompassed seven consecutive oblique 5-mm axial slices with a 2.5-mm skip, beginning at an index slice (the most inferior slice above the orbits, where the anterior horns of the lateral ventricles could be seen bilaterally) and proceeding superiorly. Each slice was segmented into CSF, gray matter, and white matter compartments by using a semiautomated image analysis technique (19). Cortical gray matter was defined as all gray matter pixels falling within the cortical mantle, insular, and cingulate cortices. Cortical white matter was defined as all white matter pixels underlying the cortical mantle and encompassing the centrum semiovale. Lateral ventricles were defined as all CSF pixels interior to the cortical region on the index slice and above; the third ventricle was measured on either the index slice or the one inferior to it. Volumes were determined from pixel counts expressed as cubic centimeters. Intracranial volume was calculated by modeling the volume as a sphere, using the area of the index slice and an estimate of head height as the diameter (20).
We applied a two-step regression analysis based on comparison data to calculate z scores corrected for intracranial volume and age for each regional brain volume. Measurement of change in regional brain volume between scans employed procedures to minimize change due to measurement error, such as differences in head position between scans (12, 21).
Laboratory Assessments
On the day of each scan, height and weight, from which body mass index was computed, were measured, and fasting blood and urine samples were taken to assess the somatic sequelae of chronic alcoholism and their reversibility during hospitalization. Not all tests were performed on all subjects at both times, but the panel included assessments of liver function—albumin, alkaline phosphatase, bilirubin, SGOT, SGPT, and γ-glutamyl transpeptidase levels—and of blood chemistry—RBC count, mean corpuscular volume, mean corpuscular hemoglobin concentration, and hemoglobin, hematocrit, serum protein, and serum sodium levels. The ratio of SGOT/SGPT was also computed to provide an indicator of alcoholic hepatitis (22). In addition to analyzing data as continuous variables, each value was categorized as low, normal, or high according to the clinical standards provided by the laboratory where the analyses were performed. Liver enzyme data from three subjects that fell more than two standard deviations from the other patients in this group were excluded from continuous but not from categorical data analysis.
Data Analysis
Group differences at study entry were assessed by using unpaired t tests and chi-square comparisons of categorical data. Group comparisons of change over time were assessed by using repeated-measures analysis of variance. Associations between laboratory and brain measures at each time point and between the amounts of change between sessions were assessed by using Pearson correlations. The value of hematological measures for predicting subsequent sobriety was assessed by t tests comparing patients subsequently classified as abstainers and relapsers.
Results
Laboratory Measures
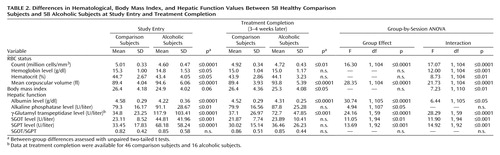
Table 2 summarizes values for laboratory variables for each group at study entry and treatment completion and provides the statistical results for tests of group differences at each session and for group-by-session interactions.
Nutritional and RBC Status
At study entry, after 1 week of sobriety, the mean values for the alcoholic patients fell within clinical norms for body mass index as well as RBC count, hemoglobin level, hematocrit, and mean corpuscular volume. However, mean values for the patients differed significantly from those for the comparison group (Table 2). Furthermore, chi-square analysis showed that a significant proportion of the alcoholic group fell outside clinical norms for RBC count and mean corpuscular volume in relation to the comparison group, whereas the proportion falling outside clinical norms for hematocrit and hemoglobin level differed from the comparison subjects at a less-than-significant level (Table 3).
After an additional 3 weeks of sobriety, a nutritious hospital diet, and thiamine and vitamin supplementation when clinically indicated, mean values for alcoholics improved on all measures, including body mass index, whereas the comparison subjects showed no change over the same interval (group-by-time interactions, p<0.01 for all measures). Values for hematocrit and hemoglobin level normalized, both in relation to the comparison group and in terms of clinical norms (Table 2 and Table 3). Despite improvement in the alcoholic group as a whole, mean values for total RBC count remained significantly lower and those for mean corpuscular volume remained significantly higher in the alcoholics than the comparison subjects, and a significant proportion of the alcoholic group remained outside of clinical norms for these variables.
Hepatic Function
At study entry, mean liver enzyme levels (SGOT, SGPT, and γ-glutamyl transpeptidase) were above the clinically normal range in the alcoholics, even though the group had been screened to exclude patients with clinical signs of significant liver disease and overt hepatitis (Table 2 and Table 3). Other potential indicators of hepatic dysfunction, including elevated alkaline phosphatase, reduced albumin, and SGOT/SGPT values exceeding 2.0, fell within the clinically normal range. However, alkaline phosphatase and albumin levels (both p<0.0001) differed significantly from those of the comparison subjects, suggesting hepatic dysfunction.
After 3–4 weeks of sobriety, the alcoholics showed significant improvements in albumin, SGOT, SGPT, and γ-glutamyl transpeptidase levels; the comparison subjects showed no change over the same interval. Despite improvements, group differences persisted for all of these measures, although the proportion of patients with values falling outside clinical norms was now only marginally elevated relative to the comparison subjects (Table 3). The SGOT/SGPT index was below 1.0 in both groups at study entry and did not show significant group differences or change with treatment.
Cross-Sectional Associations
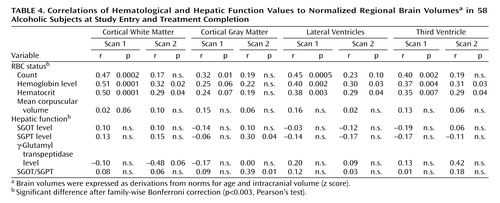
Measures of RBC status are considered first and then those associated with hepatic function. Table 4 summarizes associations at admission and discharge. Family-wise Bonferroni corrections for either RBC status or hepatic function correlations with brain regions (16 correlations) required p<0.003 for significance. Correlations for which probability fell between p<0.003 and p<0.05 were characterized as less than significant.
RBC Status
At study entry, lower RBC count and level of hemoglobin and hematocrit were significantly associated with smaller cortical white matter and larger lateral and third ventricle volumes. Despite being significantly elevated, mean corpuscular volume was not associated with any brain measure in the alcoholics.
At the end of the treatment program, during which the RBC count, the hemoglobin value, and the hematocrit improved, and the lateral ventricle volumes tended to normalize, correlations with volumes of white matter and both ventricular measures fell to less than significant for hemoglobin level and hematocrit and lost significance for RBC count. RBC count was also associated, at a less than significant level, with a greater gray matter volume deficit at study entry. Like the associations with white matter, these associations with gray matter did not persist through treatment.
Hepatic Function
None of the liver enzymes alone showed association with brain volume measures at study entry. By treatment completion, modest less-than-significant associations emerged between elevated SGPT and SGOT/SGPT and small cortical gray matter volumes.
Correlations Between Change in Brain and Hematological Measures
For the most part, change in hematological values during treatment was not associated with change in brain variables. Notable exceptions were increases in RBC count, hemoglobin value, and hematocrit, which were all significantly associated with reductions in volume of the lateral ventricles: hematocrit, p<0.01; hemoglobin, p<0.003; RBC count, p<0.01 (Figure 1). These associations remained significant even when the outlier with a 9-cc change in ventricular volume was excluded from analysis.
Hematological Differences Between Future Abstainers and Relapsers
We contacted 39 members of the alcoholic group 2–12 months after discharge for follow-up assessments that included a structured interview of drinking since discharge. Patients were categorized as abstainers (no drinks since discharge, N=17) or relapsers (one or more drinks since discharge, N=22). The time between discharge and follow-up was longer for the relapsers (mean=195.36 days, SD=93.78, range=73–345) than the abstainers (mean=97.94 days, SD=41.65, range=63–225) (t=3.98, df=37, p=0.0003). The total number of drinks consumed among the 22 relapsers was highly skewed (mean=325 drinks, SD=650, median=100, skewedness=2.6), reflecting the range both in follow-up interval and in quantity (1–26 drinks per day) and frequency (1–30 days per month) of drinking reported. Future abstainers had significantly higher values than relapsers for RBC count (t=2.03, df=36, p<0.05), hemoglobin level (t=2.52, df=36, p<0.05), hematocrit (t=2.21, df=36, p<0.05), and mean corpuscular hemoglobin concentration (t=2.04, df=36, p=0.05). Mean corpuscular volume and hepatic function indices showed no differences between these subgroups.
Discussion
The patients in this study were relatively healthy and free of major illness or significant somatic sequelae of the disease. The general condition of these subjects should be contrasted with subjects from some of the earlier reports of association between hematological measures and brain morphology (6, 8). Furthermore, subjects in the current study were relatively well educated and thus may not be typical of many alcoholic groups. Nevertheless, they manifested associations between measures of brain dysmorphology and indicators of RBC status. The strongest cluster of associations was present between RBC count, hemoglobin level, and hematocrit and white matter and ventricular volumes shortly after withdrawal from alcohol. We did not observe any association between mean corpuscular volume and brain volumes, as previously observed by ourselves (7) and others (9). After 3 weeks of good nutrition with an increased body mass index, supervised sobriety, and group counseling, values for RBC count, hemoglobin level, hematocrit, and mean corpuscular volume all improved, perhaps reflecting a resolution of mild relative macrocytic anemia. The reduction in ventricular volume that also occurred during treatment was associated with improvement in RBC count and hemoglobin level and hematocrit but not mean corpuscular volume. Associations between RBC count, hemoglobin level, and hematocrit and ventricular and cortical white matter volumes were less marked at discharge than at study entry, but RBC count, hemoglobin level, and hematocrit at discharge proved a significant discriminator between patients who maintained sobriety and those who relapsed over the ensuing months.
In contrast to RBC status, hepatic function showed no association with brain structure at study entry. With improvement in hepatic function over the treatment period, modest associations with cortical gray matter volume emerged for SGPT and SGOT/SGPT but not any of the other indices measured. Unlike RBC status, hepatic function was not predictive of sobriety in the follow-up period.
The strongest cluster of associations between brain volume and hematological measures emerged between white matter volume and RBC status at study entry within approximately 1 week of sobriety but resolved within approximately 4 weeks of sobriety. These RBC status associations were extended to lateral and ventricular volumes. By contrast, gray matter volume showed a modest association with hepatic function that emerged only after the longer period of sobriety. Hepatic-gray matter associations, however, did not endure Bonferroni correction.
Quantitative assessment of regional brain volumes even at a single time point is challenging, and measurement of true biological change in brain morphology is even harder to accomplish. Thus, little is known about the rate and amount of change in brain volumes to be expected during a period of alcohol withdrawal such as that occurring in this study. Similarly, although hematological status is routinely assessed in patients undergoing treatment for alcoholism, quantitative reports on fluctuation during treatment (e.g., reference 23) are surprisingly sparse. In the current study, RBC status was associated with brain morphology shortly after drinking cessation, improvements in RBC status with sobriety during 3 weeks of sobriety were associated with reduction in ventricular volume occurring in the same interval, and most important, RBC status at the end of treatment differentiated the patients who relapsed and those who maintained sobriety. It is not known if the RBC deficits at study entry were due to nutritional deficiency or to the direct toxic effects of alcohol or were related to individual susceptibility to these factors.
Our finding that higher hematocrit, hemoglobin level, and RBC count are associated with—and thus may facilitate—sobriety maintenance requires replication and more formal testing. This study relied on self-reports at naturally occurring variable intervals to define relapse and did not address how RBC status might interact with the psychosocial and behavioral variables more often considered when predicting relapse (13). Furthermore, it provides no indication as to the mechanism by which RBC status might have contributed to the maintenance of abstinence in these particular men. However, clinicians will recognize the commonsense observation that patients who are better fortified physically at the end of treatment will be better equipped for maintaining sobriety. For instance, a recent study demonstrated that even borderline anemia is an independent risk factor for physical decline in old age (24). A key question to address is whether specific treatments to improve RBC status can minimize relapse in patients known to be at high risk for recidivism on the basis of demographic and psychosocial predictors.
 |
 |
 |
 |
Received July 20, 2003; revision received Oct. 7, 2003; accepted Oct. 9, 2003. From the Neuroscience Program, SRI International; the Department of Psychiatry and Behavioral Sciences, Stanford University School of Medicine, Stanford, Calif.; and the University of Michigan School of Medicine, Ann Arbor. Address reprint requests to Dr. Pfefferbaum, Neuroscience Program, SRI International, 333 Ravenswood Ave., Menlo Park, CA 94025; [email protected] (e-mail). Supported by grants from the National Institute on Alcohol Abuse and Alcoholism (AA-05965, AA-10723, AA-12388, and AA-12999). The authors thank the research assistants and laboratory scientists who collected and scored these data.

Figure 1. Change in Hematological Values Between Study Entry and Treatment Completion in Relation to Change in Volume of Lateral Ventricles in 58 Alcoholic Subjectsa
aPositive values for hematocrit, hemoglobin level, and RBC count and negative values for mean corpuscular volume and ventricular volume reflect improvements with sobriety. Associations remained significant even after exclusion of one outlier.
br=0.35, p=0.01.
cr=0.34, p=0.01.
dr=0.40, p=0.003.
er=0.19, n.s.
1. Watanabe A: Cerebral changes in hepatic encephalopathy. J Gastroenterol Hepatol 1998; 13:752–760Crossref, Medline, Google Scholar
2. Tarter RE, Hays AL, Sandford SS, Van Thiel DH: Cerebral morphological abnormalities associated with non-alcoholic cirrhosis. Lancet 1986; 2:893–895Crossref, Medline, Google Scholar
3. Katzman DK, Christensen B, Young AR, Zipursky RB: Starving the brain: structural abnormalities and cognitive impairment in adolescents with anorexia nervosa. Semin Clin Neuropsychiatry 2001; 6:146–152Crossref, Medline, Google Scholar
4. Kerem NC, Katzman DK: Brain structure and function in adolescents with anorexia nervosa. Adolesc Med 2003; 14:109–118Medline, Google Scholar
5. Swayze VW II, Andersen AE, Andreasen NC, Arndt S, Sato Y, Ziebell S: Brain tissue volume segmentation in patients with anorexia nervosa before and after weight normalization. Int J Eat Disord 2003; 33:33–44Crossref, Medline, Google Scholar
6. Acker W, Aps EJ, Majumdar SK, Shaw GK, Thomson AD: The relationship between brain and liver damage in chronic alcoholic patients. J Neurol Neurosurg Psychiatry 1982; 45:984–987Crossref, Medline, Google Scholar
7. Pfefferbaum A, Rosenbloom MJ, Crusan K, Jernigan TL: Brain CT changes in alcoholics: the effects of age and alcohol consumption. Alcohol Clin Exp Res 1988; 12:81–87Crossref, Medline, Google Scholar
8. Nicolas JM, Fernandez-Sola J, Robert J, Antunez E, Cofan M, Cardenal C, Sacanella E, Estruch R, Urbano-Marquez A: High ethanol intake and malnutrition in alcoholic cerebellar shrinkage. QJM 2000; 93:449–456Crossref, Medline, Google Scholar
9. Walker JT, Shen J, Momenan R, Hommer D: Brain volume shrinkage and common lab values in alcoholics (abstract). Alcohol Clin Exp Res 2003; 27:22ACrossref, Google Scholar
10. Allen JP: Use of biomarkers of heavy drinking in health care practice. Mil Med 2003; 168:364–367Crossref, Medline, Google Scholar
11. Pfefferbaum A, Lim KO, Zipursky RB, Mathalon DH, Lane B, Ha CN, Rosenbloom MJ, Sullivan EV: Brain gray and white matter volume loss accelerates with aging in chronic alcoholics: a quantitative MRI study. Alcohol Clin Exp Res 1992; 16:1078–1089Crossref, Medline, Google Scholar
12. Pfefferbaum A, Sullivan EV, Mathalon DH, Shear PK, Rosenbloom MJ, Lim KO: Longitudinal changes in magnetic resonance imaging brain volumes in abstinent and relapsed alcoholics. Alcohol Clin Exp Res 1995; 19:1177–1191Crossref, Medline, Google Scholar
13. Connors GJ, Maisto SA, Donovan DM: Conceptualizations of relapse: a summary of psychological and psychobiological models. Addiction 1996; 91:S5-S13Google Scholar
14. Spitzer RL, Endicott J, Robins E: Research Diagnostic Criteria (RDC) for a Selected Group of Functional Disorders, 2nd ed. New York, New York State Psychiatric Institute, Biometrics Research, 1975Google Scholar
15. Skinner HA: Development and Validation of a Lifetime Alcohol Consumption Assessment Procedure. Toronto, Addiction Research Foundation, 1982Google Scholar
16. Skinner HA, Sheu WJ: Reliability of alcohol use indices: the lifetime drinking history and the MAST. J Stud Alcohol 1982; 43:1157–1170Crossref, Medline, Google Scholar
17. Pfefferbaum A, Mathalon DH, Sullivan EV, Rawles JM, Zipursky RB, Lim KO: A quantitative magnetic resonance imaging study of changes in brain morphology from infancy to late adulthood. Arch Neurol 1994; 51:874–887Crossref, Medline, Google Scholar
18. Sullivan EV, Marsh L, Mathalon DH, Lim KO, Pfefferbaum A: Age-related decline in MRI volumes of temporal lobe gray matter but not hippocampus. Neurobiol Aging 1995; 16:591–606Crossref, Medline, Google Scholar
19. Lim KO, Pfefferbaum A: Segmentation of MR brain images into cerebrospinal fluid spaces, white and gray matter. J Comput Assist Tomogr 1989; 13:588–593Crossref, Medline, Google Scholar
20. Mathalon DH, Sullivan EV, Rawles JM, Pfefferbaum A: Correction for head size in brain-imaging measurements. Psychiatry Res Neuroimaging 1993; 50:121–139Crossref, Medline, Google Scholar
21. Pfefferbaum A, Sullivan EV, Rosenbloom MJ, Mathalon DH, Lim KO: A controlled study of cortical gray matter and ventricular changes in alcoholic men over a five year interval. Arch Gen Psychiatry 1998; 55:905–912Crossref, Medline, Google Scholar
22. Cohen JA, Kaplan MM: The SGOT/SGPT ratio—an indicator of alcoholic liver disease. Digest Dis Sci 1979; 24:835–838Crossref, Medline, Google Scholar
23. Maruyama S, Hirayama C, Yamamoto C, Koda M, Udagawa A, Kadowaki Y, Inoue M, Sagayama A, Umeki K: Red blood cell status in alcoholic and non-alcoholic liver disease. J Lab Clin Med 2001; 138:332–337Crossref, Medline, Google Scholar
24. Penninx BW, Guralnik JM, Onder G, Ferrucci L, Wallace RB, Pahor M: Anemia and decline in physical performance among older persons. Am J Med 2003; 115:104–110Crossref, Medline, Google Scholar