Low-Field Magnetic Stimulation in Bipolar Depression Using an MRI-Based Stimulator
Abstract
OBJECTIVE: Anecdotal reports have suggested mood improvement in patients with bipolar disorder immediately after they underwent an echo-planar magnetic resonance spectroscopic imaging (EP-MRSI) procedure that can be performed within clinical MR system limits. This study evaluated possible mood improvement associated with this procedure. METHOD: The mood states of subjects in an ongoing EP-MRSI study of bipolar disorder were assessed by using the Brief Affect Scale, a structured mood rating scale, immediately before and after an EP-MRSI session. Sham EP-MRSI was administered to a comparison group of subjects with bipolar disorder, and actual EP-MRSI was administered to a comparison group of healthy subjects. The characteristics of the electric fields generated by the EP-MRSI scan were analyzed. RESULTS: Mood improvement was reported by 23 of 30 bipolar disorder subjects who received the actual EP-MRSI examination, by three of 10 bipolar disorder subjects who received sham EP-MRSI, and by four of 14 healthy comparison subjects who received actual EP-MRSI. Significant differences in mood improvement were found between the bipolar disorder subjects who received actual EP-MRSI and those who received sham EP-MRSI, and, among subjects who received actual EP-MRSI, between the healthy subjects and the bipolar disorder subjects and to a lesser extent between the unmedicated bipolar disorder subjects and the bipolar disorder subjects who were taking medication. The electric fields generated by the EP-MRSI scan were smaller (0.7 V/m) than fields used in repetitive transcranial magnetic stimulation (rTMS) treatment of depression (1–500 V/m) and also extended uniformly throughout the head, unlike the highly nonuniform fields used in rTMS. The EP-MRSI waveform, a 1-kHz train of monophasic trapezoidal gradient pulses, differed from that used in rTMS. CONCLUSIONS: These preliminary data suggest that the EP-MRSI scan induces electric fields that are associated with reported mood improvement in subjects with bipolar disorder. The findings are similar to those for rTMS depression treatments, although the waveform used in EP-MRSI differs from that used in rTMS. Further investigation of the mechanism of EP-MRSI is warranted.
Existing treatment approaches for bipolar disorder utilize primarily pharmacologic agents, such as lithium, valproic acid, and antipsychotic and antidepressant drugs, that sometimes are of limited efficacy and may have objectionable side effects. ECT is usually effective as a treatment for bipolar disorder, but it involves general anesthesia and some degree of memory loss, and its effects can be transient. Repetitive transcranial magnetic stimulation (rTMS), initially developed to test gross central nervous system function, more recently has been applied with some success in the treatment of depression (1–5). The success of rTMS in the treatment of depression has been varied and has been described in a recent review as “often statistically significant [but] below the threshold of clinical usefulness” (1). rTMS treatment can be unpleasant, with some patients declining participation due to scalp pain induced by the apparatus (6). It also carries a small risk of seizure (7).
McLean Hospital Brain Imaging Center is conducting several ongoing proton echo-planar magnetic resonance spectroscopic imaging (EP-MRSI) studies of subjects with bipolar disorder. These studies employ oscillating magnetic fields that are similar to those used in functional magnetic resonance imaging (fMRI) but that differ from the usual fMRI scan in field direction, waveform frequency, and strength. After the serendipitous observation of mood improvement during EP-MRSI studies of depressed subjects with bipolar disorder, we obtained clinical data of such mood changes systematically and prospectively.
In the study reported here, we tested the hypothesis that the EP-MRSI scan has mood-enhancing effects in subjects with bipolar disorder, compared to sham EP-MRSI in bipolar disorder subjects and the EP-MRSI scan in healthy subjects. We propose that this effect is caused by the time-varying gradient magnetic fields of the EP-MRSI scan and not by the static main magnetic field in the MRI system.
Method
Subjects
The study subjects were patients with bipolar disorder who participated in any of three studies at the McLean Hospital Brain Imaging Center and who shared the same EP-MRSI scan prescription and clinical interview scheme. These studies were investigating the effects of conventional and nonconventional (omega-3 fatty acid supplements) therapies on mood and brain chemistry over a period of time and included monthly EP-MRSI scans and clinical interviews. These studies used the results of the EP-MRSI scan and clinical rating scales to evaluate the effects of specific medication interventions; subjects were blinded to the hypothesis that the EP-MRSI exam itself was being investigated for correlation with mood change. Subjects in the three source studies came in for multiple visits, and many had changes in medication as a part of a study. To reduce confounds arising from different study-specific treatment interventions, we examined results from only the first visit by these subjects.
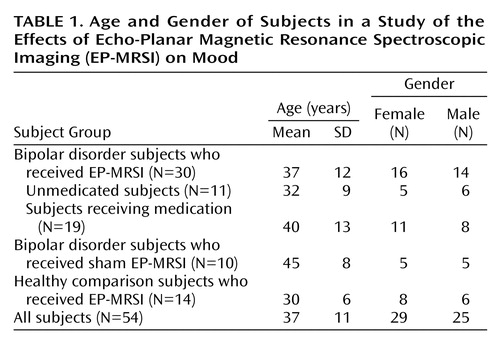
The subjects with bipolar disorder had a diagnosis of bipolar I disorder or bipolar II disorder and were between ages 18 and 65 years. They either were currently receiving a course of medication, including lithium, divalproex sodium, and other anticonvulsants, or were unmedicated at the start of the study. Subjects who were given anxiolytic medication during the scan sessions or who were taking medication in addition to those listed in the previous sentence were not considered in this study. Thirty (16 women and 14 men) subjects with bipolar disorder received EP-MRSI scans; 11 of those subjects were unmedicated. Ten (five women and five men) subjects with bipolar disorder received sham EP-MRSI scans; two of those subjects were unmedicated. Fourteen (eight women and six men) healthy subjects received actual EP-MRSI scans. The subjects’ demographic characteristics are summarized in Table 1.
Although no explicit blinding procedures were used in this study, all subjects were participating in ongoing medication studies and were not aware that the EP-MRSI evaluation itself was being investigated for mood effects; subjects could not tell the difference between the sham and the actual EP-MRSI procedure and were blinded to this aspect of the study. The rater was not blinded to the treatment conditions.
Written informed consent was obtained from all subjects, and the study protocols were approved by the McLean Hospital Institutional Review Board.
Clinical Ratings
On the basis of anecdotal reports that subjects were experiencing enhanced mood after the EP-MRSI scanning session, an additional rating scale, the Brief Affect Scale (A. L. Stoll, personal communication, 2001), was added to the study. The original Brief Affect Scale was a nine-item scale designed for a past study of mood lability in patients with bipolar disorder conducted by one of the authors (A.L.S.). Each item measured the severity of a specific symptom at the time the subject completed the scale. For the present study, the Brief Affect Scale was modified to include only one item measuring mood, specifically depression. In addition, instead of being asked to indicate depression severity in the moment, the subjects were asked how much, if any, their mood had improved or worsened since they last filled out the form. The subjects provided their responses on a 7-point scale, as follows: 3, very much improved; 2, much improved; 1, minimally improved; 0, no change; –1, minimally worse; –2, much worse; and –3, very much worse. These numerically ranked responses were grouped into the categories of improved (3 to 1), same (0), and worse (–1 to –3) for statistical treatment. This grouping is referred to as the ordinal Brief Affect Scale ratings.
The modified Brief Affect Scale was administered to all subjects immediately before and after the EP-MRSI scanning session, and the difference in the mood ratings before and after the scan was the primary outcome measure. In addition, at each visit, the 17-item Hamilton Depression Rating Scale (8) and the Young Mania Rating Scale (9) were administered. All Hamilton depression scale, Young Mania Rating Scale, and Brief Affect Scale ratings were administered by the same research assistant.
A small validity study was performed for the original Brief Affect Scale. To determine a “gold standard” measurement of depression, an experienced psychiatric clinician-researcher (A.L.S.) rated the severity of depression in nine subjects with bipolar disorder. These subjects had a wide range of symptoms, with some experiencing mania or mixed states, while others were depressed. This “gold standard” rating was compared to a Brief Affect Scale rating simultaneously obtained by a research assistant. The correlation of the “gold standard” depression rating with the depression rating on the Brief Affect Scale was very strong (r=0.90, df=8, p=0.0008). In addition, a “gold standard” mania rating in these nine subjects was compared to the depression rating on the Brief Affect Scale. There was little or no correlation (r=0.25, df=8, n.s.), indicating some degree of specificity for the Brief Affect Scale depression item and supporting the validity of the Brief Affect Scale.
EP-MRSI Methods
The studies were conducted at the McLean Hospital Brain Imaging Center. Scanning was performed on a General Electric 1.5-T Signa MRI scanner (5.8 EchoSpeed version) (GE Medical Systems, Milwaukee). Four EP-MRSI scans were acquired for each patient at each clinic visit. The EP-MRSI pulse sequence has been extensively described (10). The complete MR examination consisted of a conventional double-echo spin-echo T2 scan, four EP-MRSI scans totaling 20.5 minutes, a T1 anatomic scan, and an echo-planar T2 imaging acquisition; the entire study took about 1 hour. The sham EP-MRSI examination was identical to the actual examination, except that the EP-MRSI scans were replaced with a 15-minute three-dimensional spoiled gradient echo scan so that the duration of the sham EP-MRSI examination was the same as that of the actual EP-MRSI examination.
EP-MRSI Electromagnetic Fields
The characteristics of the electromagnetic fields of EP-MRSI can be further illustrated by comparing the fields of EP-MRSI with those of rTMS. EP-MRSI and rTMS both subject the brain to time-varying magnetic and electric fields. The fields in the EP-MRSI experiment are very different from those in rTMS in strength, uniformity, direction, and timing. It is noteworthy that the EP-MRSI fields are 100 to 1,000 times weaker than the rTMS fields, penetrate throughout the whole brain, and are delivered at 1 kHz.
The EP-MRSI magnetic field of interest is the readout gradient. This magnetic field is delivered in a series of 512 trapezoid pulses that are each 1 msec long, as Figure 1 shows. The series of 512 pulses is repeated every 2 seconds for 128 repetitions (4 minutes) for each scan; in our study this scan was performed four times in each examination. The magnetic field is an MRI gradient field with the form of a linear ramp, with a zero field in the middle of the coil and a ramp of 0.3 gauss/cm (G/cm) that reaches a maximum of less than 10 G in the brain. The electric field for EP-MRSI consists of a series of alternating square pulses that are each about 0.25 msec long and that occur at 1 kHz. This waveform is shown in Figure 1. The electric field is constant during each pulse. The strength of the electric field is about 0.7 V/m, is uniform to 5%, and is in the direction of the subject’s right to left. A contour plot of the electric field magnitude is shown in Figure 2.
In contrast, the fields in rTMS are produced by a small coil some inches across and are large and nonuniform. The rTMS magnetic field is delivered in single-cycle sine pulses with a period of about 0.28 msec at 1–20 Hz for 20 minutes (J. Cadwell, personal communication, 2002). The rTMS magnetic field pulse waveform is shown in Figure 1. rTMS magnetic fields have strengths up to 2 T (20,000 G) (11) at locations in the cortex falling off to less than 10 G at a distance of 20 cm away. The rTMS electric field consists of single-cycle cosine pulses with the same 0.28-msec period, at 1–20 Hz, similar to the magnetic field pulses. The electric field reverses sign during each pulse. This waveform is shown in Figure 1. The strength of the rTMS electric field ranges from more than 500 V/m in the cortex under the coil to 1 V/m 20 cm away. This electric field is highly nonuniform, and it has no well-defined direction in the brain (12–14). A contour plot of the rTMS electric field strength is shown in Figure 2. It is noteworthy that the distribution of the rTMS field in the head depends greatly on the position of the coil; for EP-MRSI, head position is less significant.
Statistical Methods
Ordered logistic regression modeling methods were used to examine the differences in Brief Affect Scale scores among the study groups. Robust estimators of standard errors were obtained. Data were summarized as means and standard deviations or as means with 95% confidence intervals. Two-sided significance tests, requiring p<0.05 for statistical significance, were employed. The statistical software systems that were used included Statview (SAS Institute, Inc., Cary, N.C.) and Stata (Stata Corp., College Station, Tex.).
Results
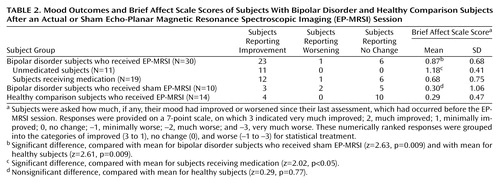
Twenty-three of 30 subjects with bipolar disorder reported improvement in mood of at least 1 point on the Brief Affect Scale after the EP-MRSI examination. No change was reported by six subjects, and a worsening of mood was reported by one subject. Among the subjects with bipolar disorder who received actual EP-MRSI, 11 of 11 unmedicated subjects reported improvement in mood, compared with 12 of 19 subjects who were taking mood-stabilizing medication. Three of the 10 subjects with bipolar disorder who received sham EP-MRSI reported improvement in mood after the examination, two reported worsening in mood, and five reported no change. Four of the 14 healthy comparison subjects reported improvement in mood after the EP-MRSI examination, no subjects reported worsening of mood, and 10 reported no change.
We assessed the significance of acute mood change measured with the Brief Affect Scale and examined differences among the three subject groups. For statistical treatment we used the ordinal Brief Affect Scale ratings because they provided a more conservative scale (Table 2).
The ordinal Brief Affect Scale ratings of the subjects with bipolar disorder who received actual EP-MRSI (N=30, mean Brief Affect Scale=0.87, SD=0.68) were compared with those of the bipolar disorder subjects who received sham EP-MRSI (N=10, mean Brief Affect Scale=0.30, SD=1.06) by using ordered logistic regression methods; this difference was statistically significant (z=2.63, p=0.009). The higher Brief Affect Scale scores in the bipolar disorder subjects who received actual EP-MRSI indicate greater perceived mood improvement in this group, compared to the bipolar disorder subjects who received sham EP-MRSI.
Among the bipolar disorder subjects who received actual EP-MRSI, those who were unmedicated (N=11) had higher Brief Affect Scale scores (mean=1.18, SD=0.41) than those who were taking medication (N=19) (mean=0.68, SD=0.75). This difference was statistically significant (z=2.02, p<0.05).
The mean ordinal Brief Affect Scale rating of the subjects with bipolar disorder who received actual EP-MRSI was compared with that of the healthy subjects, who also received actual EP-MRSI (mean=0.29, SD=0.47); this difference was also statistically significant (z=2.61, p=0.009). The contrast in mean ratings between the subjects with bipolar disorder who received sham EP-MRSI and the healthy subjects, who received actual EP-MRSI, was not significant (z=0.29, p=0.77).
Discussion
We found significant improvement of mood in subjects with bipolar disorder after EP-MRSI scans. This change was absent in bipolar disorder subjects who had sham EP-MRSI scans and was also absent in healthy subjects who had actual EP-MRSI scans. A greater effect was evident in unmedicated subjects with bipolar disorder.
This prospective pilot study had a number of limitations. A change in the study facility’s MRI system during the course of the study and a corresponding suspension in EP-MRSI examinations limited the size of the group receiving sham EP-MRSI. Although data from several visits were available for some subjects, medication changes over time were confounded with changes associated with EP-MRSI scans, so that the analyses reported here were limited to data for the first visit. Also, the serendipitous use of existing study groups may be considered a limitation. The consistent and statistically significant rates of reported mood improvement, however, suggest that a significant neurobiological effect was present.
The immediate improvement shown in the Brief Affect Scale scores of the subjects with bipolar disorder, 77% of whom responded, indicates a surprising response to this treatment, particularly among the unmedicated subjects (100% of whom responded), compared with the subjects who were taking medication (63% of whom responded) and those who received sham EP-MRSI (30% of whom responded). Studies of rTMS treatments for depression typically show a response rate of 40%–50% (responders in these studies had a reduction of >50% in Hamilton depression scale scores) or a change of 50% or more in mean Hamilton depression scale scores (15–24). The overall proportion of responders for EP-MRSI in our study was greater, but the characteristics of the two types of studies make comparisons difficult. rTMS treatments generally include 2 weeks of daily treatments, and the results are measured by the change in Hamilton depression scale scores over that period; the effects of the EP-MRSI examination described here were measured with a different scale (the Brief Affect Scale) over the course of a day, and a single EP-MRSI treatment was used owing to the exploratory nature of this study.
A placebo effect is thought to be unlikely because the subjects were not aware that the EP-MRSI examination itself was being tested for mood effects. Although follow-up data were not systematically obtained, this effect was reported by some subjects to endure for days. The relative lack of mood improvement in healthy subjects who had EP-MRSI examinations (29% of healthy subjects responded) is consistent with results in rTMS studies (25).
The mood improvement effect we report here seems specific to the EP-MRSI examination used in this study; it appeared on the introduction of the EP-MRSI examination and was so noticeable in the first two subjects who underwent the procedure that we decided to organize this study to evaluate the effect more systematically by using the Brief Affect Scale as an objective clinical assessment. McLean Hospital is a psychiatric hospital and has performed more than 10,000 MRI and echo-planar imaging MRI examinations of psychiatric subjects over the last 10 years, before the use of the EP-MRSI examination, without observing a similar effect. The EP-MRSI gradient fields constitute the outstanding difference, compared to the previous MRI examinations.
Contrast can be made with rTMS in seeking a likely mechanism of action. While the presence of electromagnetic fields suggests a similar mechanism in the two procedures, the disparity in field strength and in the distribution of the fields may indicate a different mechanism. In particular, the discussion of rTMS involving ECT-like seizure or subthreshold seizure mechanisms (5) would seem to be inapplicable to this study. The uniformity, unidirectionality, and whole-brain penetration of the EP-MRSI treatment may be selecting very different structures in the brain, compared with rTMS. An intriguing possibility is that the right-to-left electric fields in EP-MRSI could be selecting the corpus callosum, whose axons lie in that direction. A final point of comparison with rTMS is the characteristics of the electric field pulses themselves. Given that neuronal conduction processes occur on millisecond time scales, we hypothesize that the monophasic pulses delivered at 1 kHz in this EP-MRSI system, which are on the same time scale as neuronal processes, may interact with these processes, particularly with conduction processes that have time constants greater than 1 msec, differently than the biphasic pulses delivered by rTMS at 1–20 Hz.
There were no adverse effects to this treatment. The EP-MRSI sequence operates well within U.S. Food and Drug Administration clearance values for MRI gradient fields and is free of the discomfort and seizure concerns associated with rTMS studies.
We propose that the effect noted here depends only on the time-varying magnetic and electric fields discussed here and is not linked to the static main field of the magnet in MRI. Further studies with a table-top, head-sized system that is free of the MRI system but that provides the time-varying electromagnetic fields discussed here are under way.
Conclusions
These preliminary data suggest that the EP-MRSI scan induces electric fields that are associated with reported mood improvement in subjects with bipolar disorder. Overall response rates to the EP-MRSI scan were consistent with rates reported in current rTMS depression treatment trials. The rate of mood improvement associated with EP-MRSI was much higher for unmedicated subjects with bipolar disorder than for bipolar disorder subjects who were receiving medication. As expected, there were markedly lower response rates in healthy subjects, compared with subjects with bipolar disorder. EP-MRSI shares these response characteristics with rTMS depression treatments. These data suggest that further investigation into possible shared mechanisms is warranted. The study results suggest that antidepressant effects could be elicited with more uniform, deeply penetrating magnetic and electric fields and different timing parameters than those previously used in rTMS. Thus, optimal magnetic stimulation treatment for depression may call for a different apparatus and a different approach than those previously used and may include designs that provide fields deep within the brain in addition to fields at the cortical surface. The achievement of results comparable to rTMS with a reduced electric field suggests that the timing parameters of EP-MRSI may be more suited to deep stimulation.
 |
 |
Received June 20, 2002; revision received May 13, 2003; accepted May 19, 2003. From the Brain Imaging Center, McLean Hospital; the Department of Psychiatry, Massachusetts General Hospital, Boston; the Department of Psychiatry, Harvard Medical School, Boston; and the Departments of Radiology and Bioengineering, University of Washington School of Medicine, Seattle. Address reprint requests to Dr. Rohan, McLean Hospital, 115 Mill St., Belmont, MA 02478; [email protected] (e-mail). Supported in part by NIMH grant MH-58681, the Poitras Foundation, the Stanley Foundation Bipolar Disorders Research Center at McLean Hospital, and gifts from John and Virginia Taplin.

Figure 1. Magnetic Field and Electric Field Waveforms Generated by Echo-Planar Magnetic Resonance Spectroscopic Imaging (EP-MRSI) and Repetitive Transcranial Magnetic Stimulation (rTMS)a
aThe EP-MRSI magnetic field (upper left panel) consists of 512 alternating trapezoids, each 1.024 msec long, repeated every 2 seconds for 4 minutes; EP-MRSI magnetic fields range from 6 gauss (G) to 0 G in the head. The rTMS magnetic field (upper right panel) is a single-cycle sine pulse with a period of 0.28 msec, repeated at 20 Hz to 1 Hz; rTMS magnetic fields range from 20,000 G to 10 G in the head. The EP-MRSI electric field (lower left panel) is a series of 512 alternating square pulses, each 0.256 msec long; the series is repeated every 2 seconds for 4 minutes. The rTMS electric field (lower right panel) is a single-cycle cosine pulse with a period of 0.28 msec, repeated at 20 Hz to 1 Hz. Note that the scales of measure for the two magnetic field magnitudes and for the two electric field magnitudes are different.

Figure 2. Electric Field Magnitude Contour Plots for Echo-Planar Magnetic Resonance Spectroscopic Imaging (EP-MRSI) and Repetitive Transcranial Magnetic Stimulation (rTMS)a
aEach contour plot represents a 20-cm field of view in a representative coronal plane in the head. Contours of different colors show order of magnitude of the electric field strength. Green contours show electric fields less than 1 V/m at intervals of 0.01 V/m (these contours are not shown for the rTMS plot), blue contours show fields between 1 and 10 V/m at 1-V/m intervals, and red contours show fields between 10 and 50 V/m at intervals of 10 V/m. Fields greater than 50 V/m are not shown; fields in the rTMS coil exceed 500 V/m in the 1–2 cm surrounding the coil. rTMS contours were obtained by modeling the rTMS coil as a figure eight made of two 4-cm diameter loops that were tangent and coplanar in relation to each other. The loops are placed at a 45° angle and are shown as a thick diagonal line. The rTMS coil was modeled with 60,000 Amp-turns, producing a magnetic field of 20,000 G at a distance of 1 cm from the tangent point.
1. Wassermann EM, Lisanby SH: Therapeutic application of repetitive transcranial magnetic stimulation: a review. Clin Neurophysiol 2001; 112:1367–1377Crossref, Medline, Google Scholar
2. McNamara B, Ray JL, Arthurs OJ, Boniface S: Transcranial magnetic stimulation for depression and other psychiatric disorders. Psychol Med 2001; 31:1141–1146Crossref, Medline, Google Scholar
3. Martin JL, Barbanoj MJ, Schlaepfer TE, Clos S, Perez V, Kulisevsky J, Gironell A: Transcranial magnetic stimulation for treating depression. Cochrane Database Syst Rev 2002; 2:CD003493Google Scholar
4. Holtzheimer PE III, Russo J, Avery DH: A meta-analysis of repetitive transcranial magnetic stimulation in the treatment of depression. Psychopharmacol Bull 2001; 35:149–169Medline, Google Scholar
5. Lisanby SH: Focal brain stimulation with repetitive transcranial magnetic stimulation (rTMS): implications for the neural circuitry of depression. Psychol Med 2003; 33:7–13Crossref, Medline, Google Scholar
6. George MS, Nahas Z, Molloy M, Speer AM, Oliver NC, Li XB, Arana GW, Risch SC, Ballenger JC: A controlled trial of daily left prefrontal cortex TMS for treating depression. Biol Psychiatry 2000; 48:962–970Crossref, Medline, Google Scholar
7. Wassermann EM: Risk and safety of repetitive transcranial magnetic stimulation: report and suggested guidelines from the International Workshop on the Safety of Repetitive Transcranial Magnetic Stimulation, June 5–7, 1996. Electroencephalogr Clin Neurophysiol 1998; 108:1–16Crossref, Medline, Google Scholar
8. Hamilton M: A rating scale for depression. J Neurol Neurosurg Psychiatry 1960; 23:56–62Crossref, Medline, Google Scholar
9. Young RC, Biggs JT, Ziegler VE, Meyer DA: A rating scale for mania: reliability, validity and sensitivity. Br J Psychiatry 1978; 133:429–435Crossref, Medline, Google Scholar
10. Posse S, Dager SR, Richards TL, Yuan C, Ogg R, Artru AA, Muller-Gartner HW, Hayes C: In vivo measurement of regional brain metabolic response to hyperventilation using magnetic resonance: proton echo planar spectroscopic imaging (PEPSI). Magn Reson Med 1997; 37:858–865Crossref, Medline, Google Scholar
11. Keck ME, Welt T, Post A, Muller MB, Toschi N, Wigger A, Landgraf R, Holsboer F, Engelmann M: Neuroendocrine and behavioral effects of repetitive transcranial magnetic stimulation in a psychopathological animal model are suggestive of antidepressant-like effects. Neuropsychopharmacology 2001; 24:337–349Crossref, Medline, Google Scholar
12. Roth BJ, Saypol JM, Hallett M, Cohen LG: A theoretical calculation of the electric field induced in the cortex during magnetic stimulation. Electroencephalogr Clin Neurophysiol 1991; 81:47–56Crossref, Medline, Google Scholar
13. Cerri G, De Leo R, Moglie F, Schiavoni A: An accurate 3-D model for magnetic stimulation of the brain cortex. J Med Eng Technol 1995; 19:7–16Crossref, Medline, Google Scholar
14. Ravazzani P, Ruohonen J, Grandori F, Tognola G: Magnetic stimulation of the nervous system: induced electric field in unbounded, semi-infinite, spherical, and cylindrical media. Ann Biomed Eng 1996; 24:606–616Crossref, Medline, Google Scholar
15. Geller V, Grisaru N, Abarbanel JM, Lemberg T, Belmaker RH: Slow magnetic stimulation of prefrontal cortex in depression and schizophrenia. Prog Neuropsychopharmacol Biol Psychiatry 1997; 21:105–110Crossref, Medline, Google Scholar
16. Feinsod M, Kreinin B, Chistyakov A, Klein E: Preliminary evidence for a beneficial effect of low-frequency, repetitive transcranial magnetic stimulation in patients with major depression and schizophrenia. Depress Anxiety 1998; 7:65–68Crossref, Medline, Google Scholar
17. Padberg F, Zwanzger P, Thoma H, Kathmann N, Haag C, Greenberg BD, Hampel H, Moller HJ: Repetitive transcranial magnetic stimulation (rTMS) in pharmacotherapy-refractory major depression: comparative study of fast, slow and sham rTMS. Psychiatry Res 1999; 88:163–171Crossref, Medline, Google Scholar
18. Teneback CC, Nahas Z, Speer AM, Molloy M, Stallings LE, Spicer KM, Risch SC, George MS: Changes in prefrontal cortex and paralimbic activity in depression following two weeks of daily left prefrontal TMS. J Neuropsychiatry Clin Neurosci 1999; 11:426–435Medline, Google Scholar
19. Triggs WJ, McCoy KJ, Greer R, Rossi F, Bowers D, Kortenkamp S, Nadeau SE, Heilman KM, Goodman WK: Effects of left frontal transcranial magnetic stimulation on depressed mood, cognition, and corticomotor threshold. Biol Psychiatry 1999; 45:1440–1446Crossref, Medline, Google Scholar
20. Berman RM, Narasimhan M, Sanacora G, Miano AP, Hoffman RE, Hu XS, Charney DS, Boutros NN: A randomized clinical trial of repetitive transcranial magnetic stimulation in the treatment of major depression. Biol Psychiatry 2000; 47:332–337Crossref, Medline, Google Scholar
21. Grunhaus L, Dannon PN, Schreiber S, Dolberg OH, Amiaz R, Ziv R, Lefkifker E: Repetitive transcranial magnetic stimulation is as effective as electroconvulsive therapy in the treatment of nondelusional major depressive disorder: an open study. Biol Psychiatry 2000; 47:314–324Crossref, Medline, Google Scholar
22. Garcia-Toro M, Pascual-Leone A, Romera M, Gonzalez A, Mico J, Ibarra O, Arnillas H, Capllonch I, Mayol A, Tormos JM: Prefrontal repetitive transcranial magnetic stimulation as add on treatment in depression. J Neurol Neurosurg Psychiatry 2001; 71:546–548Crossref, Medline, Google Scholar
23. Loo CK, Mitchell PB, Croker VM, Malhi GS, Wen W, Gandevia SC, Sachdev PS: Double-blind controlled investigation of bilateral prefrontal transcranial magnetic stimulation for the treatment of resistant major depression. Psychol Med 2003; 33:33–40Crossref, Medline, Google Scholar
24. Padberg F, Zwanzger P, Keck ME, Kathmann N, Mikhaiel P, Ella R, Rupprecht P, Thoma H, Hampel H, Toschi N, Moller HJ: Repetitive transcranial magnetic stimulation (rTMS) in major depression: relation between efficacy and stimulation intensity. Neuropsychopharmacology 2002; 27:638–645Crossref, Medline, Google Scholar
25. Mosimann UP, Rihs TA, Engeler J, Fisch H, Schlaepfer TE: Mood effects of repetitive transcranial magnetic stimulation of left prefrontal cortex in healthy volunteers. Psychiatry Res 2000; 94:251–256Crossref, Medline, Google Scholar