Differential Brain Metabolic Predictors of Response to Paroxetine in Obsessive-Compulsive Disorder Versus Major Depression
Abstract
OBJECTIVE: Serotonin reuptake inhibitor (SRI) medications are effective in the treatment of both major depressive disorder and obsessive-compulsive disorder (OCD), but it is unknown whether the neural substrates of treatment response for the two disorders are the same or different. The authors sought to identify pretreatment cerebral glucose metabolic markers of responsiveness to SRI treatment in patients with OCD versus major depressive disorder and to determine whether the pretreatment patterns associated with improvement of OCD symptoms were the same as or different from those associated with improvement of major depressive disorder symptoms. METHOD: [18F]Fluorodeoxyglucose positron emission tomography was used to measure cerebral glucose metabolism in 27 patients with OCD alone, 27 with major depressive disorder alone, and 17 with concurrent OCD and major depressive disorder, who were all then treated with 30–60 mg/day of paroxetine for 8–12 weeks. Correlations were calculated between pretreatment regional metabolism and pre- to posttreatment changes in the severity of OCD symptoms, depressive symptoms, and overall functioning. RESULTS: While improvement of OCD symptoms was significantly correlated with higher pretreatment glucose metabolism in the right caudate nucleus (partial r=–0.53), improvement of major depressive disorder symptoms was significantly correlated with lower pretreatment metabolism in the amygdala (partial r=0.71) and thalamus (partial r=0.34) and with higher pretreatment metabolism in the medial prefrontal cortex and rostral anterior cingulate gyrus (Talairach coordinates: x=0, y=62, z=10) (z=2.91). CONCLUSIONS: These findings suggest that, although both OCD and major depressive disorder respond to SRIs, the two syndromes have different neurobiological substrates for response. Elevated activity in the right caudate may be a marker of responsiveness to antiobsessional treatment, while lower right amygdala activity and higher midline prefrontal activity may be required for response of depressive symptoms to treatment.
Serotonin reuptake inhibitors (SRIs) are effective in the treatment of several psychiatric disorders, including major depressive disorder and obsessive-compulsive disorder (OCD), but the degree of response to these medications varies greatly among patients. Approximately one-third of patients with major depressive disorder (1) and half of patients with OCD (2) do not have an adequate response to SRIs. Therefore, identification of reliable predictors of responsiveness to SRIs could potentially save patients lengthy trials of medications that are unlikely to be effective and steer treatment toward modalities that have higher probabilities of succeeding. Markers of treatment responsiveness might also provide further clues to the pathophysiology of OCD and major depressive disorder.
Many methods have been employed to investigate neurobiological predictors of response to antidepressant medications in OCD and major depressive disorder, including neurotransmitter and receptor assays (3–8), neuroendocrine challenge tests (9–13), neurocognitive testing (14, 15), auditory evoked potentials (16), quantitative electroencephalography (17–20), and pharmacogenetics (21–23). Unfortunately, few of these findings have been replicated, and none have localized specific neuroanatomical substrates for treatment response. Neuroimaging studies, however, have identified pretreatment functional neuroanatomical markers of treatment responsiveness, particularly for SRIs.
Swedo et al. (24) found that OCD patients who responded to clomipramine had lower pretreatment absolute glucose metabolic rates in the right orbitofrontal cortex and right anterior cingulate gyrus, compared with nonresponders. Our group found that pretreatment metabolism in the left orbitofrontal cortex differentially predicted response to fluoxetine versus cognitive behavior therapy in OCD (25). Lower pretreatment left orbitofrontal cortex metabolism significantly correlated with response to fluoxetine, while higher pretreatment left orbitofrontal cortex metabolism correlated with response to cognitive behavior therapy. We also found that lower pretreatment metabolism in the bilateral orbitofrontal cortex significantly correlated with better response to paroxetine (26). Rosenberg et al. (27) found that elevated pretreatment glutamate concentrations in the caudate nucleus were also associated with better response to paroxetine. Taken together, these results suggest that OCD patients with particular patterns of brain metabolism may respond differentially to SRIs versus other types of treatment.
In major depressive disorder, pretreatment activity in the midline prefrontal cortex and anterior cingulate gyrus has repeatedly been associated with treatment outcome, but with divergent results. Elevated pretreatment metabolism in the rostral anterior cingulate gyrus was found in responders to SRIs, tricyclic antidepressants, and bupropion (28), and higher pretreatment glucose metabolism in the left gyrus rectus was correlated with better response to sertraline (29). In contrast, other studies found that lower pretreatment metabolism in the left ventral anterior cingulate gyrus correlated with better antidepressant response to paroxetine in patients with major depressive disorder (30) and that baseline metabolism in the prefrontal cortex, anterior cingulate gyrus, and paralimbic structures was lower in responders to venlafaxine and bupropion (31). Limbic structures may also be involved in responsiveness to antidepressant treatment, as patients with treatment-resistant depression showed higher activity in the hippocampus-amygdala area, compared with patients with non-treatment-resistant depression, in one study (32).
Although these neuroimaging studies provided preliminary clues about the neurobiological diatheses of treatment response in OCD and major depressive disorder, they had important limitations. Most had a small number of subjects, some included subjects treated with several different medications, and others did post hoc comparisons of baseline brain metabolism between groups of “responders” and “nonresponders” that were identified by means of various criteria for response (24, 28, 31). Since treatment studies of OCD and major depressive disorder usually show a continuous range of response to SRIs rather than a bimodal distribution of responders versus nonresponders (2), linear relationships between the degree of symptom improvement and pretreatment activity in specific brain regions may provide clearer evidence that those regions are involved in mediating responsiveness to treatment. To our knowledge, no study has investigated prediction of treatment response across different disorders. Therefore, it has remained unclear whether the neural substrates of treatment response are the same or different among the many psychiatric syndromes that can be ameliorated by SRIs.
As part of a previously described study (33, 34), our group obtained [18F]fluorodeoxyglucose (FDG) positron emission tomography (PET) scans of the brain for 27 patients with OCD alone, 27 with unipolar major depressive disorder alone, and 17 with concurrent OCD and major depressive disorder, before and after 8–12 weeks of treatment with 30–60 mg/day of paroxetine. Although all patients were treated with similar doses of paroxetine for similar durations, pre- to posttreatment cerebral metabolic changes differed significantly between diagnostic groups and between responders and nonresponders (34). For the present study, we analyzed pretreatment, regional glucose metabolic data from these patients. The specific aims of the study were 1) to identify cerebral metabolic patterns that might predict response to SRI treatment in patients with OCD and/or major depressive disorder occurring separately or concurrently, and 2) to determine whether the pretreatment cerebral metabolic patterns associated with improvement of OCD symptoms would be the same as or different from those associated with improvement of major depressive disorder symptoms. We hypothesized that pretreatment glucose metabolism in the orbitofrontal cortex and caudate would predict improvement in OCD symptoms, while pretreatment metabolism in the midline prefrontal cortex and anterior cingulate gyrus would predict improvement in depressive symptoms.
Method
Subjects
This study was carried out under guidelines established by the UCLA Institutional Review Board. Subjects were recruited from the Los Angeles area between 1994 and 1999 by using approved advertisements in flyers, newspapers, and web sites. Written informed consent was obtained from all subjects after the study procedures were fully explained. Seventy-one subjects completed the study: 27 patients with OCD alone, 27 with major depressive disorder alone, and 17 with concurrent OCD and major depressive disorder. Diagnostic classifications according to DSM-IV criteria were made by means of clinical interviews and were confirmed with the Schedule for Affective Disorders and Schizophrenia—Lifetime Versions (35). Symptom severity and level of functioning were rated with the Yale-Brown Obsessive Compulsive Scale (36), the Hamilton Depression Rating Scale (37), and the Global Assessment Scale (GAS) (38), immediately before and after treatment. All diagnostic assessments and administration of rating scales were done by a study psychiatrist with training in standardized assessment (S.S. or A.L.B.).
To be enrolled in the study, patients with OCD alone had to meet the DSM-IV criteria for OCD but not major depressive disorder, have a pretreatment Yale-Brown Obsessive Compulsive Scale score ≥16, and a 17-item Hamilton depression scale score <15. Patients with major depressive disorder alone had to meet the DSM-IV criteria for unipolar major depressive disorder but not OCD, have a Hamilton depression scale score ≥16 and a Yale-Brown Obsessive Compulsive Scale score <10. Patients with concurrent OCD and major depressive disorder met the full DSM-IV criteria for both disorders occurring simultaneously and had both a Yale-Brown Obsessive Compulsive Scale score >16 and a Hamilton depression scale score ≥16. These criteria were chosen on the basis of previous usage in several studies of OCD (39–41) and major depressive disorder (42, 43). All subjects were in good physical health. Two patients with OCD alone and three with comorbid OCD and major depressive disorder had comorbid tic disorders. Subjects with other concurrent axis I diagnoses (i.e., bipolar disorder, psychotic disorders, other anxiety disorders, or substance use disorders) or concurrent medical conditions affecting brain function (i.e., Parkinson’s disease, diabetes mellitus, etc.) were excluded. All subjects were free from psychoactive medications for at least 4 weeks before entering the study and were free from fluoxetine for at least 5 weeks. Only six subjects had received any psychotropic medication within 12 weeks of entering the study. Twenty-one of the 71 subjects (nine patients with OCD alone, six with major depressive disorder alone, and six with concurrent OCD and major depressive disorder) had never before been treated with psychotropic medications.
Image Acquisition
PET methods were as detailed in our previous reports (33, 34). Briefly, each subject received 5–10 mCi of FDG while in a supine position with eyes and ears open. Subjects were closely monitored to make sure that they remained awake and lay still without moving or talking during the 40-minute FDG uptake period. No cognitive task was given. PET scanning was performed with two Siemens-CTI PET (New York) tomographs—the ECAT III 831 (15 transverse sections spaced 6.75 mm apart, with a 6-mm in-plane spatial resolution, acquired at an angle parallel to the canthomeatal plane) for the first 38 subjects and the EXACT HR1 961 (47 transverse sections spaced 4.0 mm apart, with a 3.6-mm in-plane spatial resolution) for the next 33 subjects.
Each subject also received a magnetic resonance imaging (MRI) scan of the brain during the treatment period. The images were obtained by using a double-echo sequence (proton density and T2 images, TR=2000 to 2500 msec, TE=25 to 30 msec and 90 to 110 msec, 24-cm field of view, 3-mm slices with no separation). All MRI scans were reviewed by a neuroradiologist. Any prospective subject with MRI evidence of structural CNS lesions was excluded from the study.
Treatment
After receiving their baseline PET scans, all patients were treated openly with paroxetine titrated to a target dose of 40 mg/day, as tolerated, for the first 8 weeks. Thereafter, paroxetine doses were increased as tolerated up to a maximum of 60 mg/day for up to 4 more weeks, in the absence of a satisfactory response at lower doses. Compliance was monitored by patients’ reports during weekly medication visits. No psychoactive medications except paroxetine were allowed during the study period. Subjects received no formal psychotherapy or behavioral therapy during the treatment period. Pre- and posttreatment assessments were performed on the days of the pre- and posttreatment PET scans.
Image Analysis
Two methods of image analysis were employed: 1) MRI-based region-of-interest analysis, and 2) statistical parametric mapping (44, 45). Results from the two methods were compared, given the limitations of each (45, 46). PET data were subjected to statistical parametric mapping analysis for two reasons. First, the drawn regions of interest were relatively large; statistical parametric mapping allowed examination of smaller regions that might have significant associations with treatment response. Second, selection of regions of interest for analysis was based on previous literature, and statistical parametric mapping could screen the rest of the brain for unhypothesized associations.
MRI-based region of interest analysis involved coregistering each subject’s FDG PET scans with his/her MRI scan (47), then outlining regions of interest on horizontal planes of the MRI scan, as previously described (33, 34). Cerebrospinal fluid and white matter were excluded from the outlines of all gray matter regions of interest. Regions of interest were drawn by technicians who were blind to the subject’s identity and diagnosis and were reviewed by one of the authors (S.S. or A.L.B.) to ensure interrater reliability (48). Nine bilateral regions of interest were selected a priori on the basis of previous associations with OCD symptoms, major depressive disorder symptoms, or response to treatment: dorsolateral prefrontal cortex, ventrolateral prefrontal cortex, orbitofrontal cortex, dorsal anterior cingulate gyrus, ventral anterior cingulate gyrus, caudate, thalamus, amygdala, and hippocampus (Figure 1). The dorsolateral prefrontal cortex consisted of the dorsal half of the middle frontal gyrus, and the ventrolateral prefrontal cortex consisted of its ventral half (49). The orbitofrontal cortex region of interest included the medial and lateral orbital gyri, the orbital part of the inferior frontal gyrus, and the most inferior part of frontal pole, but excluded the gyrus rectus. The anterior cingulate gyrus was divided evenly into dorsal and ventral portions. The superior boundary of the dorsal anterior cingulate gyrus was the base of the body of the cingulate gyrus, while the inferior boundary was parallel to the middle of the body of the caudate. The caudate region of interest included the entire head but excluded the body and tail of the caudate nucleus. The amygdala and hippocampal regions of interest excluded the mesial temporal cortex and the parahippocampal gyrus. Both supratentorial hemispheres were also drawn.
Regions of interest drawn on each subject’s MRI were transferred onto his/her coregistered PET scans. The mean level of activity in each region of interest volume and the ratios of each region of interest normalized to ipsilateral hemispheric glucose metabolism were calculated as previously described (33, 34). Absolute glucose metabolic rates could not be calculated accurately or reliably for many PET scans in this study because of errors in gamma counter calibration and blood glucose measurement (33). Therefore, only regional metabolic data normalized to each subject’s ipsilateral hemisphere were used for the MRI-based region of interest analysis. This also made the region of interest and statistical parametric mapping analyses more congruent, as statistical parametric mapping data were also normalized and proportionally scaled to group means.
Statistical parametric mapping analysis of PET data employed the software package SPM 96 (50). PET images were coregistered and spatially normalized to the standardized coordinate system of Talairach and Tournoux (51). Global normalization by proportional scaling was used. A 16-mm full-width at half-maximum, three-dimensional Gaussian smoothing filter was applied to all images (52). To determine the location of statistical parametric mapping findings, MRIs of all study subjects were transformed into Talairach space, and clusters with significant correlations were mapped onto the group-averaged MRI so obtained. Voxel coordinates were also located in the standard atlas (51).
Statistical Analyses
To determine associations between pretreatment regional glucose metabolism and response to treatment, both region of interest based and whole-brain, voxel-by-voxel statistical parametric mapping analyses were performed. For the MRI-based region of interest analysis, partial correlation coefficients were calculated between the pretreatment region of interest normalized to ipsilateral hemispheric glucose metabolism values and pre- to posttreatment change in scores on the three symptom rating scales (Yale-Brown Obsessive Compulsive Scale, Hamilton depression scale, and GAS), with age, gender, and scanner type (the ECAT III 831 versus the EXACT HR1 961) as covarying parameters. Partial correlations were performed for the following subject groups: 1) the 27 patients with OCD alone, 2) the 27 patients with major depressive disorder alone, 3) the entire group of 44 OCD patients (with and without concurrent major depressive disorder), and 4) the entire group of 71 paroxetine-treated patients.
For the statistical parametric mapping analyses, linear regression was performed with pretreatment glucose metabolic rates as dependent variables and pre- to posttreatment changes in scores on the three symptom rating scales as independent variables. Scanner type (831 versus 961) was forced into the model as an independent variable to account for possible differences between groups scanned with different scanners. The statistical parametric mapping program performed a separate linear regression for every voxel, in which the data were the normalized voxel metabolic rates for every scan. In the regressions, the variance of the voxel normalized metabolic rate was taken to be independent of scan and voxel. Separate analyses were performed for each of the three symptom rating scales and for each of the four subject groups listed in the previous paragraph. Voxels with linear relationships between normalized glucose metabolism and change in symptom severity were considered significant at a level of uncorrected p<0.01 if they fell within our a priori, hypothesized regions of interest. These thresholds for significance were similar or identical to those of other PET reports (53–55). To scan the brain for significant effects in regions outside of the regions selected a priori, any voxel associated with symptom change at a threshold of p<0.001 was also considered significant. This method of scanning for hypothesized and unexpected regional correlations with different thresholds for significance was based on prior reports (56–58).
Results
Treatment Response
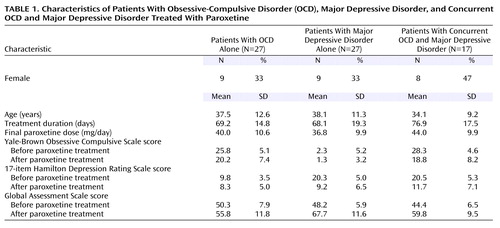
The groups did not differ significantly in age, male-female ratio, duration of treatment, or final paroxetine dose (Table 1). As previously reported (34), the group with OCD alone had significant pre- to posttreatment decreases in Yale-Brown Obsessive Compulsive Scale scores but did not have significant changes in Hamilton depression scale scores. The group with major depressive disorder alone had significant pre- to posttreatment decreases in Hamilton depression scale scores but did not have a significant change in Yale-Brown Obsessive Compulsive Scale scores. The group with concurrent OCD and major depressive disorder had significant decreases in both Yale-Brown Obsessive Compulsive Scale scores and Hamilton depression scale scores. GAS scores increased significantly in all three patient groups.
MRI-Based Region of Interest Analyses
A higher level of pretreatment glucose metabolism in the right caudate was associated with greater improvement of OCD symptoms and overall functioning with paroxetine treatment. In the 27 patients with OCD alone, normalized pretreatment glucose metabolism in the right caudate nucleus had a significant negative correlation with change in Yale-Brown Obsessive Compulsive Scale scores (partial r=–0.53, df=21, p=0.009) (Figure 2). Normalized pretreatment glucose metabolism in the right caudate nucleus also had a significant negative correlation with change in Yale-Brown Obsessive Compulsive Scale scores in the entire group of 44 OCD patients (with and without concurrent major depressive disorder) (partial r=–0.40, df=37, p<0.02). In this group, there was a significant positive correlation between normalized pretreatment glucose metabolism in the right caudate nucleus and change in GAS scores (partial r=0.41, df=37, p=0.01). In contrast, caudate metabolism was not associated with improvement in major depressive symptoms. There were no significant correlations between normalized pretreatment glucose metabolism in the right caudate nucleus and change in Hamilton depression scale scores in any subject group. No other brain region except the right caudate showed correlations with change in Yale-Brown Obsessive Compulsive Scale scores. No additional correlations emerged when the five OCD patients with comorbid tics were excluded.
Lower normalized pretreatment glucose metabolism in the right amygdala was strongly associated with improvement in depressive symptoms and overall functioning. In the 27 patients with major depressive disorder alone, normalized pretreatment glucose metabolism in the right amygdala significantly correlated with change in Hamilton depression scale scores (partial r=0.71, df=20, p<0.001) (Figure 3) and was negatively correlated with change in GAS scores (partial r=–0.61, df=20, p=0.003). Further, normalized, pretreatment glucose metabolism in the right amygdala significantly correlated with change in Hamilton depression scale scores in the combined group of all 71 paroxetine-treated patients (partial r=0.25, df=64, p<0.04).
Lower normalized pretreatment activity in the thalamus was also associated with improvement in depressive symptoms. In the 44 patients with OCD (with and without comorbid major depressive disorder), normalized pretreatment activity in the thalamus correlated with change in Hamilton depression scale scores (partial r=0.34, df=38, p<0.04). However, similar correlations were not significant in the 27 patients with major depressive disorder alone or in the entire group of 71 paroxetine-treated patients.
Statistical Parametric Mapping Analyses
In the entire group of paroxetine-treated patients, decline in Hamilton depression scale scores was strongly associated with lower pretreatment glucose metabolism in the left amygdala (Talairach coordinates: x=–12, y=–8, z=–24) (z=2.51, p=0.006) and left dorsal thalamus (Talairach coordinates: x=–16, y=–22, z=18) (z=2.62, p=0.004), but with higher pretreatment metabolism in a large region of midline prefrontal cortex, just rostral to the anterior cingulate gyrus (Talairach coordinates: x=0, y=62, z=10) (z=2.91, p=0.002) (Figure 4), a small locus in the right dorsolateral prefrontal cortex (Talairach coordinates: x=44, y=54, z=12) (z=3.22, p=0.001), a small locus in the left dorsolateral prefrontal cortex (Talairach coordinates: x=–32, y=60, z=20) (z=2.39, p=0.008), the right superior temporal cortex (Talairach coordinates: x=62, y=0, z=8) (z=3.33, p<0.001), and the left inferior parietal cortex (Talairach coordinates: x=–66, y=–32, z=30) (z=3.32, p<0.001). In the 44 patients with major depressive disorder (with or without comorbid OCD), improvement in depressive symptoms was strongly associated with higher pretreatment glucose metabolism in the midline prefrontal cortex (Talairach coordinates: x=0, y=64, z=6) (z=3.20, p=0.001) and the right superior temporal/opercular cortex (Talairach coordinates: x=64, y=0, z=12) (z=3.41, p<0.001). In the 27 patients with major depressive disorder alone, there were no significant correlations between pretreatment glucose metabolism and change in Hamilton depression scale scores found by statistical parametric mapping. There were no significant correlations between pretreatment cerebral metabolism and change in Yale-Brown Obsessive Compulsive Scale scores found by statistical parametric mapping in any subject group.
Discussion
The primary finding of the present study was that different patterns of pretreatment brain activity correlated with the response of different neuropsychiatric syndromes to the same medication, paroxetine. While improvement of OCD symptoms was uniquely associated with higher pretreatment glucose metabolism in the right caudate nucleus, improvement of major depressive disorder symptoms was associated with lower pretreatment glucose metabolism in the amygdala and higher metabolism in the medial prefrontal cortex and rostral anterior cingulate gyrus. These findings suggest that, although both OCD and major depressive disorder respond well to the same SRI medications, the two syndromes have quite different neurobiological substrates for response.
In this study, higher pretreatment metabolism in the right caudate correlated with the degree of improvement of OCD symptoms with paroxetine treatment. Higher glucose metabolism in the right caudate appears to reflect greater release of glutamate (27, 59), and our findings closely parallel the association between higher pretreatment glutamate concentration in the right caudate and response to paroxetine found by Rosenberg et al. (27). The right caudate is one of the brain regions most consistently associated with OCD and its response to treatment. Numerous prior neuroimaging studies of OCD patients have found higher levels of activity in the right caudate at baseline (see reference 60 for review) that decrease in responders to a variety of treatments (61, 62) and increase with symptom provocation (63). Our group previously reported that treatment-responsive OCD patients were characterized by significant, pathological correlations between glucose metabolic rates in the right caudate, orbitofrontal cortex, anterior cingulate gyrus, and thalamus that were not present in OCD nonresponders, comparison subjects, or patients with major depressive disorder (61, 62). Thus, higher levels of activity in the right caudate and abnormally strong functional interconnectivity between this structure and other structures along limbic and paralimbic frontal-subcortical circuits (64) may represent the neural substrate for treatment-responsive OCD. We and others have postulated that overactivity along these circuits may be due to an imbalance of direct versus indirect striatopallidal pathway tone (60, 65).
We did not fully replicate previous findings of a significant association between pretreatment orbitofrontal cortex metabolism and better response of OCD symptoms to treatment (24–26). In the 27 patients with OCD alone in this study, lower normalized pretreatment activity in the orbitofrontal cortex was weakly associated with a decline in Yale-Brown Obsessive Compulsive Scale scores (partial r=0.30, df=21, p=0.16) and an increase in GAS scores (partial r=–0.35, df=21, p=0.10), but these correlations did not reach statistical significance. In all 44 patients with OCD (with and without comorbid major depressive disorder), normalized pretreatment activity in the orbitofrontal cortex was associated with an increase in GAS scores (partial r=–0.32, df=37, p=0.04) but not with a change in Yale-Brown Obsessive Compulsive Scale scores. Methodological differences could account for the discrepancy in results between the present study and prior studies. Most previous studies either analyzed regions of interest drawn on PET scans or did whole-brain searches by using statistical parametric mapping, rather than employing structural MRI-based localization of cerebral cortical regions of interest, as in this study. Symptomatic differences between the subject pools of different studies and differences in the medications used might also contribute to the differences in findings (60).
Our results add to evidence indicating that higher pretreatment activity in midline prefrontal cortex and anterior cingulate gyrus is a reliable marker of responsiveness to antidepressant treatment. In this study, pretreatment glucose metabolism in a region encompassing the most rostral, affective subdivision of anterior cingulate gyrus (66) and the medial prefrontal cortex immediately anterior to it was strongly correlated with the degree of improvement of depressive symptoms after paroxetine treatment. A higher level of activity in this same brain region has been associated with eventual response to antidepressant treatment in at least six separate studies that used different treatment and imaging modalities (28, 29, 67–70). The medial prefrontal cortex and the rostral anterior cingulate gyrus are thought to mediate affective responses (71) and cognitive/emotional interactions (72). These regions have heavy connections with the amygdala, hypothalamus, and autonomic brainstem nuclei, as well as with the dorsal and subgenual anterior cingulate gyrus (71). Mayberg et al. (28) speculated that adaptive hypermetabolic changes in the rostral anterior cingulate gyrus might be required to facilitate response to treatment. Dopaminergic input to the anterior cingulate gyrus and the medial prefrontal cortex may also modulate response to treatment. Anterior cingulate gyrus metabolism is closely related to dopamine D2 receptor binding (73), which was found to increase after SRI treatment of major depressive disorder in responders but not in nonresponders (74).
Lower pretreatment activity in the right amygdala was strongly associated with improvement in depressive symptoms in this study, both in patients with major depressive disorder and those with OCD. A large body of evidence points to the central role of the amygdala in the perception of threat, fear, reward conditioning, the assignment of emotional significance to stimuli, and the initiation of emotional responses to those stimuli (see references 75 and 76 for review), as well as in mediating the symptoms of major depressive disorder (77). The right amygdala shows an ability to habituate rapidly to emotionally valenced stimuli (78–80). This decrease of activity in the amygdala is thought to be due to greater inhibition of this structure by the medial prefrontal cortex, an adaptive process by which emotional responses are attenuated and modulated (81). Thus, lower activity in the right amygdala and higher activity in the medial prefrontal cortex at baseline might represent an ability to inhibit or habituate to emotional responses, allowing an individual to recover eventually from negative emotional states. This may be a neural substrate required for successful response of depressive symptoms to treatment.
Moreover, it has been suggested that abnormally high levels of activity in the amygdala could drive the propensity to relapse or recurrence of depression (82, 83). During depressive episodes, metabolism in the amygdala correlates positively with both negative affect and plasma cortisol levels (84), so higher metabolism in the amygdala may indicate a lesser ability to normalize glucocorticoid function during antidepressant treatment, resulting in less improvement in depressive symptoms. Previous findings of higher levels of activity in the amygdala (32) and abnormal hypothalamic-pituitary-adrenal axis activity (85) in patients with treatment-resistant depression support this hypothesis. Higher levels of activity in the amygdala may also be related to lower levels of serotonin (5-HT) 1A receptor binding (86), which in turn could result in poorer response to antidepressants.
Some of the relationships found between pretreatment regional activity and response of major depressive disorder versus OCD symptoms to treatment appear to hold true across diagnostic boundaries. Significant correlations between change in Hamilton depression scale scores and pretreatment glucose metabolism in the amygdala and midline prefrontal cortex were present not only in patients with major depressive disorder alone but also in patients with comorbid OCD and major depressive disorder. Similarly, significant correlations between normalized pretreatment activity in the right caudate and change in Yale-Brown Obsessive Compulsive Scale scores were found in both depressed and nondepressed subjects with OCD. Thus, higher activity in the midline prefrontal cortex/anterior cingulate gyrus and lower activity in the right amygdala appear to reflect the responsiveness to treatment of brain systems mediating depressive symptoms, regardless of primary diagnosis. In contrast, higher levels of baseline activity in the right caudate may reflect the responsiveness of brain systems mediating OCD symptoms to SRI treatment, regardless of the presence or absence of comorbid mood disorders.
Both region of interest and statistical parametric mapping analyses revealed a significant association between lower pretreatment thalamic metabolism and greater improvement in depressive symptoms in patients with OCD (with and without comorbid major depressive disorder) but not in patients with major depressive disorder alone, suggesting that pretreatment thalamic activity may influence treatment response in OCD but not in major depressive disorder. This result is consistent with our previous finding that depression severity was associated with lower thalamic metabolism in patients with OCD, but with higher thalamic metabolism in patients with major depressive disorder alone (38). Thus, both the severity and responsiveness to treatment of depressive symptoms appear to be mediated differently in patients with OCD than in patients with major depressive disorder.
The present study had several methodological limitations. Because prediction of response was not this study’s original objective, the overall study design did not lend itself to a definitive determination of cerebral metabolic predictors of response, only associations between pretreatment metabolism and treatment response. Therefore, these correlations were secondary analyses, and their results must be interpreted with caution. A more definitive determination of cerebral metabolic predictors of treatment response would require a randomized, prospective, placebo-controlled design with a larger number of subjects. Correction for multiple comparisons was used for the statistical parametric mapping analyses but not for the MRI-based region of interest analyses because the regions of interest were selected on the basis of a priori hypotheses. The large number of correlations performed could potentially have led to type I error in the MRI-based region of interest analyses. However, the statistical parametric mapping and region of interest methods yielded several results in common, including correlations between improvement in Hamilton depression scale scores and lower pretreatment activity in both the amygdala and thalamus. Discrepancies between the results of the region of interest analyses and statistical parametric mapping analyses could have been due to several factors, including statistical parametric mapping’s difficulty in correcting for interindividual variations in neuroanatomy (e.g., in the size, shape, and position of the caudate nucleus), the significance and extent thresholds used for the statistical parametric mapping analyses, and the size and boundaries of the regions of interest.
Another potential limitation was that two different PET tomographs were used in the study. Because scanner type was found to have a significant effect on glucose metabolism in several regions of interest, all data analyses had scanner type as a covariate, which limited the power to detect significant correlations. We analyzed only normalized metabolic rates because the absolute and global metabolic rates generated by the PET methods we used were not felt to be reliable (33, 34). Normalized and absolute rates have shown different results in prior studies (60) and may have given different results for this study. In addition, the content of subjects’ thoughts during the FDG uptake phase was not monitored, so the extent to which pretreatment cerebral metabolic patterns reflected specific thoughts and emotions occurring during the scan could not be determined. Because of these limitations, caution is required in drawing firm conclusions from these results.
However, this study also had several strengths that afford confidence in its findings. To our knowledge, this is the largest study of its kind reported, with the largest numbers of OCD and major depressive disorder subjects ever assessed before and after standardized treatment, and it is the first to compare predictors of response to the same treatment across different disorders. All subjects were free from psychotropic medications for at least 4 weeks (and at least 5 weeks for fluoxetine), reducing the risk of medication effects on baseline cerebral metabolism. No other medication but paroxetine was allowed during the study, eliminating confounds from polypharmacy and allowing us to directly compare neurobiological substrates for response to the same treatment in OCD versus major depressive disorder. MRI-based localization of regions of interest was used for the calculation of regional metabolic rates. Statistical parametric mapping and region of interest analyses were compared and produced similar results.
In conclusion, our results support the role of functional neuroimaging in identifying the differential neural substrates of treatment responsiveness in OCD and major depressive disorder. Prediction of treatment response on the basis of pretreatment brain activity could become increasingly important in the future for understanding the mechanisms of treatment response and developing better interventions for patients with treatment-resistant disorders.
 |
Received Oct. 18, 2001; revision received Sept. 10, 2002; accepted Sept. 13, 2002. From the Department of Psychiatry and Biobehavioral Sciences, David Geffen School of Medicine at UCLA, Los Angeles. Address reprint requests to Dr. Saxena, Department of Psychiatry and Biobehavioral Sciences, University of California, Los Angeles, 300 UCLA Medical Plaza, Room 2229, Los Angeles, CA 90095; [email protected] (e-mail). Supported by the Charles A. Dana Foundation Consortium on Neuroimaging Leadership Training (Drs. Saxena and Baxter), a NIMH Career Development Award (MH-01694) to Dr. Saxena, a NIMH grant (MH-53565A) to Drs. Baxter and Saxena, grants from the National Alliance for Research on Schizophrenia and Depression to Drs. Brody and Baxter, a Veterans Affairs Advanced Career Development Award to Dr. Brody, a Department of Energy grant (DE FCE3-87ER 60615) to Dr. Baxter, donations from Mr. and Mrs. Brian Harvey, and the Kathy Ireland Chair for Psychiatric Research at University of Alabama at Birmingham.

Figure 1. Brain Regions of Interest Drawn on Magnetic Resonance Imagesa
aImages are horizontal 3-mm-thick adjacent sections.

Figure 2. Correlation Between Pretreatment Glucose Metabolism in the Right Caudate Nucleus and Change in Yale-Brown Obsessive Compulsive Scale Score for 27 Paroxetine-Treated Patients With OCD and No Concurrent Disordersa
aPartial r=–0.53, df=21, p=0.009, with age, sex, scanner type, and Hamilton depression scale score covaried.

Figure 3. Correlation Between Pretreatment Glucose Metabolism in the Right Amygdala and Change in Hamilton Depression Scale Score for 27 Paroxetine-Treated Patients With Major Depressive Disorder and No Concurrent Disordersa
aPartial r=0.71, df=20, p<0.001, with age, sex, and scanner type covaried. Datapoints for some patients overlapped.

Figure 4. Significant Correlations Between Higher Pretreatment Brain Glucose Metabolism and Decrease in Hamilton Depression Scale Score for 71 Paroxetine-Treated Patients With OCD, Major Depressive Disorder, and Concurrent OCD and Major Depressive Disordera
aDecline in Hamilton depression scale score was strongly associated with higher pretreatment metabolism in a large region of the midline prefrontal cortex, just rostral to the anterior cingulate gyrus (Talairach coordinates: x=0, y=62, z=10) (z=2.91, p=0.002), a small locus in the right dorsolateral prefrontal cortex (Talairach coordinates: x=44, y=54, z=12) (z=3.22, p=0.001), a small locus in the left dorsolateral prefrontal cortex (Talairach coordinates: x=–32, y=60, z=20) (z=2.39, p=0.008), the right superior temporal cortex (Talairach coordinates: x=62, y=0, z=8) (z=3.33, p<0.001), and the left inferior parietal cortex (Talairach coordinates: x=–66, y=–32, z=30) (z=3.32, p<0.001).
1. Amsterdam JD, Hornig-Rohan M: Treatment algorithms in treatment-resistant depression. Psychiatr Clin North Am 1996; 19:371-386Crossref, Medline, Google Scholar
2. Greist JH, Jefferson J, Koback KA, Katzelnick DJ, Serlin RC: Efficacy and tolerability of serotonin transport inhibitors in obsessive-compulsive disorder: a meta-analysis. Arch Gen Psychiatry 1995; 52:53-60Crossref, Medline, Google Scholar
3. Hsiao JK, Agren H, Bartko JJ, Rudorfer MV, Linnoila M, Potter WZ: Monoamine neurotransmitter interactions and the prediction of antidepressant response. Arch Gen Psychiatry 1987; 44:1078-1083Crossref, Medline, Google Scholar
4. Castrogiovanni P, Di Muro A, Marazitti D: Imipramine binding as a predictor of fluoxetine response in depressed patients. Neuropsychobiology 1995; 31:64-67Crossref, Medline, Google Scholar
5. Maes M, Verkerk R, Vandoolaeghe E, Lin A, Scharpe S: Serum levels of excitatory amino acids, serine, glycine, histidine, threonine, taurine, alanine, and arginine in treatment-resistant depression: modulation by treatment with antidepressants and prediction of clinical responsivity. Acta Psychiatr Scand 1998; 97:302-308Crossref, Medline, Google Scholar
6. Schatzberg AF: Noradrenergic versus serotonergic antidepressants: predictors of treatment response. J Clin Psychiatry 1998; 59(suppl 14):15-18Google Scholar
7. Kusumi I, Suzuki K, Sasaki Y, Kameda K, Koyama T: Treatment response in depressed patients with enhanced Ca mobilization stimulated by serotonin. Neuropsychopharmacology 2000; 23:290-296Crossref, Google Scholar
8. Humble M, Bejerot S, Bergvist PB, Bengtsson F: Reactivity of serotonin in whole blood: relationship with drug response in obsessive-compulsive disorder. Biol Psychiatry 2001; 49:360-368Crossref, Medline, Google Scholar
9. Hollander E, Stein DJ, DeCaria CM, Saoud JB, Klein DF, Liebowitz MR: A pilot study of biological predictors of treatment outcome in obsessive-compulsive disorder. Biol Psychiatry 1993; 33:747-749Crossref, Medline, Google Scholar
10. Ribeiro SC, Tandon R, Grunhaus L, Greden JF: The DST as a predictor of outcome in depression: a meta-analysis. Am J Psychiatry 1993; 150:1618-1629Link, Google Scholar
11. Sallee FR, Koran LM, Pallanti S, Carson SW, Sethuraman G: Intravenous clomipramine challenge in obsessive-compulsive disorder: predicting response to oral therapy at eight weeks. Biol Psychiatry 1998; 44:220-227Crossref, Medline, Google Scholar
12. Amsterdam JD, Fava M, Maislin G, Rosenbaum J, Hornig-Rohan M: TRH stimulation test as a predictor of acute and long-term antidepressant response in major depression. J Affect Disord 1996; 38:165-172Crossref, Medline, Google Scholar
13. Healy E, McKeon P: Dopaminergic sensitivity and prediction of antidepressant response. J Psychopharmacol 2000; 14:152-156Crossref, Medline, Google Scholar
14. Kalayam B, Alexopolous GS: Prefrontal dysfunction and treatment response in geriatric depression. Arch Gen Psychiatry 1999; 56:713-718Crossref, Medline, Google Scholar
15. Dunkin JJ, Leuchter AF, Cook IA, Kasl-Godly JE, Abrams M, Rosenberg-Thompson S: Executive dysfunction predicts nonresponse to fluoxetine in major depression. J Affect Disord 2000; 60:13-23Crossref, Medline, Google Scholar
16. Gallinat J, Bottlender R, Juckel G, Munke-Puchner A, Stotz G, Kuss HJ, Mavrogiorgou P, Hegerl U: The loudness dependency of the auditory evoked N1/P2-component as a predictor of the acute SSRI response in depression. Psychopharmacology (Berl) 2000; 148:404-411Crossref, Medline, Google Scholar
17. Ulrich G, Huang HJ, Fanhndrich E: Acute versus chronic EEG effects of maprotiline and clomipramine in depressive inpatients and in the prediction of therapeutic outcome. J Affect Disord 1994; 32:213-217Crossref, Medline, Google Scholar
18. Luthringer R, Minot R, Toussaint M, Calvi-Gries F, Schaltenbrand N, Macher JP: All-night EEG spectral analysis as a tool for the prediction of clinical response to antidepressant treatment. Biol Psychiatry 1995; 38:98-104Crossref, Medline, Google Scholar
19. Knott VJ, Telner JI, Lapierre YD, Browne M, Horn ER: Quantitative EEG in the prediction of antidepressant response to imipramine. J Affect Disord 1996; 39:175-184Crossref, Medline, Google Scholar
20. Cook IA, Leuchter AF, Witte E, Abrams M, Uijtdehaage SH, Stubbeman W, Rosenberg-Thompson S, Anderson-Hanley C, Dunkin JJ: Neurophysiologic predictors of treatment response to fluoxetine in major depression. Psychiatry Res 1999; 85:263-273Crossref, Medline, Google Scholar
21. Billet EA, Richter MA, King N, Heils A, Lesch KP, Kennedy JL: Obsessive-compulsive disorder, response to serotonin reuptake inhibitors, and the serotonin transporter gene. Mol Psychiatry 1997; 2:403-406Crossref, Medline, Google Scholar
22. Smeraldi E, Zanardi E, Benedetti F, di Bella D, Perez J, Catalano M: Polymorphism within the promoter of the serotonin transporter gene and antidepressant efficacy of fluvoxamine. Mol Psychiatry 1998; 3:508-511Crossref, Medline, Google Scholar
23. Zanardi E, Benedetti F, di Bella D, Catalano M, Smeraldi E: Efficacy of paroxetine in depression is influenced by a functional polymorphism within the promoter of the serotonin transporter gene. J Clin Psychopharmacol 2000; 20:105-107Crossref, Medline, Google Scholar
24. Swedo SE, Schapiro MG, Grady CL, Cheslow DL, Leonard HL, Kumar A, Friedland R, Rapaport SI, Rapaport JL: Cerebral glucose metabolism in childhood-onset obsessive-compulsive disorder. Arch Gen Psychiatry 1989; 46:518-523Crossref, Medline, Google Scholar
25. Brody AL, Saxena S, Schwartz JM, Baxter LR: FDG-PET predictors of response to behavioral therapy versus pharmacotherapy in obsessive-compulsive disorder. Psychiatry Res Neuroimaging 1998; 84:1-6Crossref, Medline, Google Scholar
26. Saxena S, Brody AL, Colgan ME, Maidment KM, Dunkin JJ, Alborzian S, Phelps ME, Baxter LR: Localized orbitofrontal and subcortical metabolic changes and predictors of response to paroxetine treatment of obsessive-compulsive disorder. Neuropsychopharmacology 1999; 21:683-693Crossref, Medline, Google Scholar
27. Rosenberg DR, MacMaster FP, Keshavan M, Fitzgerald KD, Stewart CM, Moore CJ: Decrease in caudate glutamate concentrations in pediatric obsessive-compulsive disorder patients taking paroxetine. J Am Acad Child Adolesc Psychiatry 2000; 39:1096-1103Crossref, Medline, Google Scholar
28. Mayberg HS, Brannan SK, Mahurin RK, Jerabek PA, Brickman JS, Tekell JL, Silva JA, McGinnis S, Glass TG, Martin CC, Fox PT: Cingulate function in depression: a potential predictor of treatment response. Neuroreport 1997; 8:1057-1061Crossref, Medline, Google Scholar
29. Buchsbaum MS, Wu J, Siegel BV, Hackett E, Trenary M, Abel L, Reynolds C: Effect of sertraline on regional metabolic rate in patients with affective disorder. Biol Psychiatry 1997; 41:15-22Crossref, Medline, Google Scholar
30. Brody AL, Saxena S, Silverman DHS, Alborzian S, Fairbanks LA, Phelps ME, Huang S-C, Wu H-M, Maidment K, Baxter LR: Brain metabolic changes in major depressive disorder from pre- to post- treatment with paroxetine. Psychiatry Res Neuroimaging 1999; 91:127-139Crossref, Medline, Google Scholar
31. Little JT, Ketter TA, Kimbrell TA, Danielson A, Benson B, Willis MW, Post RM: Venlafaxine or bupropion responders but not nonresponders show baseline prefrontal and paralimbic hypometabolism compared with controls. Psychopharmacol Bull 1996; 32:629-635Medline, Google Scholar
32. Hornig M, Mozley PD, Amsterdam JD: HMPAO SPECT brain imaging in treatment-resistant depression. Prog Neuropsychopharmacol Biol Psychiatry 1997; 21:1097-1114Crossref, Medline, Google Scholar
33. Saxena S, Brody AL, Ho ML, Alborzian S, Ho MK, Maidment KM, Huang SC, Wu HM, Au SC, Baxter LR: Cerebral metabolism in major depression and obsessive-compulsive disorder occurring separately and concurrently. Biol Psychiatry 2001; 50:170-181Crossref, Google Scholar
34. Saxena S, Brody AL, Ho ML, Alborzian S, Maidment KM, Zohrabi N, Ho MK, Huang SC, Wu HM, Baxter LR: Differential cerebral metabolic changes with paroxetine treatment of obsessive-compulsive disorder versus major depression. Arch Gen Psychiatry 2002; 59:250-261Crossref, Medline, Google Scholar
35. Spitzer RL, Endicott J: Schedule for Affective Disorders and Schizophrenia (SADS), 3rd ed. New York, New York State Psychiatric Institute, Biometrics Research, 1978Google Scholar
36. Goodman WK, Price LH, Rasmussen SA, Mazure C, Fleischmann RL, Hill CL, Heninger GR, Charney DS: The Yale-Brown Obsessive Compulsive Scale, I: development, use, and reliability. Arch Gen Psychiatry 1989; 46:1006-1011Crossref, Medline, Google Scholar
37. Hamilton M: Diagnosis and rating scale for depression. Br J Psychiatry 1960; 3:76-79Google Scholar
38. Endicott J, Spitzer RL, Fleiss JL, Cohen J: The Global Assessment Scale: a procedure for measuring overall severity of psychiatric disturbance. Arch Gen Psychiatry 1976; 33:766-771Crossref, Medline, Google Scholar
39. Zohar J, Judge R (OCD Paroxetine Study Investigators): Paroxetine versus clomipramine in the treatment of obsessive-compulsive disorder. Br J Psychiatry 1996; 169:468-474Crossref, Medline, Google Scholar
40. Benkelfat C, Nordahl TE, Semple WE, King AC, Murphy DL, Cohen RM: Local cerebral glucose metabolic rates in obsessive-compulsive disorder: patients treated with clomipramine. Arch Gen Psychiatry 1990; 47:840-848Crossref, Medline, Google Scholar
41. Wood A, Tollefson GD, Birkett M: Pharmacotherapy of obsessive-compulsive disorder—experience with fluoxetine. Int Clin Psychopharmacol 1993; 8:301-306Crossref, Medline, Google Scholar
42. Tollefson GD, Holman SL: Analysis of the Hamilton Depression Rating Scale factors from a double-blind, placebo-controlled trial of fluoxetine in geriatric major depression. Int Clin Psychopharmacol 1993; 8:253-259Crossref, Medline, Google Scholar
43. Ban TA, Gaszner P, Aguglia E, Batista R, Castillo A, Lipcsey A, Macher J-P, Torres-Ruiz A, Vergara L: Clinical efficacy of reboxetine: a comparative study with desipramine, with methodological considerations. Hum Psychopharmacol 1998; 13(suppl 1):S29-S39Google Scholar
44. Friston K, Frith C, Liddle P, Frackowiak R: Comparing functional (PET) images: the assessment of significant change. J Cereb Blood Flow Metab 1991; 11:690-699Crossref, Medline, Google Scholar
45. Friston KJ, Worsley KJ, Frackowiak RSJ, Mazziotta JC, Evans AC: Assessing the significance of focal activations using their spatial extent. Hum Brain Mapp 1994; 1:214-220Google Scholar
46. Steinmetz H, Seitz RJ: Functional anatomy of language processing: neuroimaging and the problem of individual variability. Neuropsychologia 1991; 29:1149-1161Crossref, Medline, Google Scholar
47. Lin KP, Huang S-C, Baxter LR, Phelps ME: A general technique for inter-study registration of multi-function and multimodality images. J Cereb Blood Flow Metab 1993; 9:96-103Google Scholar
48. Small GW, Stern CE, Mandelkern MA, Fairbanks LA, Min CA, Guze BH: Reliability of drawing regions of interest for positron emission tomography. Psychiatry Res 1992; 45:177-185Crossref, Medline, Google Scholar
49. Rajkowska G, Goldman-Rakic PS: Cytoarchitectonic definition of prefrontal areas in the normal human cortex, II: variability in locations of areas 9 and 46 and relationship to the Talairach coordinate system. Cereb Cortex 1995; 5:323-337Crossref, Medline, Google Scholar
50. Friston KJ, Holmes AP, Worsley KJ, Poline JP, Frith CD, Frackowiak RSJ: Statistical parametric maps in functional imaging: a general linear approach. Hum Brain Mapp 1995; 2:189-210Crossref, Google Scholar
51. Talairach J, Tournoux P: Co-Planar Stereotaxic Atlas of the Human Brain: Three-Dimensional Proportional System. New York, Thieme Medical, 1988Google Scholar
52. Friston KJ, Ashburner J, Frith CD, Poline J, Heather JD, Frackowiak RSJ: Spatial registration and normalisation of images. Hum Brain Mapp 1995; 2:165-189Crossref, Google Scholar
53. Ketter TA, Andreason PJ, George MS, Lee C, Gill DS, Parekh PI, Willis MW, Herscovitch P, Post RM: Anterior paralimbic mediation of procaine-induced emotional and psychosensory experiences. Arch Gen Psychiatry 1996; 53:59-69Crossref, Medline, Google Scholar
54. Marangell LB, Ketter TA, George MS, Pazzaglia PJ, Callahan AM, Parekh P, Andreason PJ, Horwitz B, Herscovitch P, Post RM: Inverse relationship of peripheral thyrotropin-stimulating hormone levels to brain activity in mood disorders. Am J Psychiatry 1997; 154:224-230Link, Google Scholar
55. Sargent PA, Kjaer KH, Bench CJ, Rabiner EA, Messa C, Meyer J, Gunn RN, Grasby PM, Cowen PJ: Brain serotonin1A receptor binding measured by positron emission tomography with [11C]WAY-100635: effects of depression and antidepressant treatment. Arch Gen Psychiatry 2000; 57:174-180Crossref, Medline, Google Scholar
56. Kimbrell TA, George MS, Parekh PI, Ketter TA, Podell DM, Danielson AL, Repella JD, Benson BE, Willis MW, Herscovitch P, Post RM: Regional brain activity during transient self-induced anxiety and anger in healthy adults. Biol Psychiatry 1999; 46:454-465Crossref, Medline, Google Scholar
57. Meyer JH, Swinson R, Kennedy SH, Houle S, Brown GM: Increased left posterior parietal-temporal cortex activation after d-fenfluramine in women with panic disorder. Psychiatry Res 2000; 98:133-143Crossref, Medline, Google Scholar
58. Stern E, Silbersweig DA, Chee KY, Holmes A, Robertson MM, Trimble M, Frith CD, Frackowiak RS, Dolan R: A functional neuroanatomy of tics in Tourette syndrome. Arch Gen Psychiatry 2000; 57:741-748Crossref, Medline, Google Scholar
59. Sibson NR, Dhankar A, Mason GF, Behar KL, Rothman DL, Shulman RG: In vivo 13C NMR measurements of cerebral glutamine synthesis as evidence for glutamate-glutamine cycling. Proc Natl Acad Sci USA 1997; 94:2699-2704Crossref, Medline, Google Scholar
60. Saxena S, Rauch SL: Functional neuroimaging and the neuroanatomy of obsessive-compulsive disorder. Psychiatric Clin North Am 2000; 23:563-584Crossref, Medline, Google Scholar
61. Baxter LR, Schwartz JM, Bergman KS, Szuba MP, Guze BH, Mazziota JC, Alazraki A, Selin CE, Ferng HK, Munford P, Phelps ME: Caudate glucose metabolic rate changes with both drug and behavior therapy for obsessive-compulsive disorder. Arch Gen Psychiatry 1992; 49:681-689Crossref, Medline, Google Scholar
62. Schwartz JM, Stoessel PW, Baxter LR, Martin KM, Phelps ME: Systematic changes in cerebral glucose metabolic rate after successful behavior modification treatment of obsessive-compulsive disorder. Arch Gen Psychiatry 1996; 53:109-113Crossref, Medline, Google Scholar
63. Rauch SL, Jenicke MA, Alpert NM, Baer L, Breiter HCR, Savage CR, Fischman AJ: Regional cerebral blood flow measured during symptom provocation in obsessive-compulsive disorder using oxygen 15-labeled carbon dioxide and positron emission tomography. Arch Gen Psychiatry 1994; 51:62-70Crossref, Medline, Google Scholar
64. Alexander GE, DeLong MR, Strick PL: Parallel organization of functionally segregated circuits linking basal ganglia and cortex. Ann Rev Neurosci 1986; 9:357-381Crossref, Medline, Google Scholar
65. Baxter LR, Saxena S, Brody AL, Ackermann RF, Colgan M, Schwartz JM, Allen-Martinez Z, Fuster JM, Phelps ME: Brain mediation of obsessive-compulsive disorder symptoms: evidence from functional brain imaging studies in the human and non-human primate. Semin Clin Neuropsychiatry 1996; 1:32-47Medline, Google Scholar
66. Vogt BA, Finch DM, Olson CR: Functional heterogeneity in cingulate cortex: the anterior executive and posterior evaluative regions. Cereb Cortex 1992; 2:435-443Medline, Google Scholar
67. Pizzagalli D, Pascual-Marqui RD, Nitschke JB, Oakes TR, Larson CL, Abercrombie HC, Schaefer SM, Koger JV, Benca RM, Davidson RJ: Anterior cingulate activity as a predictor of degree of treatment response in major depression: evidence from brain electrical tomography analysis. Am J Psychiatry 2001; 158:405-415Link, Google Scholar
68. Ebert D, Feistel H, Barocka A: Effects of sleep deprivation on the limbic system and the frontal lobes in affective disorders: a study with Tc-99m-HMPAO SPECT. Psychiatry Res 1991; 40:247-251Crossref, Medline, Google Scholar
69. Wu JC, Gillin JC, Buchsbaum MS, Hershey T, Johnson JC, Bunney WE Jr: Effect of sleep deprivation on brain metabolism of depressed patients. Am J Psychiatry 1992; 149:538-543Link, Google Scholar
70. Wu JC, Buchsbaum MS, Gillin JC, Tang C, Cadwell S, Weigand M, Najafi A, Klein E, Hazen K, Bunney WE Jr: Prediction of antidepressant effects of sleep deprivation by metabolic rates in the ventral anterior cingulate and medical prefrontal cortex. Am J Psychiatry 1999; 156:1149-1158Abstract, Google Scholar
71. Devinsky O, Morrell MJ, Vogt BA: Contributions of anterior cingulate cortex to behavior. Brain 1995; 118:279-306Crossref, Medline, Google Scholar
72. Lane RD, Fink GR, Chau PM, Dolan RJ: Neural activation during selective attention to subjective emotional responses. Neuroreport 1997; 8:3969-3972Crossref, Medline, Google Scholar
73. Volkow ND, Logan J, Fowler JS, Wang G-J, Gur RC, Wong C, Felder C, Gatley SJ, Ding Y-S, Hitzemann R, Pappas N: Association between age-related decline in brain dopamine activity and impairment in frontal and cingulate metabolism. Am J Psychiatry 2000; 157:75-80Link, Google Scholar
74. Larisch R, Klimke A, Vosberg H, Loffler S, Gaebel W, Muller-Gartner HW: In vivo evidence for the involvement of dopamine-D2 receptors in striatum and anterior cingulate gyrus in major depression. Neuroimage 1997; 5:251-260Crossref, Medline, Google Scholar
75. Davis M: The role of the amygdala in fear and anxiety. Annu Rev Neurosci 1992; 15:353-375Crossref, Medline, Google Scholar
76. LeDoux JE: The Emotional Brain. New York, Simon & Schuster, 1996Google Scholar
77. Drevets WC: Functional neuroimaging studies of depression: the anatomy of melancholia. Annu Rev Med 1998; 49:341-361Crossref, Medline, Google Scholar
78. Irwin W, Davidson RJ, Lowe MJ, Mock BJ, Sorenson JA, Turski PA: Human amygdala activation detected with echo-planar functional magnetic resonance imaging. Neuroreport 1996; 7:1765-1769Crossref, Medline, Google Scholar
79. Wright CI, Fischer H, Whalen PJ, McInerney SC, Shin LM, Rauch SL: Differential prefrontal cortex and amygdala habituation to repeatedly presented emotional stimuli. Neuroreport 2001; 12:379-383Crossref, Medline, Google Scholar
80. Phillips ML, Medford N, Young AW, Williams L, Williams SC, Bullmore ET, Gray JA, Brammer MJ: Time courses of left and right amygdalar responses to fearful facial expressions. Hum Brain Mapp 2001; 12:193-202Crossref, Medline, Google Scholar
81. Hariri AR, Bookheimer SY, Mazziota JC: Modulating emotional responses: effects of a neocortical network on the limbic system. Neuroreport 2000; 11:43-48Crossref, Medline, Google Scholar
82. Post RM: Transduction of psychosocial stress into the neurobiology of recurrent affective disorder. Am J Psychiatry 1992; 149:999-1010Link, Google Scholar
83. Drevets WC, Videen TO, Price JL, Preskorn SH, Carmichael T, Raichle ME: A functional anatomical study of unipolar depression. J Neurosci 1992; 12:3628-3641Crossref, Medline, Google Scholar
84. Abercrombie HC, Schaefer SM, Larson CL, Oakes TR, Lindgren KA, Holden JE, Perlman SB, Turski PA, Krahn DD, Benca RM, Davidson RJ: Metabolic rate in the right amygdala predicts negative affect in depressed patients. Neuroreport 1998; 9:3301-3307Crossref, Medline, Google Scholar
85. Amsterdam JD, Mozley PD, Hornig-Rohan M: Assessment of adrenocortical activity in refractory depression: steroid suppression with ketoconazole, in Refractory Depression: Current Strategies and Future Directions. Edited by Nolen WA, Zohar J, Roose JP, Amsterdam JD. Chichester, UK, John Wiley & Sons, 1994, pp 199-210Google Scholar
86. Drevets WC, Frank E, Price JC, Kupfer DJ, Holt D, Greer PJ, Huang Y, Gautier C, Mathis C: PET imaging of serotonin 1A receptor binding in depression. Biol Psychiatry 1999; 46:1375-1387Crossref, Medline, Google Scholar