The Neural Substrates of Affective Processing in Depressed Patients Treated With Venlafaxine
Abstract
OBJECTIVE: The purpose of this study was to use functional magnetic resonance imaging (fMRI) to probe the neural circuitry associated with reactivity to negative and positive affective stimuli in patients with major depressive disorder before treatment and after 2 and 8 weeks of treatment with venlafaxine. Relations between baseline neural activation and response to treatment were also evaluated. METHOD: Patients with major depressive disorder (N=12) and healthy comparison subjects (N=5) were scanned on three occasions, during which trials of alternating blocks of affective and neutral pictorial visual stimuli were presented. Symptoms were evaluated at each testing occasion, and both groups completed self-report measures of mood. Statistical parametric mapping was used to examine the fMRI data with a focus on the group-by-time interactions. RESULTS: Patients showed a significant reduction in depressive symptoms with treatment. Group-by-time interactions in response to the negative versus neutral stimuli were found in the left insular cortex and the left anterior cingulate. At baseline, both groups showed bilateral activation in the visual cortices, lateral prefrontal cortex, and amygdala in response to the negative versus neutral stimuli, with patients showing greater activation in the visual cortex and less activation in the left lateral prefrontal cortex. Patients with greater relative anterior cingulate activation at baseline in response to the negative versus neutral stimuli showed the most robust treatment response. CONCLUSIONS: The findings underscore the importance of the neural circuitry activated by negative affect in depression and indicate that components of this circuitry can be changed within 2 weeks of treatment with antidepressant medication.
Considerable progress has been made recently in the identification of the brain circuitry underlying mood and emotion regulation (see references 1–3 for reviews). This corpus of literature represents a confluence of nonhuman data and human neuroimaging findings. The findings have highlighted the role of different territories of the prefrontal cortex, amygdala, anterior cingulate cortex, and hippocampus in specific components of emotion and emotion regulation. These are also the regions that have been consistently identified to reveal abnormalities in major depressive disorder (3, 4).
Virtually all of the extant neuroimaging studies of depression have examined resting metabolic rate or blood flow with positron emission tomography (PET) or single photon emission computed tomography (SPECT). These studies have focused on differences between patients and healthy comparison subjects when the patients were in the midst of a depressive episode as well as on changes in these parameters of brain function as a consequence of both antidepressant medication and behavioral or psychological treatment (see references 5 and 6 for recent examples). A number of studies have reported normalization of between-group differences in resting measures of brain function (e.g., see review in reference 4). One of the most consistent findings has been that a variety of antidepressants increase the metabolic rate in the dorsolateral prefrontal cortex of depressed individuals, concomitant with symptom remission (e.g., references 7–11).
Abnormalities in the anterior cingulate have also been consistently associated with depression. Decreased activation in the rostral region of the anterior cingulate has been reported in depression, and the magnitude of anterior cingulate activity has been found to predict treatment response, with greater activation during an acute episode predicting more successful response to treatment (12). Treatment-related changes in activation of different regions of the anterior cingulate have also been reported, with the most common finding being an increase in activation in those regions of the anterior cingulate that were hypoactive during an acute episode (see references 7, 11).
Human neuroimaging studies have identified a consistent pattern of activation in response to affective relative to neutral visual stimuli. However, there has not been a systematic study with depressed patients that has examined the effects of antidepressants on changes in regional brain activation in response to an affective challenge. Studies in healthy subjects demonstrate that aversive visual stimuli produce a set of activations that are consistent with hypotheses derived from preclinical studies. Activated regions include the amygdala, regions of the prefrontal cortex, and the anterior cingulate. In addition, affective stimuli produce activation in widespread regions of the visual cortex compared with the presentation of neutral stimuli that are matched on basic physical characteristics (13).
The current study used functional magnetic resonance imaging (fMRI) of depressed patients and nondepressed comparison subjects to examine changes over the course of antidepressant treatment in patterns of neural activity evoked by eliciting affective responses with affective visual stimuli. The basic design of the study included three MRI scanning sessions: the first occurred before treatment when patients with major depressive disorder were acutely depressed. The second scanning session took place 2 weeks after treatment with venlafaxine began, and the third scanning session occurred 6 weeks later or 8 weeks after the beginning of treatment. For comparison, healthy subjects were scanned at the same time intervals as the depressed patients. During each scanning session, a block design was presented that alternated sequences of negative and neutral visual stimuli and positive and neutral visual stimuli in separate trials.
On the basis of prior data and theory, we predicted that patients would differ from healthy subjects in the three regions that we highlighted (amygdala, prefrontal cortex, and anterior cingulate), particularly in response to the negative versus neutral stimuli. We also hypothesized that change over time in these regions would predict the magnitude of treatment response. Finally, on the basis of findings by Mayberg and her colleagues (12) and recent electrophysiological data from our laboratory (14), we predicted that the magnitude of anterior cingulate activation before treatment would predict the magnitude of treatment response such that patients showing the largest anterior cingulate activation to the negative versus neutral stimuli before treatment would show the fewest and least severe symptoms after 8 weeks of venlafaxine treatment.
Method
Subjects
Twenty-one right-handed subjects (15) provided informed consent before participating in this study in accordance with the guidelines of the Human Subjects Committee at the University of Wisconsin Medical School. Subjects were recruited through local newspaper advertisements and were paid for their participation. Data from two subjects were discarded because of various technical difficulties. In addition, data from two of the depressed patients who did not respond to treatment were excluded. The results reported herein are taken from usable data from five comparison subjects (one woman and four men; mean age=27.8 years, SD=10.4) and 12 depressed patients (eight women and four men; mean age=38.17 years, SD=9.3).
Stimulus Selection
Stimuli were selected from the International Affective Picture System (16). This collection of visual stimuli is one of most widely used for the study of affective processes, and there is a large corpus of data demonstrating that these stimuli reliably elicit affective responses (17) in both random (18) and blocked (19, 20) presentations. Negative (e.g., mutilated face), positive (e.g., Olympic victories), and neutral (e.g., wicker basket) stimuli were selected based on z score transformed normative ratings of arousal (low to high) and valence (negative to positive), averaged across male and female ratings (21), in order to derive one set of stimuli that would reliably elicit maximal affective responses from both sexes. As closely as was possible, the positive (N=30) and negative (N=30) stimuli were matched for high, positive arousal ratings and valence ratings that were maximally opposite in sign. The neutral (N=72) stimuli were selected to have low, negative arousal ratings and valence ratings that were approximately zero.
Paradigm
The stimuli were arranged into three viewing trials; the two that were the primary experimental manipulations will be described first. Trials comprised 11 blocks of 12 valence-constant stimuli with the stimuli presented contiguously for 4 seconds each, for a total of 132 stimuli exposures per trial. Each stimulus appeared twice per trial. The stimuli were presented in a quasi-random order such that 1) a given stimulus was never repeated with fewer than 12 intervening stimuli, and 2) novel stimuli would appear up to three-quarters of the way through the trial. The neutral-negative picture viewing trial (hereafter referred to as the negative trial) alternated between neutral and negative stimulus blocks, whereas the neutral-positive picture viewing trial (hereafter referred to as the positive trial) alternated between neutral (different from the neutral stimuli used in the negative trial) and positive stimulus blocks. Each trial began and ended with neutral stimulus blocks. A third trial consisted of the same number of stimuli as the negative and positive trials, but presented in a random order (random trial) and will not be discussed further.
To ensure adequate measurement of baseline MR signal, the first and last stimulus blocks of each trial were 15 seconds longer than the intervening blocks. This was accomplished by presenting each stimulus in those blocks for 5.25 seconds rather than 4 seconds. Finally, to allow time for the MR signal to reach a steady-state, the first stimulus block of each trial was an additional 15 seconds longer, during which the subject viewed the word “Begin.”
The trials were presented in a fixed order to all subjects: random, positive, negative. The positive and negative trials were not counterbalanced because there is evidence that a negative affective state may linger and interfere with the elicitation of a positive affective state (22).
Diagnostic and Experimental Sessions
There were five sessions common to both comparison subjects and patients. The first session involved the patient version of the Structured Clinical Interview for DSM-IV (23) and the nonpatient DSM-III-R version with psychotic screen (24), modified to comply with DSM-IV criteria, for comparison subjects. Comparison subjects were excluded if there was a history of any axis I disorder in themselves or their first-degree relatives. Patients met DSM-IV criteria for major depressive disorder; had no history or current symptoms of mania, bipolar disorder, or psychosis in themselves or their first-degree relatives; and did not currently meet criteria for any other axis I disorder with the exception of specific phobia or dysthymia. In addition, subjects were screened for neurological disorders and MRI safety standards. The first session lasted approximately 1 hour. Four additional sessions commenced approximately 2 weeks after the diagnostic session. Each session began with paper-and-pencil assessments of various cognitive and affective characteristics.
During the first session, subjects underwent a simulated experiment in a mock MR scanner that was a replica of a working MR scanner, including headcoil and digitized scanner sounds presented through earphones. The purpose of this session was to acclimate the subjects to the unique experimental environment by explaining and demonstrating the equipment to be used. A dental impression for use with a bite-bar was obtained during this session. After the bite-bar was fitted and the goggles used for presenting the stimuli adjusted, the subject was fitted with earphones and placed in the mock scanner. After positioning, the subject was presented with a picture trial of the same duration as the experimental trials that consisted of stimuli representative of, but different from, those used in the experimental session. The second session lasted approximately 1 hour.
The third session (approximately 1 week after the simulated session), fourth session (exactly 2 weeks after the third session) and fifth session (exactly 6 weeks after the fourth session) involved the acquisition of both structural and functional imaging data through brain scans. Each scanning session lasted approximately 2 hours. For the patients, there was a psychiatric evaluation and medication adjustment during the week between the first and second scan, and three times during the 6 weeks between the second and third scan. Thus, for comparison subjects there were a total of five sessions for which they were paid a total of $110.00 for their participation, while for the patients there were a total of nine sessions for which they were paid a total of $180.00. Additionally, patients continued to receive treatment and evaluation at no cost for 3 months following the third scan.
Medication Administration
After the first scan, patients began treatment with immediate-release venlafaxine. If patients did not exhibit significant side effects and had not fully responded, the dose was increased according to the following schedule: days 1–4, 18.75 mg b.i.d.; days 5–14, 37.5 mg b.i.d.; days 15–28, 75 mg b.i.d.; days 29–56, 112.5 mg b.i.d. According to this schedule, the second and third scans took place on days 14 and 42, respectively.
Paper-and-Pencil Instruments
At each session common to comparison subjects and patients, we administered the Positive and Negative Affect Schedule (25), the Behavioral Inhibition Scales/Behavioral Activation Scales (26), the short form (27) of the Mood and Anxiety Symptom Questionnaire (28, 29), the trait version of State-Trait Anxiety Index (30), and the Beck Depression Inventory (31). In addition, patients were administered the Hamilton Depression Rating Scale (32) at each session.
Stimulus Presentation and Apparatus
The stimuli were digital images with a resolution of 800×600 pixels and 256 colors and presented under the control of in-house software running on a PC located outside the magnet room and beyond the 10 gauss fringe-field line. The start of the stimulus presentation was manually synchronized with the start of the scanner for each trial. Stimuli were presented by using a Silent Vision system (Avotec, Inc., Jensen Beach, Fla.). This system consists of an MRI-compatible fiber optic projection unit that is located in the scanner room and a monitoring unit located in the scanner control room. Stimuli were presented to the subject through fiber-optic stereoscopic goggles. The goggles were mounted inside the headcoil with a bracket that attached directly to the rungs of the headcoil and were suspended approximately 1.0–1.5 cm above the subject’s eyes. The stimuli subtended approximately 76° of the visual angle in each eye. Viewing the stimuli was akin to looking through binoculars.
A custom bite-bar was used with all subjects to minimize head movement. This device makes use of a dental impression of the upper and lower front teeth made with dental impression compound (Type I, red cakes; Kerr, Inc., Romulus, Mich.) which is affixed to an acrylic plate. This plate is attached to a mounting device that clamped directly to the rungs of the headcoil.
Image Acquisition
The image acquisition protocol consisted of 10 scans, the details of which are provided only for those scans relevant to this report: 1) a sagittal whole-brain T1-weighted spin-echo scan used for subsequent scan prescriptions (scan time=1 min 12 sec); 2) an axial three-dimensional spoiled gradient-recalled echo scan (echo time [TE]/repetition time [TR]=8/35 msec, field of view=24×24 cm, flip angle=30°, number of excitations=1, matrix=256×128, reconstructed to 256×256, 124 slices, slice thickness=0.9–1.2 mm, scan time=9 min 37 sec) graphically prescribed to cover the entire brain volume; 3) a three-dimensional time-of-flight scan (scan time=18 min 44 sec); 4) a coronal three-dimensional spoiled gradient-recalled echo scan (TE/TR=10/35 ms, flip angle=30°, number of excitations=1, field of view=24×24 cm, matrix=256×128, reconstructed to 256×256, 28 slices, slice thickness=1.0 mm, scan time=2 min 27 sec) covering a 28-mm region beginning at approximately the middle of the pons, posteriorly, which provided the image data for localization of the amygdala; 5) a coronal T1-weighted spin-echo scan (TE/TR=20/500, flip angle=90°, number of excitations=1, field of view=24×24 cm, matrix=256×128, reconstructed to 256×256, 23 slices, slice thickness=7 mm, interslice spacing=1 mm, scan time=2 min 24 sec) which provided the slice locations from which functional image data would be acquired. This scan was manually prescribed such that one slice was centered on the amygdala. This was defined such that the posterior edge of this slice was positioned 1 mm anterior to the location where the hippocampus could first be identified in the image data acquired in scan 4; 6) a coronal gradient-echo dual-echo scan (scan time=4 min 30 sec); 7) a coronal T2*-weighted gradient-echo echo-planar scan (TE/TR=50/3000 msec, flip angle=90°, number of excitations=1, field of view=24×24 cm, matrix=64×64, same interleaved slice parameters as scan 5, 1 image per slice, scan time=3 min) based on the method of Mansfield (33) was used to acquire functional image data. The pulse sequence used for this scan was customized to use a Shinnar-LeRoux (34) slice-selective pulse, which yielded sharper slice-select boundaries than those obtainable with standard pulses, thus minimizing slice cross-talk and increasing the signal-to-noise ratio (35). Because the image data for the functional scans were reconstructed offline and, therefore, not visualized during image acquisition, the image data from scan 7 were reconstructed online and reviewed for image quality. The final three scans provided the functional image data by using the same imaging parameters as scan 7 except that 191 images were acquired from each slice location (scan time=9 min 33 sec).
Image data were acquired on a General Electric (Waukesha, Wis.) EchoSpeed 1.5 Tesla scanner equipped with high-speed, whole-body gradients (2.2 g/cm, 100 msec rise time) and a standard clinical whole-head transmit-receive quadrature birdcage headcoil.
Data Preprocessing
The functional image data were reconstructed offline by using in-house code. All other image data were reconstructed online. The functional image data were reconstructed without the application of any spatial filters to the k-space data (36) and with a band-pass filter to correct for asymmetries in the analog-to-digital signal conversion (37).
The data from each trial for each subject were subject to two preprocessing procedures. First, each time series was “motion corrected” with the image realignment algorithm in SPM 99 (Wellcome Department of Cognitive Neurology). The first image in each time series was used as the reference image, with bilinear interpolation for resampling. Second, each time series was coregistered to a custom-made template that was normalized to match the SPM/MNI canonical EPI template. The reason for using a custom template was that it better represents the signal distribution (e.g., susceptibility artifact) in our data and yielded a better normalization of each subject’s data into the SPM/MNI coordinate space.
Single-Subject Analyses
To identify paradigm-dependent MR signal changes, the time series from each voxel in the magnitude image data were modeled by a boxcar reference function convolved with a hemodynamic reference function which corresponded to the alternating stimulus blocks using SPM 99 (Wellcome Department of Cognitive Neurology). The first five images from each trial were discarded to ensure that only image data acquired during MR signal steady-state were analyzed. In addition, to impose equal length epochs (stimulus blocks), the first and last five images were discarded. Thus, for each trial, at the subject-wise level, 176 images were included in estimation procedure.
Group-by-Time Interaction Analyses
The primary analyses of interest in this study were the group-by-time interactions, since these analyses highlighted changes in activation patterns in the patients (presumably modulated by treatment and response) for which the effects of initial and repeated exposure to the stimuli are controlled. The group-by-time interaction analyses were conducted by submitting the contrast image for each subject, for each trial, for each time (e.g., comparison subject 1, negative trial, time 1) to a second-level, random-effects analysis (38).
Self-Report and Hamilton Depression Scale Correlates
We examined the association between self-report indexes, the Hamilton depression scale scores, and regions of interest that demonstrated significant group-by-time interactions. The activation-based dependent measures were the voxel values from each subject at the regional maxima identified in the group-by-time analyses.
Results
Self-Report and Symptom Changes in Patients
Patients showed a significant linear decline in Hamilton depression scale scores across the three assessment points (F=55.4, df=2, 22, p<0.0001). Figure 1 illustrates these changes. As can be seen, there is nearly a mean 70% reduction in Hamilton depression scale scores from the initial assessment to the 8-week assessment. We also examined changes in the Positive and Negative Affect Schedule in patients over time. This measure was also given to the healthy comparison subjects at the same time interval so that we could compare possible changes over time in each group. Figure 2 illustrates that the comparison subjects reported significantly higher levels of dispositional positive affect both before treatment and after 8 weeks, whereas the patients reported more negative than positive affect before treatment and the reverse after 8 weeks. The group-by-valence-by-time interaction was significant (F=23.4, df=1, 15, p<0.0001) and was accounted for by changes in the patient group only.
fMRI Data: Group-by-Time Interactions
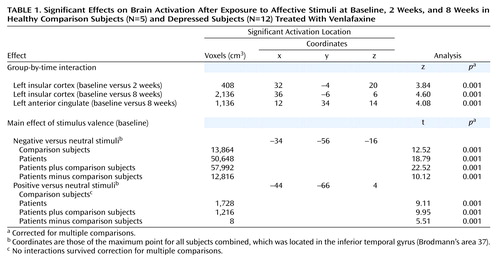
We first investigated the brain volume for regions that showed a significant group-by-time interaction for both the positive versus neutral stimuli trial and the negative versus neutral stimuli trial. There were no group-by-time interactions for the positive versus neutral stimuli trial that survived corrections for multiple comparisons. We thus focused on the negative versus neutral stimuli trial. The only region that showed a statistically significant interaction for the comparison of baseline and 2-week values was the left insular cortex (z=3.84, p<0.001) (Table 1). As can be seen from Figure 3, patients had significantly less relative activation in this region in response to negative versus neutral stimuli at baseline. After 2 weeks of treatment, this difference was completely eliminated. After 8 weeks, the patients actually show greater relative activation relative to the healthy comparison subjects, although this difference was not significant (Figure 4) (z=4.60 for baseline versus week 8 interaction in the left insular cortex).
An interaction in the same direction was found for the left anterior cingulate cortex (z=4.08, p<0.001). At baseline, patients showed relatively less activation in this region relative to the healthy comparison subjects in response to negative versus neutral stimuli while after 8 weeks this effect was reversed (Figure 5). No other brain regions demonstrated significant group-by-time interactions for either the baseline versus week 2 or baseline versus week 8 comparisons.
Baseline Valence and Group Effects
We examined the effects of negative versus neutral and positive versus neutral pictures at baseline both across patients and comparison subjects and separately within each group. As predicted on the basis of previous research (see reference 1 for review), there were three major foci of activation produced by viewing negative compared with neutral stimuli: extensive regions of the visual cortex, the lateral prefrontal cortex (with a suggestion of greater right-sided activation), and bilateral activation in the amygdala. Figure 6 illustrates the large extent of the bilateral visual cortex activation in both the comparison subjects and the patients. The patients exhibited a significantly larger magnitude and greater extent of activation in visual cortical regions relative to the healthy comparison subjects (t=10.12, p<0.001).
Activation in the lateral prefrontal cortex was found for both patients and comparison subjects, and Figure 7 illustrates that this activation was greater on the right compared with the left hemisphere. The comparison subjects and patients did not differ in right-sided prefrontal cortex activation, but the patients showed significantly less activation in left-sided prefrontal cortex regions relative to the comparison subjects.
As we predicted on the basis of our earlier findings (39), negative pictures elicited a significantly larger bilateral amygdala signal compared with neutral pictures across groups (at the maximum point: t=7.69, p<0.001) (Figure 8). There were no significant differences in amygdalar activation between groups.
The only significant activation produced by the positive versus neutral pictures was in the visual cortex, although the magnitude and extent of the activation was less than was found in response to negative pictures.
Relationship Between MR Signal and Symptom Change
Using the maxima of the activation clusters uncovered in the aforementioned group-by-time analyses, we examined whether signal change in these regions before treatment was associated with symptom severity in response to treatment after 2 and 8 weeks, and whether changes in brain activity at these times, compared with pretreatment, were associated with change in symptom severity in response to treatment. The magnitude of activation in left anterior cingulate at baseline was found to predict treatment response. Figure 9 displays the data for the Mood and Anxiety Symptom Questionnaire general distress scale. As can be seen from this figure, those patients with greater relative anterior cingulate activation to the negative versus neutral pictures at baseline show the fewest and least severe symptoms after 8 weeks. The same basic effect was observed for the Hamilton depression scale, although it failed to attain significance (r=–0.46). To ascertain whether patients with higher levels of pretreatment activation in this left anterior cingulate cluster were simply less depressed at baseline, we examined the correlations between the magnitude of activation in this cluster at baseline and measures of depression severity and symptoms at time baseline. None of the correlations with any of the symptom measures were significant (all p>0.33).
Discussion
This study is the first to demonstrate reliable changes in MR signal in response to emotion activation in depressed patients treated with antidepressant medication. These changes were supported by the reliable group-by-time interactions in response to negative versus neutral stimuli. After only 2 weeks of treatment, we observed a significant change in patients versus comparison subjects in the left insular cortex. While patients show relatively less activation in this region at baseline in response to negative versus neutral stimuli, after 2 weeks of venlafaxine treatment this difference was eliminated. A similar change was found for the left anterior cingulate, where the patients displayed less activation in this region at baseline but showed an increase in activation with treatment. Unlike the insular cortex where the treatment effect was present at 2 weeks, the anterior cingulate change emerged after 8 weeks of treatment.
Both the insular and anterior cingulate regions have previously been implicated in the circuitry of emotion and emotion regulation (1). The fact that depressed patients had relatively less activation in these regions at baseline in response to negative versus neutral stimuli is consistent with the notion that during an acute depressive episode, patients with major depressive disorder are hyporesponsive in the central circuitry associated with affective processing. This finding is consistent with other recent studies that assessed regional glucose metabolism with PET during a resting baseline state (e.g., reference 11), although the effects reported herein were considerably more robust in establishing a different pattern of change in the depressed patients relative to the healthy comparison subjects. It is noteworthy that in none of the recent studies that have examined changes in resting glucose metabolism in depressed patients with treatment has the interaction of group (depressed/comparison)-by-time (pretreatment/posttreatment) been assessed (e.g., references 5, 11). The failure to explicitly test for an interaction in these studies may have obscured their sensitivity in finding group differences over time as a function of treatment. In addition, changes in the activation with treatment for depression may only be uncovered when affective challenges are used rather than just examining resting state measures.
At baseline, both patients and comparison subjects showed activation in the lateral prefrontal cortex (greater right than left), amygdala, and visual cortices in response to negative versus neutral stimuli. The increased activation in the visual cortices in response to negative versus neutral stimuli is likely a function of feedback from the amygdala. Amaral (40) has reviewed the extensive anatomical findings in the primate brain that reveal heavy projections from the amygdala to extensive regions within the visual system. Group differences at baseline were found in the left lateral prefrontal cortex, where patients showed less activation than comparison subjects, and in the visual cortices, where patients demonstrated a larger magnitude and greater extent of activation. The greater activation in the visual cortices of the patients may be a function of projections from the amygdala that may increase the gain for potentially threatening visual stimuli. It is of interest that the group difference in prefrontal cortex activation emerged only in the negative trial (i.e., negative versus neutral stimuli). The fact that depressed patients exhibited less left prefrontal cortex activation in this condition may reflect the decreased capacity for actively regulating the negative affect presumed to be elicited by the pictures. Across a number of different kinds of studies, we have found that subjects with greater activation in the left prefrontal cortex exhibit increased capacity to regulate negative affect in a task that explicitly assessed the capacity to voluntarily regulate negative affect (see references 41, 42 for review). It will be important in future research to include objective measures of emotion regulation (41) to ascertain the extent to which variations in prefrontal cortex activation are associated with regulatory skill.
Perhaps of greatest import is our findings showing relations between MR signal change and symptoms. On the basis of prior data suggesting that pretreatment levels of baseline anterior cingulate activation are associated with treatment response (12, 14), we examined whether similar effects were present for anterior cingulate activation in response to the negative versus neutral stimuli at baseline. Our data indicated that those patients with a larger relative magnitude anterior cingulate response to negative versus neutral stimuli at baseline showed the greatest response to treatment as reflected in symptom measures administered after 8 weeks.
Recent data and theory suggest that the anterior cingulate is activated by response conflict (43). We have argued that the rostral anterior cingulate is activated by affective response conflict (3). Consistent with this view, the disparity between an individual’s mood and the expectations of daily living are associated with anterior cingulate activation in the subgroup of depressed patients most likely to benefit from treatment, since these are the patients who can issue a call for further processing to resolve the conflict (3). At the pretreatment assessment, the depressed patients had lower levels of relative anterior cingulate activation relative to healthy comparison subjects in response to negative versus neutral stimuli, suggesting that they may be less affected by the negative stimuli. Among depressed patients, the affective response elicited by the negative stimuli may be less discrepant from their daily mood relative to normal comparison subjects.
Caveats and Limitations
It is important to underscore the fact that this was an open-label study with only a single treatment group. Thus, we do not know if the changes in brain activity observed herein are associated with venlafaxine treatment, with symptom remission per se, or with some combination of both. Designs that include a natural history control condition or that include a behavioral intervention are required to disentangle the contributions of these different factors to the overall findings. In a recent SPECT study that assessed resting blood flow changes with venlafaxine and interpersonal psychotherapy, Martin et al. (6) reported somewhat different patterns of changes with each of these two different forms of treatment, thus suggesting that the changes produced by venlafaxine are not simply a function of symptom reduction per se. Also not addressed by fMRI methods are the mechanisms by which venlafaxine produces alterations in neural activation. The use of positron emission tomography ligands sensitive to the serotonin and norepinephrine systems will be required, in conjunction with fMRI measures of activation change, to mechanistically address how venlafaxine might be producing the selective changes observed herein.
Another limitation of this study is the small number of comparison subjects who were assessed. However, despite the fact that the small study group size decreased our power to detect group differences, a number of predicted differences nevertheless were found. Given the heterogeneity of depression, it will be imperative in the future to conduct large sample size studies that are explicitly designed to address this issue. It may well be that reliable heterogeneity in activation patterns will be found that is not reflected in current diagnostic nosology (see reference 3). The characterization of such heterogeneity will require much larger studies that include objective measures of affective reactivity and treatment outcomes.
Conclusions
This study is the first fMRI study to investigate the circuitry of emotion in patients with major depressive disorder and to examine how this circuitry is modified by antidepressant medication. Future research is required to investigate the associations between changes in the featured circuitry and objective measures of affective responding in the laboratory.
 |
Received Jan. 25, 2002; revision received July 31, 2002; accepted Aug. 8, 2002. From the Departments of Psychology and Psychiatry, University of Wisconsin; the University of Wisconsin Medical School, Madison; and the W.M. Keck Laboratory for Functional Brain Imaging and Behavior, Madison, Wisc. Address reprint requests to Dr. Davidson, Laboratory for Affective Neuroscience, Department of Psychology, University of Wisconsin, 1202 West Johnson St., Madison, WI 53706; [email protected] (e-mail). Supported by a National Science Foundation Graduate Research Fellowship (W.I.); an Established Investigator Award from the National Alliance for Research on Schizophrenia and Depression (R.J.D.); NIMH grants MH-43454 and MH-40747 (R.J.D.); NIMH center grant MH-52354 (R.J.D.); NIMH Research Scientist Award MH-00875 (R.J.D.); and funds provided by the HealthEmotions Research Institute (N.H.K., R.J.D.) and Wyeth-Ayerst Laboratories (N.H.K.). The authors thank Jennifer L. Orendi for assistance in data collection, Gemma Warner and Kate Blood for administrative assistance, Alexander J. Shackman for advice and comments, and the members of our laboratory for their support. Steven K. Sutton was instrumental in launching this study.

Figure 1. Hamilton Depression Rating Scale Scores of 12 Depressed Patients Before Treatment and After 2 and 8 Weeks of Treatment With Venlafaxinea
aSignificant linear decline in scores across the three assessment points (F=55.4, df=2, 22, p<0.0001).

Figure 2. Dispositional Affect at Baseline and 8 Weeks Among Healthy Comparison Subjects and Depressed Patients Treated With Venlafaxine

Figure 3. Change Over 2 Weeks in Left Insular Cortex Activation After Exposure to Negative Relative to Neutral Stimuli in Healthy Comparison Subjects and Depressed Patients Treated With Venlafaxine

Figure 4. Change Over 8 Weeks in Left Insular Cortex Activation After Exposure to Negative Relative to Neutral Stimuli in Healthy Comparison Subjects and Depressed Patients Treated With Venlafaxine

Figure 5. Change Over 8 Weeks in Left Anterior Cingulate Cortex Activation After Exposure to Negative Relative to Neutral Stimuli in Healthy Comparison Subjects and Depressed Patients Treated With Venlafaxine

Figure 6. Visual Cortex Activation After Exposure to Negative Relative to Neutral Stimuli in Healthy Comparison Subjects (N=5) and Depressed Patients (N=12) at First Assessmenta
aThe maximum point for all subjects combined was located in the inferior temporal gyrus (Brodmann’s area 37; x=–34, y=–56, z=–16).

Figure 7. Lateral Prefrontal Cortex Activation After Exposure to Negative Relative to Neutral Stimuli in Healthy Comparison Subjects and Depressed Subjects at First Assessmenta
aActivation in the right hemisphere was significantly greater than activation in the left hemisphere (F=11.40, df=1, 15, p<0.005). The two groups activated right prefrontal cortex regions comparably but differed significantly in left prefrontal cortex activation, with the patients showing significantly less activation (t=4.35, df=15, p<0.001). The coordinates for the maximum point for all subjects combined were as follows: x=43, y=10, z=24.

Figure 8. Amygdala Activation After Exposure to Negative Relative to Neutral Stimuli in Healthy Comparison Subjects (N=5) and Depressed Subjects (N=12) at First Assessmenta
aThe coordinates for the maximum point for all subjects combined were as follows: x=–18, y=–6, z=–10 (right); x=20, y=–4, z=–14 (left).

Figure 9. Response of Depressed Patients to Venlafaxine in Relation to Left Anterior Cingulate Activation at Baseline After Exposure to Negative Relative to Neutral Stimulia
aPatients with greater relative anterior cingulate activation at baseline exhibited the fewest and least severe symptoms after 8 weeks of treatment with venlafaxine.
1. Davidson RJ, Irwin W: The functional neuroanatomy of emotion and affective style. Trends Cogn Sci 1999; 3:11-21Crossref, Medline, Google Scholar
2. Davidson RJ, Putnam KM, Larson CL: Dysfunction in the neural circuitry of emotion regulation—a possible prelude to violence. Science 2000; 289:591-594Crossref, Medline, Google Scholar
3. Davidson RJ, Pizzagalli D, Nitschke JB, Putnam KM: Depression: perspectives from affective neuroscience. Ann Rev Psychol 2002; 53:545-574Crossref, Medline, Google Scholar
4. Drevets WC: Neuroimaging and neuropathological studies of depression: implications for the cognitive-emotional features of mood disorders. Curr Opin Neurobiol 2001; 11:240-249Crossref, Medline, Google Scholar
5. Brody AL, Saxena S, Mandelkern MA, Fairbanks LA, Ho ML, Baxter LR: Brain metabolic changes associated with symptom factor improvement in major depressive disorder. Biol Psychiatry 2001; 50:171-178Crossref, Medline, Google Scholar
6. Martin SD, Martin E, Rai SS, Richardson MA, Royall R: Brain blood flow changes in depressed patients treated with interpersonal psychotherapy or venlafaxine hydrochloride: preliminary findings. Arch Gen Psychiatry 2001; 58:641-648Crossref, Medline, Google Scholar
7. Mayberg HS, Liotti M, Brannan SK, McGinnis S, Mahurin RK, Jerabek PA, Silva JA, Tekell JL, Martin CC, Lancaster JL, Fox PT: Reciprocal limbic-cortical function and negative mood: converging PET findings in depression and normal sadness. Am J Psychiatry 1999; 156:675-682Abstract, Google Scholar
8. Buchsbaum MS, Wu J, Siegel BV, Hackett E, Trenary M, Abel L, Reynolds C: Effect of sertraline on regional metabolic rate in patients with affective disorder. Biol Psychiatry 1997; 41:15-22Crossref, Medline, Google Scholar
9. Baxter LRJ, Schwartz JM, Phelps ME, Mazziotta JC, Guze BH, Selin CE, Gerner RH, Sumida RM: Reduction of prefrontal cortex glucose metabolism common to three types of depression. Arch Gen Psychiatry 1989; 46:243-250Crossref, Medline, Google Scholar
10. Martinot JL, Hardy P, Feline A, Huret JD, Mazoyer B, Attar-Levy D Pappata S, Syrota A: Left prefrontal glucose hypometabolism in the depressed state: a confirmation. Am J Psychiatry 1990; 147:1313-1317Link, Google Scholar
11. Kennedy SH, Evans KR, Kruger S, Mayberg HS, Meyer JH, McCann S, Arifuzzman AI, Houle S, Vaccarino FJ: Changes in regional brain glucose metabolism measured with positron emission tomography after paroxetine treatment of major depression. Am J Psychiatry 2001; 158:899-905Link, Google Scholar
12. Mayberg HS, Brannan SK, Mahurin RK, Jerabek PA, Brickman JS, Tekell JL, Silva JA, McGinnis S, Glass TG, Martin CC, Fox PT: Cingulate function in depression: a potential predictor of treatment response. Neuroreport 1997; 8:1057-1061Crossref, Medline, Google Scholar
13. Bradley BP, Mogg K, Falla SJ, Hamilton LR: Attentional bias for threatening facial expressions in anxiety: manipulation of stimulus duration. Cogn Emotion 1998; 12:737-753Crossref, Google Scholar
14. Pizzagalli D, Pascual-Marqui RD, Nitschke JB, Oakes TR, Larson CL, Abercrombie HC, Schaefer SM, Koger JV, Benca RM, Davidson RJ: Anterior cingulate activity as a predictor of degree of treatment response in major depression: evidence from brain electrical tomography analysis. Am J Psychiatry 2001; 158:405-415Link, Google Scholar
15. Chapman LJ, Chapman JP: The measurement of handedness. Brain Cogn 1987; 6:175-183Crossref, Medline, Google Scholar
16. Center for the Study of Emotion and Attention: The International Affective Picture System. Gainesville, Fla, University of Florida, Center for Research in Psychopathology, 1995Google Scholar
17. Lang PJ, Bradley MM, Cuthbert BN: Emotion, attention and the startle reflex. Psychol Rev 1990; 97:377-398Crossref, Medline, Google Scholar
18. Lang PJ, Greenwald MK, Bradley MM, Hamm AO: Looking at pictures: affective, facial, visceral, and behavioral reactions. Psychophysiology 1993; 30:261-273Crossref, Medline, Google Scholar
19. Bradley MM, Cuthbert BN, Lang PJ: Picture media and emotion: effects of a sustained affective context. Psychophysiology 1996; 33:662-670Crossref, Medline, Google Scholar
20. Sutton SK, Davidson RJ, Donzella B, Irwin W, Dottl DA: Manipulating affective state using extended picture presentations. Psychophysiology 1997; 34:217-226Crossref, Medline, Google Scholar
21. Lang PJ, Bradley MM, Cuthbert BN: International Affective Picture System (IAPS): Technical Manual and Affective Ratings. Gainesville, Fla, University of Florida, Center for Research in Psychophysiology, 1997Google Scholar
22. Ekman P, Freisen WV, Ancoli S: Facial signs of emotional experience. J Pers Soc Psychol 1980; 39:1125-1134Crossref, Google Scholar
23. First MB, Spitzer RL, Gibbon M, Williams JBW: Structured Clinical Interview for DSM-IV Axis I and II Disorders, version 2.0. New York, New York State Psychiatric Institute, Biometrics Research, 1995Google Scholar
24. Spitzer RL, Williams JBW, Gibbon M, First MB: Structured Clinical Interview for DSM-III-R—Non-Patient Edition (SCID-NP, Version 1.0). Washington, DC, American Psychiatric Press, 1990Google Scholar
25. Watson D, Clark LA, Tellegen A: Development and validation of brief measures of positive and negative affect: the PANAS scales. J Pers Soc Psychol 1988; 54:1063-1070Crossref, Medline, Google Scholar
26. Carver CS, White TL: Behavioral inhibition, behavioral activation and affective responses to impending reward and punishment: the BIS/BAS scales. J Pers Soc Psychol 1994; 67:319-333Crossref, Google Scholar
27. Watson D, Walker LM: The long-term stability and predictive validity of trait measures of affect. J Pers Soc Psychol 1996; 70:567-577Crossref, Medline, Google Scholar
28. Watson D, Clark LA, Weber K, Assenheimer JS, Strauss ME, McCormick CM: Testing a tripartite model, I: evaluating the convergent and discriminant validity of anxiety and depression symptom scales. J Abnorm Psychol 1995; 104:3-14Crossref, Medline, Google Scholar
29. Watson D, Clark LA, Weber K, Assenheimer JS, McCormick CM, Strauss ME: Testing a tripartite model, II: exploring the symptom structure of anxiety and depression in student, adult, and patient samples. J Abnorm Psychol 1995; 104:15-25Crossref, Medline, Google Scholar
30. Spielberger CD, Gorsuch RL, Lushene RD: STAI Manual. Palo Alto, Calif, Consulting Psychologists Press, 1970Google Scholar
31. Beck AT, Rush AJ, Shaw B, Emery G: Cognitive Therapy of Depression. New York, Guilford, 1979Google Scholar
32. Hamilton M: A rating scale for depression. J Neurol Neurosurg Psychiatry 1960; 23:56-62Crossref, Medline, Google Scholar
33. Mansfield P: Multi-planar image formation using NMR spin echos. J Physics 1977; 10(suppl c):L55-L58Google Scholar
34. Pauly J, Le Roux PL, Nishimura D, Macovski A: Parameter relations for the Shinnar-Le Roux selective excitation pulse design algorithm. IEEE Trans Med Imaging 1991; 10:53-65Crossref, Medline, Google Scholar
35. Mock BJ: Development and evaluation of data collection and analysis strategies for functional magnetic resonance imaging techniques (fMRI). Diss Abstr Int 1997; 59:1757Google Scholar
36. Lowe MJ, Sorenson JA: Spatially filtering functional magnetic resonance imaging data. Magn Reson Med 1997; 37:723-729Crossref, Medline, Google Scholar
37. King KF, Crawford CR, Maier JU: Correction for filter-induced ghosts in echo planar imaging (abstract). Proc Soc Magn Reson Med 1995; 3:105Google Scholar
38. Friston KJ, Holmes AP, Worsley KJ: How many subjects constitute a study? Neuroimage 1999; 10:1-5Crossref, Medline, Google Scholar
39. Irwin W, Davidson RJ, Lowe MJ, Mock BJ, Sorenson JA, Turski PA: Human amygdala activation detected with echo-planar functional magnetic resonance imaging. Neuroreport 1996; 7:1765-1769Crossref, Medline, Google Scholar
40. Amaral DG, Price JL, Pitkanen A, Carmichael ST: Anatomical organization of the primate amygdaloid complex, in The Amygdala: Neurobiological Aspects of Emotion, Memory, and Mental Dysfunction. Edited by Aggleton JP. New York, Wiley-Liss, 1992, pp 1-66Google Scholar
41. Jackson DC, Malmstadt JR, Larson CL, Davidson RJ: Suppression and enhancement of emotional responses to unpleasant pictures. Psychophysiology 2000; 37:515-522Crossref, Medline, Google Scholar
42. Davidson RJ, Jackson DC, Kalin NH: Emotion, plasticity, context, and regulation: perspectives from affective neuroscience. Psychol Bull 2000; 126:890-909Crossref, Medline, Google Scholar
43. Miller EK, Cohen JD: An integrative theory of prefrontal cortex function. Annu Rev Neurosci 2001; 24:167-202Crossref, Medline, Google Scholar