Relationships Among the Metabolic Patterns That Correlate With Mnemonic, Visuospatial, and Mood Symptoms in Parkinson’s Disease
Abstract
OBJECTIVE: A multivariate analysis of baseline brain metabolism was used to investigate the relationships among pathophysiological mechanisms responsible for cognitive dysfunction and dysphoria in nondemented patients with Parkinson’s disease. METHOD: Using [18F]fluorodeoxyglucose positron emission tomography and neuropsychological tests, the authors studied 15 nondemented patients who had Parkinson’s disease without major depression (DSM-III-R). Their mean age was 59.2 years (SD=9.2), the mean rating of Parkinson’s disease stage (Hoehn and Yahr scale) was 3.3 (SD=0.9), and all had Mini-Mental State Examination scores of 24 or higher. To identify specific regional patterns of brain metabolism associated with abnormal cognitive and mood functioning, the data were analyzed by using brain-behavior partial least squares. This multivariate voxel-based analysis allowed detection of significant topographic patterns of metabolic activity and quantification of the extent to which each topographic pattern correlated with scores on mnemonic, visuospatial, and dysphoric tests. RESULTS: Two significant, independent topographic patterns were identified. Pattern 1 included parieto-occipito-temporal and medial temporal brain regions, and pattern 2 included the lateral frontal and anterior limbic cortex. Patterns 1 and 2 exhibited a double dissociation in their behavioral correlates: pattern 1 correlated with both visuospatial and mnemonic functioning but not with dysphoria; pattern 2 correlated with dysphoria but not with the cognitive measures. CONCLUSIONS: The authors used the independence of topographic patterns and the size of correlations between topographic patterns and behavior to infer relationships among the pathophysiological processes responsible for the correlations. The finding that mildly abnormal mnemonic and visuospatial functioning correlated with the same topographic pattern suggests that a common pathophysiology underlies this marker of cognition in Parkinson’s disease. By contrast, the independence of the two topographic patterns supports the notion that different mechanisms underlie cognitive and dysphoric symptoms in nondemented patients with Parkinson’s disease.
Cognitive and affective abnormalities are common in Parkinson’s disease, but their underlying pathophysiology remains speculative (1–3). Clinical dementia and major depression, with prevalences in Parkinson’s disease of about 30% (4) and 20% (5), respectively, are the conditions most studied. However, the large subgroup of patients with Parkinson’s disease without dementia or major depression suffer from a wide range of cognitive (6) and dysphoric (5) symptoms. The cognitive symptoms occur across many domains (memory, visuospatial, attention) and have been conceived etiologically as “dysexecutive.” Dysphoria in this context includes dysthymia or depressive symptoms not severe or sustained enough to meet criteria for major depression. The mechanisms responsible for these cognitive and dysphoric symptoms are largely unknown and may not be quantitatively and/or qualitatively identical to those responsible for dementia and major depression (1–3).
It is unlikely that these behavioral symptoms are simply a response to motor loss, as onset, incidence, and severity of motor symptoms in Parkinson’s disease appear not to be associated with the presence of cognitive dysfunction or depression (6, 7). Unlike major depression, minor depression does not appear to be associated with cognitive decline (8), suggesting that cognitive dysfunction and dysphoria have different underlying pathophysiological mechanisms. While dopamine replacement is highly successful in reversing the motor symptoms of Parkinson’s disease, whether such therapy has any benefit for behavioral symptoms remains controversial (1, 2, 9–13). Such epidemiological and therapeutic data suggest that dopaminergic dysfunction alone is not the primary pathophysiological mechanism underlying cognitive and dysphoric symptoms in Parkinson’s disease (10). Nondemented patients with Parkinson’s disease harbor several candidate pathological mechanisms besides dopamine depletion that can cause behavioral symptoms, including dysfunction within noradrenergic (14), serotonergic (15), and cholinergic (16) systems and neural loss from Lewy bodies and plaques and tangles (17). The aim of this study was to identify quantifiable biological markers associated with cognitive and dysphoric symptoms in patients with Parkinson’s disease. The long-term goal is to use such markers in future research to identify the specific pathophysiology (or pathophysiologies) underlying cognitive and dysphoric symptoms and thus to facilitate novel, rational therapeutics in the earliest stages of Parkinson’s disease.
In this study, we measured brain function using [18F]fluorodeoxyglucose (FDG) and positron emission tomography (PET) in resting nondemented patients with Parkinson’s disease without major depression. We used brain-behavior partial least squares, a multivariate voxel-based approach (18–20), to identify orthogonal topographical patterns of glucose metabolism that correlated significantly with mnemonic, visuospatial, and dysphoric manifestations of Parkinson’s disease. Because we evaluated metabolic data during rest, not activation, the topographic patterns represent patterns of neuropil metabolism during rest, rather than networks of regions subserving a particular behavior (see Discussion). A metabolic pattern at rest (topographic pattern) is caused by (is a marker for) an underlying (patho)physiological process. As the topographic patterns are orthogonal, their underlying (patho)physiological processes are distinct. Thus, if multiple abnormal behaviors correlate with a single topographic pattern, the behaviors likely share a common pathophysiological process. Conversely, if correlations between a topographic pattern and the behaviors are doubly dissociated, it is likely that the behaviors have separate and distinct pathophysiological processes. This level of interpretation is made possible by a multivariate analysis that allows the simultaneous assessment of the relationships among multiple behaviors and multiple metabolic patterns. To our knowledge, such an interpretation has not been attempted previously in studies using univariate analyses (21–27). In summary, we used topographic patterns as biological markers to develop evidence for or against the null hypothesis that memory, visuospatial function, and dysphoria are associated with a common topographic pattern (pathological mechanism) in nondemented patients with Parkinson’s disease without major depression.
Method
Patients
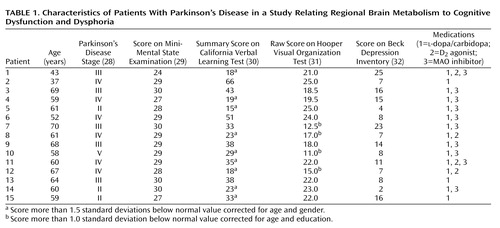
We studied 15 moderately affected patients with Parkinson’s disease; their mean age was 59.2 years (SD=9.2), and without medication their mean score for Parkinson’s disease stage, according to the Hoehn and Yahr scale (28), was 3.3 (SD=0.9). Each subject had a clinical interview to determine that he or she did not meet the DSM-III-R criteria for depression or dementia, and all had scores of 24 or higher on the Mini-Mental State Examination (MMSE) (29) (mean=28.5, SD=1.6) (Table 1). All but one of the patients were right-handed. Parkinson’s disease was diagnosed if the patient had pure parkinsonism without known causative factors and did not have atypical features such as supranuclear gaze abnormalities, ataxia, or limb apraxia. All patients had a good response to dopamine replacement therapy, defined as an improvement of 20% or more in ratings on the motor function subscale of the Unified Parkinson"s Disease Rating Scale (33). Neuropsychological tests were performed at a second interview within 2 weeks of the PET scan.
To establish a profile of glucose metabolism at rest, the scans of the Parkinson’s disease group were compared to those of 14 age-matched right-handed normal subjects (mean age=59.4 years, SD=2.7) (t=0.12, df=27, p=0.90, Student’s t test, two-tailed). In clinical interviews, these subjects did not meet the DSM-III-R criteria for depression or dementia, and neurological examination revealed no parkinsonism. Ethical permission for these studies was obtained from the institutional review board of North Shore University Hospital, Manhasset, N.Y. All patients gave written informed consent after the procedures had been fully explained.
Neuropsychological Assessment
While taking medication, all of the patients with Parkinson’s disease underwent neuropsychological evaluation within 2 weeks of PET scanning. Because patients with Parkinson’s disease are known to have difficulty performing memory and visuospatial tasks, particularly if the tasks include an executive component (1, 2), we selected tasks that, in addition to memory or spatial skills, required substantial executive function for successful completion. In addition, to minimize potential confounds stemming from motoric dysfunction in these patients, we chose tasks that did not require limb movement. These conditions were met by the California Verbal Learning Test (30) and the Hooper Visual Organization Test (31). To avoid biasing our analysis toward specific brain functions by using test subscores, we used the summary score on the California Verbal Learning Test as a broad index of learning and memory. Similarly, the raw score on the Hooper Visual Organization Test was used as a general descriptor of visuospatial functioning. Thus, these composite measures include sources of variation due to executive functioning as well as variation attributable to either memory or visuospatial functioning. Further, we have previously demonstrated that patients with Parkinson’s disease have difficulty with these tasks (34). The total score on the Beck Depression Inventory (32) was used to evaluate dysphoria. These values for individual patients are provided in Table 1.
The California Verbal Learning Test contains “Monday” shopping lists, each of which contains the same 16 common shopping items. The Monday lists were presented five times in a fixed order. The California Verbal Learning Test summary score is a cumulative score of correctly recalled items across the five trials. An important feature of the California Verbal Learning Test is that, unknown to the subject, the 16 items can be classified into four groups, i.e., herbs, tools, fruits, and clothing. The order of presentation is not arranged by category. If a subject perceives this unstated fact and organizes items by category, item recall is improved. The functions needed to hold words in working memory such that unstated rules can be perceived and then used are considered executive.
The Hooper Visual Organization Test is a fragmented-figure test in which subjects are required to mentally reassemble illogically arranged fragments of drawings into a complete whole. Thus, the test involves complex visuospatial matching and organization in addition to simple shape perception. To perceive the drawing as a single picture, a subject needs to hold the component shapes in working memory while they are mentally rotated, moved, and matched until the picture can be visualized. These functions are considered to have a high executive load.
The Beck Depression Inventory is a 21-item self-report inventory. Subjects are asked to rate the extent to which they perceive themselves as having had signs and symptoms associated with depression over the previous week.
PET Scan
The patients and comparison subjects fasted overnight before the PET scan. For the Parkinson’s disease group all antiparkinsonian medications were discontinued at least 12 hours before the PET scan. At the time of scanning, all of the Parkinson’s disease subjects were rated on the Hoehn and Yahr scale (28). The PET studies were performed by using an Advance tomograph (General Electric Medical Systems, Milwaukee). This 18-ring bismuth germanate whole-body tomograph produced 35 slices with an axial field of view of 15 cm and a resolution of 4.2 mm (full width at half maximum) in all directions.
Each PET study was performed with the subject’s eyes open, in a dimly lit room and with minimal auditory stimulation. The subjects were positioned in the scanner by using a stereoadapter with three-dimensional laser alignment with reference to the orbitomeatal line. The time course of fluorine-18 radioactivity was determined by sampling radial arterial blood. We calculated global and regional cerebral metabolic rates for glucose in all FDG PET studies on a voxel-by-voxel basis by using the autoradiographic method described by us previously (35).
Analysis
Each scan was processed before statistical analysis by using statistical parametric mapping (SPM 99) software (MRC Cyclotron Unit, London, U.K.). Each original 35-slice scan was placed into a standardized space (36) by using a nonlinear algorithm that created 68 slice images containing 2-mm3 voxels (37). Each scan was then smoothed by using a Gaussian filter (full width at half maximum 10×10×10 mm).
Two sets of statistical analyses were performed. First, we located regional metabolic abnormalities in the Parkinson’s disease patients by comparing their metabolic rates at each voxel with the comparable values for the age-matched normal comparison subjects. This comparison was achieved by using the “one scan per subject, two sample t test” option in SPM 99. We reduced between-subject variation in global metabolic rates by proportionally scaling each image. We displayed all voxels with t >3.4 (df=27, p<0.001, Student’s t test one-tailed for the hypothesis of higher values in Parkinson’s disease patients than in comparison subjects and one-tailed for the hypothesis of Parkinson’s disease values less than comparison values, uncorrected for multiple comparisons).
Second, we used partial least squares (18, 20, 38) to identify patterns of regional brain activity that are associated with different aspects of cognition and mood behavior in parkinsonism. In this study, brain-behavior partial least squares analysis used metabolic and neuropsychological data from only the Parkinson’s disease cohort. We sought correlations with the scores reflecting dysphoria and mnemonic and visuospatial functioning.
Brain-behavior partial least squares was performed by using software available at ftp.rotman-baycrest.on.ca/pub/Randy/pls. The mathematical details of this analysis have been described previously (18). Based on the covariance between global metabolism and behavior, partial least squares extracts a discrete number of latent variables that best reflect the brain-behavior relationship. Each latent variable is associated with a topographic profile. This procedure comprises three steps. First, correlations between behavior and global metabolism at each voxel are computed across subjects to produce one correlation map for each behavior. Second, each correlation map is put into a matrix and analyzed with singular value decomposition. This produces mutually orthogonal latent variables, each one consisting of a singular image (topographic profile), a singular profile of behavioral weights, and the singular value, which is the covariance between the topographic profile and singular profile. Each topographic profile is an image of weighted voxels that as a whole covaries with behavior. The numerical weights within the image are termed “saliences” and can be positive or negative. Third, the inner product of the topographic profile and raw images for each subject results in an individual brain score. The brain score indicates the degree to which the topographic profile is expressed by the individual subject, and it is conceptually similar to a subject score from a principal component analysis (35). The relationship between topographic profile and behavior is quantified by the correlation between brain score and behavior score.
Statistical assessment of the brain-behavior partial least squares is performed at two levels: at the level of the entire latent variable and at the voxel or behavior measure level. A permutation test was used to determine the overall significance of each latent variable (19). Five hundred random permutations of the data were performed. At each permutation, the singular values for the permuted data were compared to the values in the original analysis. We considered a topographic profile significant if the latent variable it represented was significant at permutation p<0.05, i.e., the permutated data produced a singular value greater than or equal to that in the original analysis less than 5% of the time. There is no need to correct for multiple comparisons in this assessment since the permutation p values were determined across the entire latent variable, rather than at the voxel level.
We then assessed the reliability of the contributions of particular voxels and behavior measures to each latent variable, using bootstrap estimation of standard errors (20, 39). One hundred bootstrap samples were performed. Bootstrapping entails resampling the entire sample with replacement to ascertain the stability of parameter estimates by partial least squares. A parameter with a high standard error would not be considered reliable and thus would not be considered an important component of the latent variable. The assessment was applied to the saliences of all voxels and to the correlations between behavior measures and brain scores. In interpreting the topographic profiles, we considered a salience value reliable/stable if the ratio of salience to standard error was greater than 2.0 (bootstrap ratio). A correlation between a behavior measure and a topographic profile was considered stable if the sign of the bootstrap correlation did not change from the original correlation 95% of the time, i.e., the 95% confidence interval (CI) for r did not cross zero. To clarify, the bootstrap procedure evaluates the stability of a voxel’s contribution to a pattern (voxelwide index). The statistical assessment of the pattern is provided by the permutation test (imagewide index). In both permutations and bootstrapping, orthogonal procrustes rotations of the resampled estimates to the original partial least squares estimates were performed to correct for arbitrary axis reflection and rotations (40).
Results
Neuropsychological Assessment
The composite results of the neuropsychological tests for each Parkinson’s disease patient are presented in Table 1. These patients were nondemented according to DSM-III-R and MMSE criteria (score ≤24). However, when compared to published normative values (30, 31), their scores indicated a mild impairment of task performance. Their mean summary score on the California Verbal Learning Test was 32.1 (SD=14.0, normal range=31–72), and their mean score on the Hooper Visual Organization Test was 19.7 (SD=4.3, normal range=19–30). Nine of the patients with Parkinson’s disease had California Verbal Learning Test scores that were more than 1.5 standard deviations below the normative mean corrected for age and gender (exact p=0.003, Fisher exact statistic used to compare observed with expected number). Four patients had Hooper Visual Organization Test scores more than 1.0 standard deviation below the normative mean corrected for age and education (Fisher exact p=0.32). The patients did not meet the DSM-III-R criteria for major depression, and their scores on the Beck Depression Inventory (mean=11.4, SD=6.6) averaged in the mild range. No significant correlations were observed between scores on the California Verbal Learning Test, Hooper Visual Organization Test, Beck Depression Inventory, and Hoehn and Yahr scale even without a correction for multiple comparisons.
Voxel-Based Comparison of Metabolism
Brain regions in which glucose values at rest, normalized to those for the whole brain, differed from those in the comparison group are presented in Figure 1. Higher metabolism in the Parkinson’s disease group was seen bilaterally in the posterior putamen, globus pallidus, thalamus, cerebellum, and pons. Lower metabolism was observed bilaterally in parieto-occipito-temporal regions and in the right dorsolateral prefrontal cortex.
Brain-Behavior Partial Least Squares Analysis
Three orthogonal (independent) topographic patterns were generated by the singular value decomposition of the behavior-scan correlation matrix. Only the first two topographic patterns were significant. The percentage of the correlation matrix for brain and behavior accounted for by topographic pattern 1 was 49% (permutation p=0.01), for topographic pattern 2 it was 36% (permutation p=0.03), and for topographic pattern 3 it was 15% (permutation p=0.72). The brain regions constituting the first two metabolic patterns are displayed in Figure 2. Pattern 1 was characterized by higher metabolic rates (positive saliences) in the medial and anterior temporal lobe, pons, and cerebellum bilaterally and by lower metabolic rates (negative saliences) in lateral parieto-occipito-temporal and medial parietal regions. Pattern 2 was characterized by higher metabolism in the cerebellum and medial occipital lobe bilaterally and by lower metabolism in dorsolateral prefrontal, orbitofrontal, medial frontal, and anterior cingulate regions bilaterally. To test the hypothesis that small frontosubcortical abnormalities are associated with large parieto-occipito-temporal abnormalities, we lowered the bootstrap ratio threshold to 1.7 (permutation p approximately equal to 0.05, one-tailed). In addition to the abnormalities shown in Figure 2, we found abnormal metabolism in the bilateral dorsolateral prefrontal cortex and bilateral head of the caudate and anterior putamen.
Scatterplots of relationships between behavior and brain scores are presented at the bottom of Figure 2. Values for the correlations of the scores on California Verbal Learning Test, Hooper Visual Organization Test, and Beck Depression Inventory to the brain scores for each topographic pattern are given, along with estimates of stability, in Table 2. The scores on the California Verbal Learning Test and Hooper Visual Organization Test had stable correlations (95% CIs did not cross zero) with the pattern 1 brain scores but not the pattern 2 brain scores, whereas the scores on the Beck Depression Inventory had a stable correlation with the pattern 2 brain scores but not the pattern 1 brain scores. Thus, the brain-behavior correlations for dysphoria and cognition were doubly dissociated, whereas those for the two cognitive measures were similar.
Discussion
We investigated the relationship between glucose metabolism at rest and discrete neuropsychological measures of cognitive/mood functioning in 15 patients with Parkinson’s disease without dementia or major depression. First, compared with age-matched normal comparison subjects, the Parkinson’s disease cohort had lower metabolism at rest in lateral parieto-temporo-occipital regions and, to a lesser degree, in lateral frontal brain regions (Figure 1). These low cortical rates were associated with bilaterally high metabolic rates in the globus pallidus, thalamus, putamen, and cerebellum. The FDG-PET data from the current cohort of patients with Parkinson’s disease conform to past results, indicating that this population is metabolically typical of the disease (25, 35, 41).
In a subsequent partial least squares multivariate brain-behavior correlate analysis of the Parkinson’s disease data, we identified significant orthogonal topographic patterns of glucose metabolism at rest that correlated with mnemonic, visuospatial, and dysphoric behavior. As a glucose value at rest is thought to reflect primarily synaptic metabolism (42), a topographic pattern is a collection of brain regions having specific values of neuropil metabolism. Further, a topographic pattern has a high correlation with a behavior if subjects who exhibit the behavior have regional metabolic values similar to those in the topographic pattern and if subjects who do not exhibit the behavior have regional metabolic values different from those in the topographic pattern. Therefore, a topographic pattern of glucose metabolism at rest represents a pattern of neuropil metabolism across multiple brain regions that correlates with behavior.
The emphasis in interpreting a topographic pattern under resting conditions is different from that in activation conditions. A topographic pattern associated with an activation task but not associated with a suitable control task may uniquely and completely describe the regional network subserving that specific task. By contrast, a topographic pattern under resting conditions is primarily a marker of some factor that modifies metabolism at rest, i.e., a pathological process that alters neuropil at rest in multiple regions and causes dysfunction in multiple behavioral domains. In this example, all regions in which metabolism at rest is altered by this pathology would be included in the topographic pattern, and the topographic pattern would correlate with more than one behavior. Thus, a finding that multiple behavioral abnormalities correlate with a single topographic pattern at rest suggests that a common pathological mechanism underlies those behaviors. By contrast, a double dissociation between behavioral abnormalities and orthogonal topographic patterns under resting conditions suggests that separate pathological processes are responsible for the behavioral abnormalities. An important characteristic of partial least squares, and one that separates it from univariate analyses, is that it allows us to quantify the size of the correlation among several behaviors and multiple orthogonal topographic patterns at the same time in a single patient cohort.
The partial least squares analysis identified two significant topographic patterns that exhibited a double dissociation in their behavioral correlates. Pattern 1, including medial temporal and parieto-occipito-temporal regions, correlated with both the mnemonic (California Verbal Learning Test) and visuospatial (Hooper Visual Organization Test) measures but not with dysphoria (Beck Depression Inventory). By contrast, pattern 2, including frontal and anterior limbic regions, correlated significantly with dysphoria (Beck Depression Inventory) but not with mnemonic or visuospatial functioning. That both the California Verbal Learning Test and Hooper Visual Organization Test scores correlated significantly with a single marker of resting neuropil activity (topographic pattern 1) suggests that these two aspects of cognitive dysfunction in Parkinson’s disease have a shared pathological mechanism. Further, the independence of patterns 1 and 2 supports the notion that the underlying pathophysiology of mood disturbance is distinct from that underlying cognitive dysfunction in parkinsonism.
Topographic Pattern 1: Cognition
While test results in multiple cognitive domains may be abnormal, cognitive dysfunction in Parkinson’s disease has been conceptualized as dysexecutive (1, 2). This model identifies the prefrontal cortex and the nonmotor corticostriatopallidal thalamocortical loops, singly or in combination, as the anatomical sites of functional impairment in parkinsonism. That topographic pattern 1, a biological marker of neuropil metabolism at rest, does not include frontal/subcortical regions does not necessarily imply that “frontal” symptoms are an unimportant component of cognitive dysfunction in Parkinson’s disease. First, Parkinson’s disease pathology may result in frontal/subcortical dysfunction such that frontal metabolism is normal at rest and becomes abnormal only during task performance (43). Second, frontal neuronal dysfunction may be expressed in a topographic pattern of neuropil metabolism as bootstrap ratios that are higher within brain regions to which frontal neurons project (i.e., frontal neurons terminating in the medial temporal and parietal lobes) than within the frontal lobe itself (i.e., frontal neurons/interneurons terminating in the frontal lobe). To test this notion, we lowered the threshold for the bootstrap ratio in topographic pattern 1 from 2.0 to 1.7 (i.e., lowering the threshold from permutation p of approximately 0.05, two tailed, to permutation p of approximately 0.05, one tailed). At this liberal threshold, we did indeed detect correlations between brain scores and cognitive test results for the bilateral dorsolateral prefrontal cortex and anterior basal ganglia (head of caudate and anterior putamen).
However, pattern 1 demonstrated abnormalities at rest in regions subserving memory (medial temporal) and visuospatial functioning (parieto-occipital) rather than within frontosubcortical regions. This raises the possibility that cognitive dysfunction is caused by a pathophysiology that affects the cortex globally rather than frontosubcortical regions locally. Abnormalities of the cholinergic (16) or noradrenergic (14) system that cause abnormal modulation of the entire cortex are candidate pathophysiologies. A global lesion also explains the greater difficulty patients with Parkinson’s disease have with executive tasks. Unlike “simple” visuomotor or memory tasks, which require predominantly temporal or parietal functioning and minimal frontal functioning, executive tasks require functioning within and interaction between the frontal lobes plus temporal or parietal regions. A global lesion thus delivers a single hit to a “simple” task but a double hit to an executive task.
As functional imaging studies evaluating abnormal brain function and cognition in Parkinson’s disease have yielded inconsistent findings (21–25), this literature favors neither a focal nor a global lesion. There are many reasons for such findings. Despite evidence that higher brain functioning uses large-scale distributed networks (44), simple univariate correlations, which were used in some of the earlier studies, are based on an assumption of no functional interaction among regions. Therefore, univariate approaches may underestimate the relationship between regional dysfunction and behavioral abnormality. In addition, differences in tasks, experimental design, PET instruments, and analytic methods may be important in explaining the disparate results of these studies.
Further exploration of the relationship between topographic pattern 1 and cognition revealed that although scores on the California Verbal Learning Test and Hooper Visual Organization Test correlated significantly with pattern 1 (Figure 2), implying that these different cognitive tasks share a common pathophysiological mechanism, the correlation between the California Verbal Learning Test and Hooper Visual Organization Test scores was small and nonsignificant (r=0.28, N=15, p=0.32, two-tailed). This suggests that despite the commonality in this brain-behavior relationship, the two tasks also have differences that may be important behaviorally and therapeutically.
Topographic Pattern 2: Dysphoria
No subject met the DSM-III-R criteria for major depression. The Beck Depression Inventory has been shown to be a sensitive, reliable, and valid measure of depressive symptoms in Parkinson’s disease (45, 46). As the Beck Depression Inventory measures depressive symptoms over the previous week, it is insensitive to any short-term fluctuations of mood that may occur on the day of the scan. Further, no attempt was made to manipulate mood during the scan. Thus, any correlation between metabolism at rest and the Beck Depression Inventory reflects the metabolic trait of dysphoria rather than a temporary metabolic state of sadness. The pathophysiology underlying this trait is likely caused by Parkinson’s disease pathology.
Scores on the Beck Depression Inventory correlated significantly with topographic pattern 2, a pattern characterized by bilaterally low metabolism in the anterior cingulate cortex, orbitofrontal cortex, and lateral and medial frontal lobes. Imaging studies have consistently associated abnormal frontal lobe function with major depression in Parkinson’s disease, with emphasis placed on the orbitofrontal (26), dorsolateral frontal (24), and medial frontal and anterior cingulate (27) brain regions. It has been suggested that these regional differences reflect biases inherent in specific imaging and analytic techniques, rather than conflicting results (27). As our patients with Parkinson’s disease had varying degrees of dysphoria and not major depression, that pattern 2 included all these regions (Figure 2) suggests that abnormal connectivity among prefrontal structures (lateral and medial frontal cortex) and limbic structures (anterior cingulate and orbitofrontal cortex) not only underlies major depression (47) but also dysphoria in Parkinson’s disease. The pathophysiological basis of the abnormal connectivity remains speculative (3).
Topographic patterns 1 and 2 both include higher than normal metabolism in the cerebellum, and pattern 1 also had high metabolism in the pons. There is a growing awareness of the importance of cerebellar functioning in nonmotor behaviors, and these findings may represent metabolic markers of cerebellar functioning in memory (48), visuospatial functioning (49), and depression and cognitive functioning (50). Given the low metabolism in parieto-occipito-temporal and frontal regions in patterns 1 and 2, it is possible that the higher cerebellopontine metabolic rates are compensating through a loop connecting the lateral cerebellum, ventrolateral dentate, and dorsolateral prefrontal cortex (51) that may be important in mediating cognitive functioning. Indeed, we have noted similar compensatory increases in an activation study requiring patients with Parkinson’s disease to perform a complex memory task (52).
These topographic patterns were derived from nondemented patients with Parkinson’s disease without major depression. Whether these markers are applicable to cognitive functioning in demented patients with Parkinson’s disease or to mood severity in patients with Parkinson’s disease with major depression remains to be tested. It is possible that the pathophysiology underlying dementia and major depression differ quantitatively and/or qualitatively from that underlying cognitive dysfunction and dysphoria. There was also a wide age range in the Parkinson’s disease group. Further, as topographic patterns were identified within the Parkinson’s disease group alone, we do not know whether test scores for the comparison subjects would be associated with the same or different topographic patterns. Whether topographic patterns 1 and 2 could discriminate old from young, normal subjects from patients with Parkinson’s disease, or patients with Parkinson’s disease from those with other diseases remains to be determined.
Conclusions
Our findings provide quantitative biological evidence to reject the null hypothesis that mnemonic, visuospatial, and dysphoric symptoms in nondemented Parkinson’s disease subjects result from a common pathogenic mechanism. We suggest that a single pathophysiological process distinct from that responsible for dysphoria causes mnemonic and visuospatial symptoms. As it seems unlikely that dopamine loss alone is primarily responsible for cognitive and mood symptoms in Parkinson’s disease (1, 2, 9–13), future studies need to evaluate other possible pathophysiological mechanisms (14–17). In conjunction with drug probes, our topographic patterns can be used prospectively as biological markers to quantify the extent to which these candidate mechanisms cause cognitive and affective dysfunction in parkinsonism.
 |
 |
Received June 13, 2001; revision received Jan. 10, 2002; accepted Jan. 16, 2002. From the Center for Neuroscience, North Shore-Long Island Jewish Research Institute, Manhasset, N.Y. Address reprint requests to Dr. Mentis, Center for Neuroscience, North Shore University Hospital, 350 Community Dr., Manhasset, NY 11030; [email protected] (e-mail). Supported by grants NS-35069, NS-02204 (Dr. Mentis), NS-02011 (Dr. Feigin), and NS-02101 (Dr. Eidelberg) from the National Institute of Neurological and Communicative Disorders and Stroke and by the American Parkinson Disease Foundation. The authors thank Dr. Thomas Chaly for radiochemistry support, Mr. Claude Margouleff and Dr. Abdel Belakhleff for technical support, and Dr. Helen Mayberg for comments on the manuscript.

Figure 1. Differences in Brain Metabolism at Rest Between 15 Patients With Parkinson’s Disease and 14 Normal Comparison Subjects

Figure 2. Two Orthogonal Topographic Patterns of Brain Metabolism in 15 Patients With Parkinson’s Disease and Doubly Dissociated Correlations With Cognitive and Mood Measuresa
aThe orthogonal topographic patterns were derived from glucose metabolic scans at rest. The bootstrap ratio is the ratio of voxel salience value to its standard error (estimated from 100 bootstrap samples). It is a measure of the stability of high (red scale) and low (blue scale) metabolic values that constitute the topographic pattern.
1. Dubois B, Pillon B: Cognitive deficits in Parkinson’s disease. J Neurol 1997; 244:2-8Crossref, Medline, Google Scholar
2. Brown RG, Marsden CD: Cognitive function in Parkinson’s disease: from description to theory. Trends Neurosci 1990; 13:21-29Crossref, Medline, Google Scholar
3. Mayberg HS, Solomon DH: Depression in Parkinson’s disease: a biochemical and organic viewpoint. Adv Neurol 1995; 65:49-60Medline, Google Scholar
4. Aarsland D, Tandberg E, Larsen JP, Cummings JL: Frequency of dementia in Parkinson disease. Arch Neurol 1996; 53:538-542Crossref, Medline, Google Scholar
5. Cummings JL: Depression and Parkinson’s disease: a review. Am J Psychiatry 1992; 149:443-454Link, Google Scholar
6. Pirozzolo FJ, Hansch EC, Mortimer JA, Webster DD, Kuskowski MA: Dementia in Parkinson disease: a neuropsychological analysis. Brain Cogn 1982; 1:71-83Crossref, Medline, Google Scholar
7. Cooper JA, Sagar HJ, Jordan N, Harvey NS, Sullivan EV: Cognitive impairment in early, untreated Parkinson’s disease and its relationship to motor disability. Brain 1991; 114(part 5):2095-2122Google Scholar
8. Starkstein SE, Mayberg HS, Leiguarda R, Preziosi TJ, Robinson RG: A prospective longitudinal study of depression, cognitive decline, and physical impairments in patients with Parkinson’s disease. J Neurol Neurosurg Psychiatry 1992; 55:377-382Crossref, Medline, Google Scholar
9. Cooper JC, Sagar HJ, Doherty SM, Jordan NJ, Tidswell P, Sullivan EV: Different effects of dopaminergic and anticholinergic therapies on cognitive and motor function in Parkinson’s disease: a follow-up study of untreated patients. Brain 1992; 115:1701-1725Crossref, Medline, Google Scholar
10. Pillon B, Dubois B, Cusimano G, Bonnet AM, Lhermitte F, Agid Y: Does cognitive impairment in Parkinson’s disease result from non-dopaminergic lesions? J Neurol Neurosurg Psychiatry 1989; 52:201-206Crossref, Medline, Google Scholar
11. Gotham AM, Brown RG, Marsden CD: “Frontal” cognitive function in patients with Parkinson’s disease “on” and “off” levodopa. Brain 1988; 111(part 2):299-321Google Scholar
12. Malapani C, Pillon B, Dubois B, Agid Y: Impaired simultaneous cognitive task performance in Parkinson’s disease: a dopamine-related dysfunction. Neurology 1994; 44:319-326Crossref, Medline, Google Scholar
13. Sagar HJ (ed): Clinicopathological Heterogeneity and Non-Dopaminergic Influences on Behavior in Parkinson’s Disease. Philadelphia, Lippincott Williams & Wilkins, 1999Google Scholar
14. Scatton B, Javoy-Agid F, Rouquier L, Dubois B, Agid Y: Reduction of cortical dopamine, noradrenaline, serotonin and their metabolites in Parkinson’s disease. Brain Res 1983; 275:321-328Crossref, Medline, Google Scholar
15. Mayeux R, Stern Y, Sano M, Williams JB, Cote LJ: The relationship of serotonin to depression in Parkinson’s disease. Mov Disord 1988; 3:237-244Crossref, Medline, Google Scholar
16. Perry EK, Curtis M, Dick DJ, Candy JM, Atack JR, Bloxham CA, Blessed G, Fairbairn A, Tomlinson BE, Perry RH: Cholinergic correlates of cognitive impairment in Parkinson’s disease: comparisons with Alzheimer’s disease. J Neurol Neurosurg Psychiatry 1985; 48:413-421Crossref, Medline, Google Scholar
17. Perry R, McKeith I, Perry E: Lewy body dementia—clinical, pathological and neurochemical interconnections. J Neural Transm Suppl 1997; 51:95-109Crossref, Medline, Google Scholar
18. McIntosh AR, Bookstein FL, Haxby JV, Grady CL: Spatial pattern analysis of functional brain images using partial least squares. Neuroimage 1996; 3:143-157Crossref, Medline, Google Scholar
19. Edgington ES: Randomization Tests. New York, Marcel Dekker, 1980Google Scholar
20. McIntosh AR, Rajah MN, Lobaugh NJ: Interactions of prefrontal cortex in relation to awareness in sensory learning. Science 1999; 284:1531-1533Crossref, Medline, Google Scholar
21. Mohr E, Mann UM, Miletich RS, Sampson M, Goldberg TE, Grimes JD, Chase TN: Neuropsychological and glucose metabolic profiles in asymmetric Parkinson’s disease. Can J Neurol Sci 1992; 19:163-169Medline, Google Scholar
22. Marie RM, Rioux P, Eustache F, Travere JM, Lechevalier B, Baron JC: Clues about the functional neuroanatomy of verbal working memory: a study of resting brain glucose metabolism in Parkinson’s disease. Eur J Neurol 1995; 2:83-94Crossref, Medline, Google Scholar
23. Hu MT, Taylor-Robinson SD, Chaudhuri KR, Bell JD, Labbe C, Cunningham VJ, Koepp MJ, Hammers A, Morris RG, Turjanski N, Brooks DJ: Cortical dysfunction in non-demented Parkinson’s disease patients: a combined (31)P-MRS and (18)FDG-PET study. Brain 2000; 123(part 2):340-352Google Scholar
24. Jagust WJ, Reed BR, Martin EM, Eberling JL, Nelson-Abbott RA: Cognitive function and regional cerebral blood flow in Parkinson’s disease. Brain 1992; 115(part 2):521-537Google Scholar
25. Owen AM, Doyon J, Dagher A, Sadikot A, Evans AC: Abnormal basal ganglia outflow in Parkinson’s disease identified with PET: implication for higher cortical functions. Brain 1998; 121:949-965Crossref, Medline, Google Scholar
26. Mayberg HS, Starkstein SE, Sadzot B, Preziosi T, Andrezejewski PL, Dannals RF, Wagner HN Jr, Robinson RG: Selective hypometabolism in the inferior frontal lobe in depressed patients with Parkinson’s disease. Ann Neurol 1990; 28:57-64Crossref, Medline, Google Scholar
27. Ring HA, Bench CJ, Trimble MR, Brooks DJ, Frackowiak RS, Dolan RJ: Depression in Parkinson’s disease: a positron emission study. Br J Psychiatry 1994; 165:333-339Crossref, Medline, Google Scholar
28. Hoehn MM, Yahr MD: Parkinsonism: onset, progression, and mortality. Neurology 1967; 15:427-442Crossref, Google Scholar
29. Folstein MF, Folstein SE, McHugh PR: “Mini-Mental State”: a practical method for grading the cognitive state of patients for the clinician. J Psychiatr Res 1975; 12:189-198Crossref, Medline, Google Scholar
30. Dellis D, Kramer J, Kaplan E, Ober B: California Verbal Learning Test—Adult Version. San Antonio, Tex, Psychological Corp, 1987Google Scholar
31. Hooper H: The Hooper Visual Organization Test Manual. Los Angeles, Western Psychological Services, 1958Google Scholar
32. Beck AT, Ward CH, Mendelson M, Mock J, Erbaugh J: An inventory for measuring depression. Arch Gen Psychiatry 1961; 4:561-571Crossref, Medline, Google Scholar
33. Fahn S, Elton R, UPDRS Development Committee: Unified Parkinson"s Disease Rating Scale, in Recent Developments in Parkinson"s Disease, vol 2. Edited by Fahn S, Marsden CD, Calne DB, Goldstein M. Florham Park, NJ, Macmillan Health Care Information, 1987, pp 153-163, 293-304Google Scholar
34. Perrine K, Dogali M, Fazzini E, Sterio D, Kolodny E, Eidelberg D, Devinsky O, Beric A: Cognitive functioning after pallidotomy for refractory Parkinson’s disease. J Neurol Neurosurg Psychiatry 1998; 65:150-154Crossref, Medline, Google Scholar
35. Eidelberg D, Moeller JR, Dhawan V, Spetsieris P, Takikawa S, Ishikawa T, Chaly T, Robeson W, Margouleff D, Przedborski S: The metabolic topography of parkinsonism. J Cereb Blood Flow Metab 1994; 14:783-801Crossref, Medline, Google Scholar
36. Talairach J, Tournoux P: Co-Planar Stereotaxic Atlas of the Human Brain: Three-Dimensional Proportional System. New York, Thieme Medical, 1988Google Scholar
37. Friston KJ, Holmes AP, Worsley KJ, Poline JB, Frith CD, Frackowiak RSJ: Statistical parametric maps in functional neuroimaging: a general linear approach. Hum Brain Mapp 1995; 2:189-210Crossref, Google Scholar
38. Nyberg L, Habib R, McIntosh AR, Tulving E: Reactivation of encoding-related brain activity during memory retrieval. Proc Natl Acad Sci USA 2000; 97:11120-11124Crossref, Medline, Google Scholar
39. Efron B, Tibshirani R: Bootstrap methods for standard errors, confidence intervals and other measures of statistical accuracy. Stat Sci 1986; 1:54-77Crossref, Google Scholar
40. Milan L, Whittaker J: Application of the parametric bootstrap to models that incorporate a singular value decomposition. J R Stat Soc Series C (Applied Statistics) 1995; 44:31-49Google Scholar
41. Moeller JR, Nakamura T, Mentis MJ, Dhawan V, Spetsieres P, Antonini A, Missimer J, Leenders KL, Eidelberg D: Reproducibility of regional metabolic covariance patterns: comparison of four populations. J Nucl Med 1999; 40:1264-1269Medline, Google Scholar
42. Aucker C, Meszler R, Carpenter D: Apparent discrepancy between single-unit activity and 14C deoxyglucose labelling in optic tectum of the rattlesnake. J Neurophysiol 1983; 49:1504-1516Medline, Google Scholar
43. Mentis MJ, Alexander GE, Krasuski J, Pietrini P, Furey ML, Schapiro MB, Rapoport SI: Increasing required neural response to expose abnormal brain function in mild versus moderate or severe Alzheimer’s disease: PET study using parametric visual stimulation. Am J Psychiatry 1998; 155:785-794Abstract, Google Scholar
44. Mesulam MM: Large-scale neurocognitive networks and distributed processing for attention, language, and memory. Ann Neurol 1990; 28:597-613Crossref, Medline, Google Scholar
45. Leentjens AF, Verhey FR, Luijckx GJ, Troost J: The validity of the Beck Depression Inventory as a screening and diagnostic instrument for depression in patients with Parkinson’s disease. Mov Disord 2000; 15:1221-1224Crossref, Medline, Google Scholar
46. Levin BE, Llabre MM, Weiner WJ: Parkinson’s disease and depression: psychometric properties of the Beck Depression Inventory. J Neurol Neurosurg Psychiatry 1988; 51:1401-1404Crossref, Medline, Google Scholar
47. Mayberg HS, Liotti M, Brannan SK, McGinnis S, Mahurin RK, Jerabek PA, Silva JA, Tekell JL, Martin CC, Lancaster JL, Fox PT: Reciprocal limbic-cortical function and negative mood: converging PET findings in depression and normal sadness. Am J Psychiatry 1999; 156:675-682Abstract, Google Scholar
48. Andreasen NC, O’Leary DS, Paradiso S, Cizadlo T, Arndt S, Watkins GL, Boles Ponto LL, Hichwa RD: The cerebellum plays a role in conscious episodic memory retrieval. Hum Brain Mapp 1999; 8:226-234Crossref, Medline, Google Scholar
49. Mellet E, Tzourio-Mazoyer N, Bricogne S, Mazoyer B, Kosslyn SM, Denis M: Functional anatomy of high-resolution visual mental imagery. J Cogn Neurosci 2000; 12:98-109Crossref, Medline, Google Scholar
50. Dolan RJ, Bench CJ, Brown RG, Scott LC, Friston KJ, Frackowiak RS: Regional cerebral blood flow abnormalities in depressed patients with cognitive impairment. J Neurol Neurosurg Psychiatry 1992; 55:768-773Crossref, Medline, Google Scholar
51. Middleton FA, Strick PL: Basal ganglia and cerebellar loops: motor and cognitive circuits. Brain Res Brain Res Rev 2000; 31:236-250Crossref, Medline, Google Scholar
52. Nakamura T, Ghilardi MF, Mentis M, Dhawan V, Fukuda M, Hacking A, Moeller JR, Ghez C, Eidelberg D: Functional networks in motor sequence learning: abnormal topographies in Parkinson’s disease. Hum Brain Mapp 2001; 12:42-60Crossref, Medline, Google Scholar