Latent Structure of Eating Disorder Symptoms: A Factor Analytic and Taxometric Investigation
Abstract
OBJECTIVE: The latent structure of eating disorder symptoms, as defined by DSM-IV, was tested in a group of 341 women with and without an eating disorder diagnosis. METHOD: The study group consisted of 201 participants with a diagnosis of anorexia nervosa, bulimia nervosa, binge eating disorder, or eating disorder not otherwise specified; 24 comparison subjects who were obese but did not have an eating disorder diagnosis; and 116 normal-weight comparison subjects. The presence and severity of DSM-IV eating disorder symptoms was assessed with the semi-structured Interview for the Diagnosis of Eating Disorders—IV. The study group was randomly divided into two subgroups for factor analytic studies, and the data were subjected to exploratory and confirmatory factor analysis. Pilot taxometric analyses were used to examine whether the obtained factors represented true dimensions or latent discrete classes. RESULTS: In exploratory factor analyses with data from subgroup 1, three factors were found to account for 66% of the variance in eating disorder symptoms: binge eating, fear of fatness/compensatory behaviors, and drive for extreme thinness. Confirmatory factor analysis cross-validated this factor structure with data from subgroup 2. The eating disorder groups and comparison groups were found to differ on at least one of the three factors. The results of the taxometric analyses were inconsistent with a strictly dimensional model of eating disorders and suggested that some features may be dimensional whereas others may be taxonic (discrete). Discussion: The eating disorders, as defined by DSM-IV, can be conceptualized as having three latent features. Taxometric tests found empirical support for conceptualizing bulimia nervosa and binge eating disorder as discrete syndromes.
For many years, a debate has raged over the conceptualization of mental illness as a set of categorical disorders versus dimensions on which individuals vary in degree but not kind (1). From the inception of the development of a diagnostic system for psychiatric illnesses, APA has chosen the categorical approach for defining mental illness, which is still evident in the most recent version of DSM.
This controversy is pertinent to research concerning the classification of eating disorders. The DSM-IV classification system specifies two primary diagnostic categories for eating disorders: anorexia nervosa and bulimia nervosa. The system also includes a residual category, eating disorder not otherwise specified, which includes subthreshold diagnoses of anorexia and bulimia nervosa, as well as a controversial new category called binge eating disorder. This system of classification has been criticized for several reasons, including the similarities in symptom profiles of anorexia and bulimia nervosa and the unusually large number of cases that are captured by the category of eating disorder not otherwise specified (2–4). In response to these concerns, some theoreticians have suggested alternative conceptualizations of eating disorders that utilize a dimensional framework. For example, Schlundt and Johnson (5) proposed a three-dimensional model: binge eating, fear of fatness, and body size. Beumont et al. (6) and Walsh and Garner (3) proposed a slightly different three-dimensional model: binge eating, purging, and body size. Both groups of researchers specified how anorexia nervosa, bulimia nervosa, binge eating disorder, and eating disorder not otherwise specified, as defined by the DSM system of classification, related to the three dimensions. However, the question of whether the eating disorders vary along these or other dimensions, with “normalcy” defining one end of the continuum, or whether the eating disorders are discrete categories (distinct from normalcy and other eating disorders) has not been tested empirically, to our knowledge. Taxometric procedures (7, 8) are a group of statistical procedures specifically designed to answer questions of this type.
The primary aims of this study were to 1) identify latent features of eating disorder symptoms as defined by the DSM-IV descriptions of anorexia nervosa, bulimia nervosa, and binge eating disorder; 2) compare the three eating disorder groups with comparison groups on the features of eating disorder symptoms identified by using factor analysis; and 3) examine whether the eating disorder features occur on a continuum with normalcy or constitute discrete classes or categories.
Method
Participants
A total of 341 women participated in the study. Participants with an eating disorder (N=201) and obese subjects without an eating disorder diagnosis (N=24) were recruited from an eating disorder program of a private hospital and a university outpatient research center specializing in the treatment of eating disorders and obesity. The subtypes of eating disorder diagnoses were 1) bulimia nervosa, purging type (N=38); 2) bulimia nervosa, nonpurging type (N=7); 3) anorexia nervosa, restricting type (N=19); 4) anorexia nervosa, binge eating/purging type (N=16); 5) eating disorder not otherwise specified (N=78); and 6) binge eating disorder (N=43). Normal-weight comparison subjects (N=116) were recruited from undergraduate psychology classes. Consent forms explaining the purpose and procedures of the study were read and signed by all participants.
Assessment Instruments
The Interview for the Diagnosis of Eating Disorders—IV (9) was administered by doctoral students in clinical psychology. The interviewers had received extensive training by the first author in semistructured interview procedures and the diagnosis of eating disorders. The Interview for the Diagnosis of Eating Disorders—IV is a semistructured clinical interview that is used to assess the presence or absence of DSM-IV eating disorder symptoms. The presence or absence and severity of each DSM-IV symptom is rated by the interviewer on a 5-point Likert-type scale. A score of 3 or greater indicates the diagnostic threshold of a symptom. After the semistructured interview, the interviewer completes a checklist leading to the appropriate eating disorder diagnosis. The Interview for the Diagnosis of Eating Disorders—IV has been found to have adequate internal consistency, interrater reliability, concurrent validity, and discriminant validity for eating disorder diagnoses made with DSM-IV criteria (9). The results of tests of the reliability of the diagnoses in this study group were reported in an earlier article (9); reliability was found to be very high (kappa coefficient=0.85).
After the interview, the body weight and height of each participant were measured. Participants were debriefed about the purpose of the study, and any questions or concerns were addressed.
Data Analysis
One-way analysis of variance (ANOVA) was used to compare age and body mass index in the six groups: participants with anorexia nervosa, bulimia nervosa, eating disorder not otherwise specified, and binge eating disorder; obese comparison subjects; and normal-weight comparison subjects. The Bonferroni correction was used to protect alpha, which was set at p<0.03 for each of the two ANOVAs and for post hoc tests.
To create two groups for the exploratory and confirmatory factor analyses, the study group was randomly split into two subgroups. We controlled for the frequency of diagnostic groups within each subgroup, which resulted in a slightly larger group for the exploratory factor analysis (N=172 versus N=156 for the confirmatory factor analysis). There were no significant differences between the two subgroups in age, height, weight, and body mass index or in the percentage of individuals from each diagnostic group. Data from first subgroup were used in an exploratory principal components analysis to determine the factor structure of the eating disorder symptoms as measured by the Interview for the Diagnosis of Eating Disorders—IV.
The model derived from the exploratory factor analysis was cross-validated with data from the second subgroup by using confirmatory factor analysis (LISREL VIII) (10). Two fit indices—the goodness-of-fit index and the comparative fit index—were used to evaluate the model. In confirmatory factor analyses, fit indices are used to assess the degree of congruence between a theoretical model and the data. Like R2 in regression, fit indices are “meant to quantify something akin to variance accounted for” (11, p. 82). Thus, fit indices indicate how well the data replicates the theory underlying the data.
ANOVA was used to compared the diagnostic groups on the average symptom ratings for the symptoms that constituted the factors derived from the factor analyses.
To examine whether the latent factors or features identified in the factor analyses were truly dimensional (i.e., occurred on a continuum) or were representative of latent classes, we used taxometric methods, a group of statistical procedures designed to distinguish types from continua (8). We used two taxometric techniques described by Meehl (7): 1) mean difference above minus mean difference below a cutoff score and 2) maximum covariance analysis. Indicator variables were the factor scores derived from the factor analyses plus body mass index, and all analyses were performed by using the S-Plus statistical package (Insightful, Seattle).
Taxometric procedures are based on the assumption that the indicators for a latent construct will relate to one another in a specifiable fashion when the constructs in question are dimensional versus discrete (taxonic). When one plots the relationship(s) between indicators (mean difference above and below a cutoff score and covariances of two variables across successive intervals of a third), these plots will display a characteristic pattern in the taxonic situation that can be clearly and reliably distinguished from data generated from latent dimensions (7, 8, 12). Figure 1 shows sample graphs derived from analyses using the mean-above-minus-below-a-cut technique. Figure 2 shows sample graphs derived from maximum covariance analysis. The three graphs on the left side of Figure 1 and Figure 2 indicate taxonic (not dimensional) data. The three graphs on the right side of Figure 1 and Figure 2 illustrate findings in support of dimensional data. In both techniques, taxonic data generate a graph that is mountain shaped and has a noticeable peak. The exact location of the peak depends on the base rate of the discrete class or taxon. If the rate is approximately 0.50, the peak will be in the middle. As the base rate decreases, the peak shifts to the right. Dimensional data produce a bowl or valley-shaped graph in the mean-above-minus-below-a-cut technique and flat graphs in maximum covariance analysis.
We performed three sets of analyses with the two taxometric techniques. First, the entire data set was tested to determine whether the eating disorders were on a continuum with normality or constituted a discrete class. Second, data for each disorder were compared with data for an appropriate comparison group. For these analyses, we used as indicators only the features that discriminated the specific clinical and nonclinical group. Third, we excluded the data for the comparison subjects and applied the taxometric procedures to the data for the combined eating disorder groups (anorexia nervosa, bulimia nervosa, eating disorder not otherwise specified, and binge eating disorder) to evaluate whether the eating disorder syndromes were distinct syndromes, i.e., showed signs of taxonic structure.
For all taxometric analysis, the graphs were evaluated by a trained rater and categorized as suggestive of taxonicity or dimensionality or as ambiguous. In previous research, this rating procedure has yielded highly reliable data (12).
Results
The two ANOVAs comparing age and body mass index in the six diagnostic groups were significant (age: F=38.3, df=5, 340, p<0.001; body mass index: F=64.0, df=5, 340, p<0.001). On the basis of post hoc tests (Scheffé, p<0.03), the groups with anorexia nervosa, bulimia nervosa, and eating disorder not otherwise specified and the normal-weight comparison group were significantly younger than the binge eating disorder group and obese comparison group. The mean body mass index of the anorexia nervosa group was significantly lower than that of the groups with bulimia nervosa, binge eating disorder, and eating disorder not otherwise specified and the obese and normal-weight comparison groups. The mean body mass index values of the groups with bulimia nervosa and eating disorder not otherwise specified and normal-weight comparison group were significantly lower than those for the binge eating disorder group and the obese comparison group.
Exploratory and Confirmatory Factor Analysis
In the exploratory principal components factor analysis, three factors (components) with eigenvalues greater than 1.0 (5.44, 3.90, and 1.18) accounted for 65.8% of the variance in eating disorder symptoms. The rotated factor matrix, shown in Table 1, loaded highly on factors reflecting a three-factor structure: 1) binge eating, 2) fear of fatness/compensatory behaviors, and 3) drive for thinness. Further, all cross-loadings but one were less than 0.50.
In the confirmatory factor analysis, the goodness-of-fit index for our data was 0.85, indicating the model accounted for 85% of the variance in the data; the comparative fit index was 0.92. As a final precaution, we cross-validated the confirmatory model with data from the first subgroup. The goodness-of-fit index again was 0.85, and the comparative fit index was 0.91. Table 1 shows the completely standardized item loadings for the three-factor model from the confirmatory analysis. A comparison of these factor loadings with those from the exploratory factor analysis shows that the two analyses yielded highly similar results. The correlations among the factors were as follows: 0.47 for binge eating with fear of fatness/compensatory behaviors (p<0.01), –0.11 for binge eating with drive for thinness (p>0.10), and 0.48 for fear of fatness/compensatory behaviors with drive for thinness (p<0.01). Thus, fear of fatness/compensatory behaviors was positively correlated with binge eating and drive for thinness, but binge eating and drive for thinness were not significantly correlated. Finally, evidence of internal consistency for the factors was also supported; coefficient alpha was 0.95 for factor 1, 0.81 for factor 2, and 0.67 for factor 3 (11). In sum, support for the reliability of the hypothesized three-factor model was strong, when all of these parameters were considered.
Comparison of Diagnostic Groups
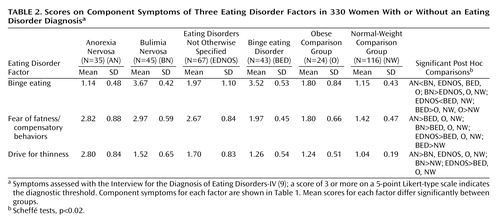
We were interested in examining how each of the eating disorder groups differed on each of the three factors. We excluded two smaller groups within the category of eating disorder not otherwise specified: participants with subclinical binge eating disorder (N=8) and participants with compensatory behaviors after eating small amounts of food (N=3). The remaining participants (N=330) were divided among six groups: 1) bulimia nervosa (N=45), 2) anorexia nervosa (N=35), 3) eating disorder not otherwise specified (N=67), 4) binge eating disorder (N=43), 5) obese comparison group (N=24), and 6) normal-weight comparison group (N=116).
For each participant, a mean score (average symptom rating) ranging from 1 to 5 was computed for each of the three factors (i.e., binge eating, fear of fatness, and drive for thinness). ANOVA was used to compare the six groups on the following dependent variables: 1) binge eating, 2) fear of fatness/compensatory behaviors, and 3) drive for thinness. Each of the three ANOVAs was statistically significant (binge eating: F=180.56, df=6, 317, p<0.0001; fear of fatness: F=57.38, df=6, 317, p<0.0001; and drive for thinness: F=59.18, df=6, 317, p<0.0001). Post hoc contrasts of group means (using Scheffé tests) were interpreted as significant with an alpha level of p<0.02. The results are summarized in Table 2.
For the binge eating factor, the mean scores of the bulimia nervosa and binge eating disorder groups were significantly higher than the mean scores of the groups with anorexia nervosa and eating disorder not otherwise specified and the obese and normal-weight comparison groups. In addition, the mean scores for binge eating of the group with eating disorder not otherwise specified and the obese comparison group were significantly higher than those of the group with anorexia nervosa and the normal-weight comparison group.
For the fear of fatness/compensatory behaviors factor, the mean scores of the groups with bulimia nervosa, anorexia nervosa, and eating disorder not otherwise specified were significantly higher than the mean scores of the group with binge eating disorder and the obese and normal-weight comparison groups. In addition, the mean score for fear of fatness/compensatory behaviors of the binge eating disorder group was significantly higher than that of the normal-weight comparison group.
For the drive for thinness factor, the mean score of the anorexia nervosa group was significantly higher than the mean scores for all other groups. The mean drive for thinness score for the group with eating disorder not otherwise specified was higher than that of the binge eating disorder group and the obese and normal-weight comparison groups. The normal-weight comparison group had a significantly lower drive for thinness score, compared with the bulimia nervosa group, but did not differ from the obese comparison group or the binge eating disorder group.
Taxometric Analyses
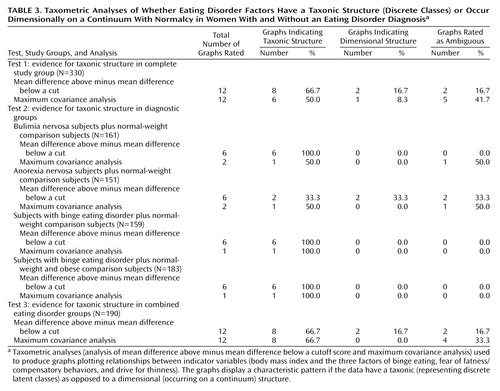
The results of the taxometric analyses are summarized in Table 3. The first set of mean-above-minus-below-a-cut analyses (using data for all groups) produced 12 plots with characteristic taxonic shapes, indicating a base rate of a discrete class close to 0.50. Such a base rate is consistent with what one would expect if the eating disorders (as a whole) were taxonic, given that a little less than one-half of the study group were comparison subjects. The results of the maximum covariance analyses yielded similar results. Actual base rate estimates generated from maximum covariance analyses ranged from 0.43 to 0.60, with a mean of 0.55 and standard deviation of 0.08.
For the second set of analyses (each disorder separately compared with the appropriate nonclinical comparison group), none of the mean-above-minus-below-a-cut plots for bulimia nervosa exhibited the characteristic dimensional shape, and all were suggestive of a taxon with a mid-range to low base rate. The maximum covariance analysis plots yielded similar although less impressive results (Table 3). For anorexia nervosa, two of the mean-above-minus-below-a-cut plots were dimensional, two were taxonic, and two were ambiguous. The maximum covariance analysis plots yielded some evidence for a latent taxon, but together, the taxometric analyses did not yield strong support for the presence of an anorexic syndrome that was qualitatively different from normalcy. For the comparison of the binge eating disorder and the normal-weight comparison group, the plots were all very similar and suggested a taxon with a mid-range to low base rate. The same pattern emerged when the data for the obese comparison subjects were included in the comparison.
Finally, we conducted mean-above-minus-below-a-cut analyses and maximum covariance analyses for all four indicators (the three previously identified features and body mass index) by using data for only the eating disorder groups. This set of analyses was designed to test for qualitative versus dimensional characteristics of the three eating disorder groups (i.e., anorexia nervosa, bulimia nervosa, and binge eating disorder). The mean-above-minus-below-a-cut analysis generated 12 plots, with more than half suggestive of a latent taxon and only two suggestive of dimensionality. The maximum covariance analysis results were generally similar; more than half of the plots were rated as taxonic, and none were rated as dimensional. This pattern of results can be viewed as suggestive of discrete syndromes.
Discussion
Using exploratory and confirmatory factor analyses, we found that three latent features described the symptoms of DSM-IV eating disorders: 1) binge eating, 2) fear of fatness/compensatory behaviors, and 3) drive for thinness. Fear of fatness was positively correlated with binge eating and drive for thinness. Binge eating was not significantly correlated with drive for thinness. Eating disorder groups differed on one or more of the dimensions. The bulimia nervosa group scored high on the features of binge eating and fear of fatness/compensatory behaviors but not on drive for thinness. The binge eating disorder group scored high on binge eating but not on the other two features. The binge eating disorder group differed from the obese comparison group on the binge eating feature, which suggests that the severity of binge eating may be a meaningful distinction between these two groups. The anorexia nervosa group scored high on fear of fatness/compensatory behaviors and drive for thinness but not on binge eating. The group with eating disorder not otherwise specified was intermediate to the full syndromes of anorexia nervosa and bulimia nervosa on binge eating and drive for thinness but was equivalent on fear of fatness/compensatory behaviors. These findings support the view that the symptoms of eating disorder not otherwise specified are similar to but less severe than those of the full syndromes of anorexia and bulimia nervosa.
The first set of taxometric analyses suggested that the eating disorders are qualitatively (rather than simply quantitatively) different from the behavior of nonobese persons without eating disorders. These findings are thus inconsistent with the continuum model of eating disorders (13). Although the results of some empirical studies have been interpreted as supporting the continuum model (14, 15), it is important to consider that these studies did not use methods designed to distinguish types from continua. To our knowledge, the current study is the first to conduct taxometric analyses in a study group that included subjects with a diverse set of eating disorder diagnoses as well as obese and normal-weight comparison subjects.
A second finding of the taxometric analyses was that when each disorder was examined separately, results for all but anorexia nervosa suggested the presence of a latent taxon, i.e., a discrete syndrome. With anorexia nervosa, the results were somewhat mixed. These findings are consistent with those of Gleaves et al. (12), who applied taxometric analyses to bulimia nervosa, and Snow (16), who did the same with anorexia nervosa. These findings challenge strictly dimensional models of eating disorders and support the hypothesis that the binge eating symptoms experienced by persons with bulimia nervosa and binge eating disorder may be qualitatively different from those of persons with nonpathological eating behavior. Also, these findings suggest that persons with anorexia nervosa may not differ in kind, but clearly differ in degree, on all three eating disorder symptoms, from individuals with no eating disorder diagnosis.
If the eating disorders as a whole and several of the individual eating disorders are qualitatively different from normalcy, is each disorder qualitatively different from the others (i.e., is there a truly categorical model of the psychopathology of eating disorders)? The third set of taxometric analyses directly addressed this question. When the nonclinical (normal-weight and obese) participants were excluded from the taxometric analyses, we found mixed support for the categorical model of eating disorders: some of the features of eating disorders may indicate latent categories, and other features may indicate latent dimensions. Future research with larger groups of subjects with each type of eating disorder may help determine which disorders are qualitatively different and which exist on one or more continua. Overall, the results of this taxometric study and others (12, 16, 17) suggest that disorders involving binge eating may be more likely to be discrete syndromes. Anorexia nervosa, restricting type, may differ quantitatively but not qualitatively from normalcy.
The results of the factor analytic study provide some support for the three-factor models proposed by Schlundt and Johnson (5), Beumont et al. (6), and Walsh and Garner (3). They postulated that there were three dimensions underlying the categorical scheme of DSM-III-R and DSM-IV eating disorders: binge eating, either fear of fatness or purging, and body size, ranging from very thin to obese.
In summary, the results of this factor analytic and taxometric study suggest that eating disorders, as defined by DSM-IV and as measured by the Interview for the Diagnosis of Eating Disorders—IV, can be conceptualized as having three primary features: 1) binge eating, 2) fear of fatness/compensatory behaviors, and 3) drive for thinness. Furthermore, persons with a diagnosis of an eating disorder appear to differ (at least partly) from persons with nonpathological eating behaviors in kind rather than simply in degree. Finally, some of the differences among the various eating disorders may be qualitative, whereas others may be quantitative, and future taxometric research should attempt to sort out which are which. These studies will require study groups with specific eating disorders that are larger than the groups recruited for this study. An example of this type of research is the study by Gleaves et al. (17), who found evidence that bulimic anorexia and bulimia nervosa are discrete classes from normalcy but may occur on a continuum with one another. They also found that the restricting type of anorexia nervosa may be distinct from both bulimic anorexia and bulimia nervosa.
 |
 |
 |
Received Sept. 27, 1999; revision received July 9, 2001; accepted Aug. 15, 2001. From Louisiana State University and Our Lady of the Lake Regional Medical Center, Baton Rouge, La.; and the Pennington Biomedical Research Center. Address reprint requests to Dr. Williamson, Pennington Biomedical Research Center, 6400 Perkins Rd., Baton Rouge, LA 70808; [email protected] (e-mail).

Figure 1. Sample Graphs From Taxometric Analyses of Whether Diagnostic Factors Have a Taxonic Structure (Discrete Classes) or Are Dimensional (on a Continuum), Based on Analysis of Mean Difference Above Minus Mean Difference Below a Cutoff Score

Figure 2. Sample Graphs From Taxometric Analyses of Whether Diagnostic Factors Have a Taxonic Structure (Discrete Classes) or Are Dimensional (on a Continuum), Based on Maximum Covariance Analysis
1. Adams HE, Cassidy JF: The classification of abnormal behavior, in Comprehensive Handbook of Psychopathology, 2nd ed. Edited by Sutker PB, Adams HE. New York, Plenum, 1993, pp 3-25Google Scholar
2. Fairburn CG, Wilson GT: Binge eating: definition and classification, in Binge Eating: Nature, Assessment, and Treatment. Edited by Fairburn CG, Wilson GT. New York, Guilford, 1993, pp 3-14Google Scholar
3. Walsh BT, Garner DM: Diagnostic issues, in Handbook of Treatment for Eating Disorders. Edited by Garner DM, Garfinkel PE. New York, Guilford, 1997, pp 25-33Google Scholar
4. Williamson DA, Gleaves DH, Savin SS: Empirical classification of eating disorder not otherwise specified: support for DSM-IV changes. J Psychopathology and Behavioral Assessment 1992; 14:201-216Crossref, Google Scholar
5. Schlundt DG, Johnson WG: Eating Disorders: Assessment and Treatment. Boston, Allyn & Bacon, 1990Google Scholar
6. Beumont PJV, Garner DM, Touyz SW: Diagnosis of eating or dieting disorders: what may we learn from past mistakes? Int J Eat Disord 1994; 16:349-362Crossref, Medline, Google Scholar
7. Meehl PE: Bootstraps taxometrics: solving the classification problem in psychopathology. Am Psychol 1995; 50:266-275Crossref, Medline, Google Scholar
8. Waller NG, Meehl PE: Multivariate Taxometric Procedures: Distinguishing Types From Continua. Newbury Park, Calif, Sage Publications, 1997Google Scholar
9. Kutlesic V, Williamson DA, Gleaves DH, Barbin JM, Murphy-Eberenz KP: The Interview for the Diagnosis of Eating Disorders—IV: application to DSM-IV diagnostic criteria. Psychol Assess 1998; 10:41-48Crossref, Google Scholar
10. Joreskog KG, Sorbom D: LISREL VIII: User’s Reference Guide. Chicago, Scientific Software International ICO, 1996Google Scholar
11. Hu L, Bentler PM: Evaluating model fit, in Structural Equation Modeling: Concepts, Issues, and Application. Edited by Hoyle RH. Thousand Oaks, Calif, Sage Publications, 1995, pp 76-99Google Scholar
12. Gleaves DH, Lowe MR, Snow AC, Green BA, Murphy-Eberenz BA: Continuity and discontinuity models of bulimia nervosa: a taxometric investigation. J Abnorm Psychol 2000; 109:56-68Crossref, Medline, Google Scholar
13. Scarano GM, Kalodner-Martin CR: A description of the continuum of eating disorders: implications for intervention and research. J Couns Dev 1994; 72:356-361Crossref, Google Scholar
14. Stice E, Killen JD, Hayward C, Taylor CB: Support for the continuity hypothesis of bulimic pathology. J Consult Clin Psychol 1998; 66:784-790Crossref, Medline, Google Scholar
15. Tylka T, Subich LM: Exploring the construct validity of the eating disorders continuum. J Couns Psychol 1999; 46:268-276Crossref, Google Scholar
16. Snow AC: An examination of the continuity and discontinuity models of anorexia nervosa. Dissertation Abstracts International 1999; 59(12-B):6497Google Scholar
17. Gleaves DH, Lowe MR, Green BA, Cororve MB, Williams TL: Do anorexia and bulimia nervosa occur on a continuum? a taxometric analysis. Behavior Therapy 2000; 31:195-219Crossref, Google Scholar