GABA Transporter-1 mRNA in the Prefrontal Cortex in Schizophrenia: Decreased Expression in a Subset of Neurons
Abstract
OBJECTIVE: Within the prefrontal cortex of schizophrenic subjects, alterations in markers of γ-aminobutyric acid (GABA) neurotransmission, including decreased immunoreactivity for the GABA membrane transporter GAT-1, may be most prominent in a subset of inhibitory neurons. In the present study, the authors sought to determine whether the alterations in GAT-1 protein could be attributed to a reduction in GAT-1 mRNA expression. METHOD: Tissue sections containing prefrontal cortex area 9 from 10 matched pairs of schizophrenic and comparison subjects were processed for in situ hybridization histochemistry with 35S-oligonucleotide probes for GAT-1 mRNA. RESULTS: In the schizophrenic subjects, the relative density of labeled neurons was 21%–33% lower in layers 1–5 of the prefrontal cortex but was unchanged in layer 6. In contrast, cellular levels of GAT-1 mRNA expression, as reflected in grain density per labeled neuron, did not differ by more than 11% between subject groups in any layer. These findings indicate that GAT-1 mRNA expression is relatively unaltered in the majority of prefrontal cortex GABA neurons in schizophrenic subjects but is reduced below a detectable level in a subset of GABA neurons. Furthermore, the magnitude and laminar pattern of these results were strikingly similar to those found in a previous study of mRNA expression for the synthesizing enzyme of GABA, glutamic acid decarboxylase67, in the same subjects. CONCLUSIONS: Both GABA synthesis and reuptake appear to be altered at the level of gene expression in a subset of GABA neurons, and the resulting changes in GABA neurotransmission may contribute to prefrontal cortex dysfunction in schizophrenia.
Multiple components of cortical γ-aminobutyric acid (GABA) neurotransmission appear to be altered in schizophrenia. Presynaptic markers of both GABA synthesis and reuptake are decreased in the cerebral cortex of schizophrenic subjects (1–3), while the density of postsynaptic GABAA receptors is increased in the prefrontal cortex (4, 5). At least some of these findings reflect alterations at the level of gene expression. For example, in the prefrontal cortex of schizophrenic subjects, studies have reported reduced expression of the mRNA encoding the 67-kilodalton isoform of the synthesizing enzyme for GABA, glutamate decarboxylase (GAD67) (6, 7), and one reported a shift in the ratio of the mRNAs encoding the two splice variants of the γ2 subunit of the GABAA receptor (8).
Furthermore, alterations in prefrontal cortex GABA neurotransmission may be most prominent in a subset of inhibitory neurons, including the chandelier neuron subpopulation. The axons of chandelier neurons furnish linear arrays of terminals, termed “cartridges,” which synapse at the axon initial segment of pyramidal neurons (9). These cartridges can be readily identified by their immunoreactivity for an isoform of the GABA membrane transporter (GAT-1) that is responsible for terminating the synaptic activity of GABA by reuptake into nerve terminals (10). It is interesting to note that the density of GAT-1-immunoreactive axon cartridges is reduced in the prefrontal cortex of schizophrenic subjects (11, 12), whereas the relative density of other GAT-1-immunoreactive varicosities is unchanged (11). However, these results do not reveal whether the decrease in GAT-1-immunoreactive axon cartridges could be attributed to alterations in GAT-1 mRNA expression.
Consequently, in this study, we examined cellular levels of GAT-1 mRNA in the prefrontal cortex of subjects with schizophrenia. Since we had previously observed a decrease in GAD67 mRNA expression in a subset of GABA neurons in prefrontal cortex layers 1–5, we predicted 1) that GAT-1 mRNA expression would be relatively unchanged in the majority of GABA neurons but decreased in a subset, 2) that this subset would be distributed across layers 1–5, but not layer 6, of the prefrontal cortex; and 3) that chronic treatment with haloperidol would not account for the decrease in GAT-1 mRNA expression.
Method
Subjects
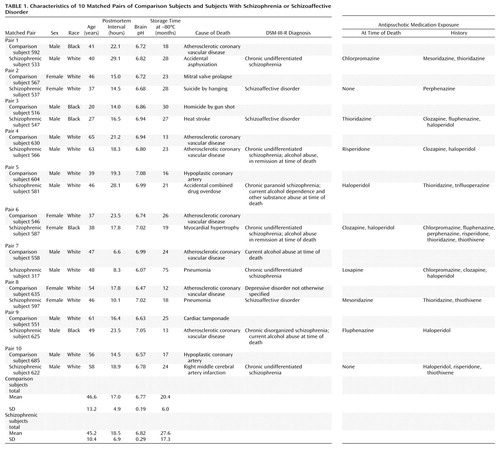
All procedures used in this study were approved by the University of Pittsburgh’s Institutional Review Board for Biomedical Research. After obtaining consent from surviving family members, brain specimens of study subjects were procured during autopsies conducted at the Allegheny County Coroner’s Office. We studied the same 10 matched pairs of schizophrenic and comparison subjects used in our previous study of GAD67 mRNA expression (7). Pairs were completely matched for sex, and the two groups did not differ in terms of age, postmortem interval, brain pH, or tissue storage time (t<1.4, df=9, p>0.21, paired t tests) (Table 1). The mean differences within pairs for age and postmortem interval were 5.0 years (SD=4.0) and 4.8 hours (SD=2.8), respectively. Medical records and the results of structured interviews conducted with family members of the deceased were reviewed for every subject, and an independent panel of experienced clinicians arrived at consensus DSM-III-R diagnoses (13). A history of depressive disorder not otherwise specified was present in a comparison subject, and another was diagnosed with alcohol abuse current at the time of death. In addition, an alcohol or substance abuse disorder history was present in four of the schizophrenic subjects (Table 1). Toxicology studies conducted in all subjects revealed positive plasma alcohol levels (0.01%–0.06%) in three comparison subjects; no other drugs of abuse were detected in any subject. The mean age at the onset of schizophrenia was 26.4 years (SD=10.4), and the average duration of illness was 18.8 years (SD=8.0). Two of the schizophrenic subjects were not receiving antipsychotic medications at time of death. The majority of subjects (seven schizophrenic and nine comparison subjects) died suddenly outside of a hospital setting. Neuropathological examination of each brain revealed that subject 622 had an infarction limited to the distribution of the inferior branch of the right middle cerebral artery, but the region of interest for this study appeared unaffected. Alzheimer’s disease was excluded in each subject on the basis of clinical and neuropathological criteria.
Tissue Preparation and in Situ Hybridization Procedure
Coronal tissue sections containing the superior frontal gyrus of the right prefrontal cortex were cut (20 μm), and every 10th section was stained for Nissl substance and used to identify the location of area 9 according to cytoarchitectonic criteria (14).
A cocktail of three oligonucleotide probes (Oligos Etc., Wilsonville, Ore.) complementary to bases 387–419, 1462–1506, and 2124–2170 of the human GAT-1 cDNA were used to detect GAT-1 mRNA (15). In addition to anatomical evidence (see Results section), the specificity of the probes for GAT-1 mRNA was supported by 1) a GeneBank inquiry showing that the sequences of each probe were uniquely complementary to GAT-1 mRNA, 2) the limited amino acid sequence homology (~50%) of GAT-1 to the other two primary GAT isoforms, GAT-2 and GAT-3 (10), and 3) the negligible expression of both GAT-2 and GAT-3 mRNA in the neocortex (16). The probes were radiolabeled with 35S-dATP (NEN, Boston) by using terminal deoxynucleotidyl transferase (Bethesda Research Laboratories, Gaithersburg, Md.). All tissue sections from each pair of subjects were processed together. Eight sections from each subject were processed for in situ hybridization histochemistry as previously described (7), developed after 5.5 weeks of exposure to nuclear emulsion, and counterstained for Nissl substance. Slides were coded to conceal subject number and diagnosis from the rater (D.W.V.).
Quantification of GAT-1 mRNA Expression
The procedure used to quantify the expression of GAT-1 mRNA was similar to that used to quantify GAD67 mRNA expression in a previous study (7). By means of a Microcomputer Imaging Device (MCID, Imaging Research Inc., London, Ontario), three 140 μm × 140 μm sampling frames were randomly placed in each of six laminar locations (layers 1, 2, superficial layer 3, the layer 3–4 border, and layers 5 and 6) on four tissue sections from each subject. By using MCID software and a Leitz Diaplan microscope with a 40× objective, the bright field image of the sampling frame was digitized, and the outline of each Nissl-stained soma with at least three overlying silver grains was traced on the computer monitor. In a dark field image of the same sampling frame, the number of grains over each encircled cell was then counted by the MCID system. The mean number of neurons sampled in each layer in each subject ranged from 55 (SD=12) in layer 6 to 112 (SD=19) at the layer 3–4 border, and the mean coefficient of error for neuron counts in each layer of each subject ranged from 0.07 (SD=0.02) at the layer 3–4 border to 0.10 (SD=0.03) in layers 1 and 6.
Data Analysis
To measure the relative level of GAT-1 mRNA expression per neuron, grain density per neuron (number of grains/100 μm2 somal area) was determined for each sampled cell. A threshold of grain density per neuron was also established in order to exclude nonspecifically labeled neurons from analysis (7). Histograms of grain density per neuron for all sampled neurons from the comparison and schizophrenic groups revealed distributions that appeared bimodal in each layer, representing the modes of nonspecifically and specifically labeled neuron populations (17). Similar histograms that included only neurons with a grain density greater than 2× background (background grain density as measured in the subjacent white matter of the same tissue section) showed distributions that appeared normal and unimodal in both the comparison and schizophrenic groups. Therefore, a threshold of 2× background provided a cutoff at the point of rarity in the distribution of all cells that permitted the identification of specifically labeled neurons, referred to as GAT-1 mRNA-positive (+) neurons.
Some glial cells may express GAT-1 mRNA (18). Consequently, glial cells clearly identified by the presence of a dark Nissl-stained nucleus, the absence of cytoplasm, and a small, round shape, were not sampled. To ensure that all glial cells were excluded from the final data analysis, we compared the size of neurons labeled for GAD67 mRNA, which is expressed selectively in GABA neurons, with the size of GAD67 mRNA-negative cells that had the morphological features of glial cells, on tissue sections from the same subjects (7). The distributions of cross-sectional somal areas for these two cell classes intersected at 50 μm2, creating a cutoff point where >80% of glial cells but <20% of GABA neurons where excluded. Therefore, only GAT-1 mRNA+ cells with a somal size greater than 50 μm2 were included in the final data analyses.
Haloperidol-Treated Monkeys
To mimic the pharmacological treatment of schizophrenia, four male cynomolgus (Macaca fascicularis) monkeys, matched individually to a control monkey for sex, age, and weight, were treated with haloperidol decanoate (mean trough serum levels: 4.3 ng/ml, SD=1.1) and benztropine mesylate for 9 to 12 months (12). Tissue processing procedures and data analysis were similar to those described above. However, in contrast to the human subjects, a threshold of 7× background was required to obtain a unimodal distribution of labeled neurons in the control monkeys. This threshold reflected a shift in background grain deposition that was likely due to differences in the tissue samples (i.e., different species, shorter postmortem interval, etc.). The mean coefficient of error for neuron counts in each layer of each monkey ranged from 0.07 (SD=0.01) in layer 2 to 0.09 (SD=0.02) in layer 5.
Statistical Analysis
Based on our previous finding of decreased GAD67 mRNA+ neuron density in layers 1 through 5 in subjects with schizophrenia (7), we hypothesized that GAT-1 mRNA+ neuron density would also be decreased in layers 1 through 5 in the same cohort of subjects. To test this hypothesis, we first determined whether diagnostic group had an overall effect on GAT-1 mRNA+ neuron density across layers 1 through 5. For each section, the value of the dependent variable (neuron density) was averaged across the three sampling frames for each cortical layer, with the value of each sampling frame weighted by the number of observations within that frame. Thus, in each layer, four section averages were obtained for the dependent variable. These four averages were treated as repeated measures with a compound symmetric covariance structure (19), since the values were possibly correlated and were also exchangeable within a given subject. Pair effect was included in order to reflect the matching of schizophrenic and comparison subjects for sex, age, and postmortem interval. Postmortem brain pH was included as a covariate because it may reflect the integrity of some mRNA species (20). Thus, the effect of diagnostic group on GAT-1 mRNA+ neuron density collectively for layers 1 through 5 was examined by using a multivariate analysis of covariance (MANCOVA) model with the four section averages having a compound symmetric covariance matrix, with pair as a blocking effect and with brain pH and cortical layer as covariates. To determine whether GAT-1 mRNA+ neuron density was decreased in each individual cortical layer, a one-sided t test, based upon least squares means adjusted for brain pH and pair with a significance threshold set at p<0.05, was employed.
Our previous study of GAD67 mRNA expression in schizophrenia (7) did not find a difference in grain density or somal size of GAD67 mRNA+ neurons. Therefore, we hypothesized that in the same cohort of subjects with schizophrenia, these dependent variables would not be altered in GAT-1 mRNA+ neurons in any cortical layer. Thus, for each cortical layer, an intraclass MANCOVA model with pair as a blocking effect and with brain pH as a covariate was used to examine differences between groups.
To directly compare the results of our previous study of GAD67 mRNA expression to the results of the present study of GAT-1 mRNA expression in the same cohort of subjects (7), we also applied a somal size cutoff of 50 μm2 to the previous GAD67 mRNA data. A Pearson correlation was then used to compare the differences within each pair of schizophrenic and comparison subjects in the densities of GAD67 mRNA+ and GAT-1 mRNA+ neurons across all layers.
For the haloperidol-treated monkeys, paired t tests were used to determine the effect of treatment group on each of the three dependent variables in each cortical layer.
Results
The specificity of the oligonucleotide probes for GAT-1 mRNA was demonstrated by the similarities of the GAT-1 mRNA+ neurons to the known morphological characteristics and laminar distribution of GABA neurons. First, a specific hybridization signal—the clustering of silver grains over Nissl-stained cell bodies—was clearly present for small- and medium-sized neurons but was noticeably absent for pyramidal neurons (Figure 1). Second, as shown in Figure 2, the relative laminar densities of GAT-1 mRNA+ neurons, greatest in layers 2 and 4 and lowest in layer 6, matched previous reports of the laminar distribution of GAD67 mRNA+ neurons in human prefrontal cortex (6, 7).
As illustrated in Figure 3, the density of grain clusters, which represent GAT-1 mRNA+ neurons, appears to be less in schizophrenic subjects. Indeed, the mean density of GAT-1 mRNA+ neurons in layers 1–5 was decreased by 21%–33% in the subjects with schizophrenia, but was unchanged in layer 6 (Figure 4, top). The overall MANCOVA for layers 1–5 demonstrated a significant effect of diagnosis (F=5.32, df=1, 8, p=0.05), and analyses within layers revealed that GAT-1 mRNA+ neuron density in the schizophrenic subjects was significantly lower in layer 1 (t=4.03, df=8, p=0.002), layer 2 (t=2.28, df=8, p<0.03), superficial layer 3 (t=2.07, df=8, p<0.04), and at the layer 3–4 border (t=3.29, df=8, p=0.006); the difference in layer 5 did not achieve significance (t=1.64, df=8, p=0.07). Furthermore, in each of layers 1 through 4, between six and nine of the 10 subjects with schizophrenia showed a lower GAT-1 mRNA+ neuron density relative to their matched comparison subject (Figure 5, top half). In addition, the differences between subject groups in layers 1–4 could not be attributed to the effects of postmortem brain pH (F<3.02, df=1, 8, p>0.12).
In contrast, grain density of GAT-1 mRNA+ neurons (bottom halves of Figures 4 and 5), a relative measure of the cellular level of GAT-1 mRNA expression, did not differ between subjects with schizophrenia and the comparison group in layer 2, superficial layer 3, layer 5, or layer 6 (F<1.57, df=1, 8, p>0.24). Mean grain density per neuron was 11% lower in the subjects with schizophrenia at the layer 3–4 border (F=11.73, df=1, 8, p=0.009) and was 8% lower in layer 1 (F=4.54, df=1, 8, p<0.07).
The mean cross-sectional somal area (in μm2) of GAT-1 mRNA+ neurons did not significantly differ (df=1, 8 for all analyses) between the schizophrenic and comparison groups in any layer (layer 1: mean=65.4 [SD=4.4] and 65.4 [SD=6.4], respectively, F=0.26, p>0.62; layer 2: mean=67.0 [SD=2.3] and 69.4 [SD=6.7], F=0.97, p>0.35; superficial layer 3: mean=76.7 [SD=7.8] and 84.1 [SD=7.4], F=4.69, p>0.06; layer 3–4 border: mean=75.7 [SD=8.5] and 74.9 [SD=6.7], F=0.00, p>0.94; layer 5: mean=80.5 [SD=8.7] and 83.5 [SD=6.7], F=0.91, p>0.36; layer 6: mean=75.8 [SD=12.5] and 78.7 [SD=15.8], F=0.98, p>0.35). As previously reported, cortical thickness also did not differ between the subject groups (7).
As shown in Figure 6, the lower density of GAT-1 mRNA+ neurons in the subjects with schizophrenia paralleled lower GAD67 mRNA+ neuron density in layers 1–5, whereas neither was decreased in layer 6. Furthermore, across layers 1–5, the differences in GAT-1 mRNA+ neuron density and GAD67 mRNA+ neuron density within subject pairs were significantly correlated (r=0.47, df=8, p=0.001).
In both the haloperidol-treated and control monkeys, the morphological characteristics and laminar distribution of GAT-1 mRNA+ neurons were similar to the observations in humans and to previous studies of other markers of GABA neurons in monkeys (7, 21). Specifically, clusters of silver grains were found exclusively over small- and medium-sized neurons, and the density of GAT-1 mRNA+ neurons was greatest in layers 2 and 4. However, neither density (t<2.14, df=3, p>0.12), grain density (t<1.27, df=3, p>0.29), nor somal size (t<1.60, df=3, p>0.20) of the GAT-1 mRNA+ neurons differed significantly between haloperidol-treated and control monkeys in any layer.
Discussion
In the prefrontal cortex of subjects with schizophrenia, the mean density of neurons expressing a detectable level of GAT-1 mRNA was 21%–33% lower in layers 1–5 but was unchanged in layer 6 relative to matched comparison subjects. In contrast, the mean grain density per GAT-1 mRNA+ neuron, a relative measure of the cellular level of GAT-1 mRNA expression, did not differ between schizophrenic and comparison subjects by more than 11% in any cortical layer. These results indicate that GAT-1 mRNA expression is relatively unaltered or only slightly reduced in the majority of prefrontal cortex GABA neurons in schizophrenia but is reduced below a detectable level in a subset of GABA neurons (Figure 7, left panel).
These findings do not appear to be attributable to treatment with antipsychotic medications. For example, although seven of the schizophrenic subjects in this study had received haloperidol at some point (Table 1), long-term exposure of monkeys to therapeutic serum levels of haloperidol did not produce detectable changes in GAT-1 mRNA expression. Consistent with this finding, previous studies did not show a decrease in GAT-1 protein in association with antipsychotic medications (11, 12).
Of the four subjects with schizophrenia who met criteria for substance abuse disorder, two subjects (587 and 625) actually showed an increase in GAT-1 mRNA+ neuron density in layer 2, superficial layer 3, and layer 5 (Figure 5, top half), which suggests that substance abuse does not consistently decrease GAT-1 mRNA expression. mRNA instability in postmortem tissue also did not appear to be a confound because 1) the cellular levels of GAT-1 mRNA, GAD67 mRNA (7), and synaptophysin mRNA (22) were relatively unaltered in the majority of neurons in the present cohort of subjects, and 2) brain pH was in the range associated with mRNA stability (20) and did not differ between the two subject groups. Finally, the procedures used to assess relative neuron density employed, by necessity, a profile counting method. However, this approach was not confounded by differences in somal size between the diagnostic groups, and use of an Abercrombie correction would not have changed the relative differences in neuron density across subject groups (7).
The decrease in density of GAT-1 mRNA+ neurons does not appear to be due to a decrease in the number of prefrontal cortex neurons in the subjects with schizophrenia because most, although not all (23), previous studies have reported no change (6), an increase in neuron density (24), or no change in total neuron number (25), in the prefrontal cortex of subjects with schizophrenia. Consistent with these observations, in the same cortical region of the same subjects with schizophrenia used in the present study, we found no differences in the density of neurons expressing synaptophysin mRNA (22), which is found in virtually every cortical neuron. However, GABA neurons represent only approximately 25% of the total number of neurons in the prefrontal cortex, and studies of total prefrontal cortex cell number or density may not be sensitive enough to detect a reduction in number of a subset of GABA neurons.
For both the human and monkey studies, a unique threshold of grain density per neuron relative to the background grain density in the white matter was created to exclude nonspecifically labeled neurons from the analysis. The appropriateness of each threshold was confirmed 1) by the laminar distribution of GAT-1 mRNA+ neurons, which paralleled the known distribution of GABA neurons, and 2) by the similarities between the densities of GAT-1 mRNA+ neurons and GAD67 mRNA+ neurons in each layer. Furthermore, applying a more stringent threshold (i.e., 5× background grain density) to the human GAT-1 mRNA study resulted in a similar laminar specificity of differences between subject groups and did not increase the magnitude of the differences, which suggests that the entire affected subset of GABA neurons expressed levels of GAT-1 mRNA beneath the 2× background threshold of detectability. In addition, eliminating the somal size cutoff of 50 μm2 resulted in the same magnitude of differences in both neuron density and grain density of GAT-1 mRNA+ neurons between subject groups.
Altered gene expression of presynaptic components of GABA neurotransmission appears to be common in schizophrenia. In the prefrontal cortex, studies that have used different cohorts of subjects have found decreased expression of GAD67 mRNA (6, 7, 26) and GAT-1 mRNA (27), although in the latter study, the specificity of the probes for GAT-1 mRNA was not clearly demonstrated, since primarily pyramidal neurons were labeled. Furthermore, in the same cohort of subjects, both GAD67 mRNA+ and GAT-1 mRNA+ neurons showed similar reductions in density that were restricted to layers 1–5 (Figure 6). These similarities suggest that these two markers may be affected to the same extent in individual subjects with schizophrenia, and thus, may be altered within the same subset of GABA neurons.
One specific subpopulation of cortical GABA neurons, the chandelier subclass, has been previously implicated in the pathophysiology of schizophrenia. GAT-1 protein has been reported to be selectively altered in the axon cartridges of chandelier neurons (11, 12). However, it was unclear whether the decrease in GAT-1 immunoreactive axon cartridges resulted from alterations in gene transcription. It is interesting to note that our results suggest that decreased GAT-1 mRNA expression in chandelier neurons may account for the decreased density of GAT-1-immunoreactive axon cartridges in schizophrenia (Figure 7, right side). First, the density of GAT-1 mRNA+ neurons was decreased in the same layers in which chandelier neurons are found, prefrontal cortex layers 2–5, which suggests that chandelier neurons may be included in the subset of GABA neurons expressing an undetectable level of GAT-1 mRNA. Furthermore, Pearson correlation analyses conducted on the nine subjects with schizophrenia included in both this GAT-1 mRNA study and the previous study of GAT-1-immunoreactive axon cartridges (12) revealed positive associations between the densities of GAT-1 mRNA+ neurons and GAT-1-labeled cartridges in the superficial (r=0.61, df=7, p=0.08), middle (r=0.44, df=7, p=0.23), and deep (r=0.64, df=7, p=0.07) cortical layers, even though the GAT-1-labeled cartridges and GAT-1 mRNA+ neurons were quantified in the left and right prefrontal cortex, respectively. Although these comparisons have the aforementioned limitations, they are consistent with the idea that lower density of GAT-1-immunoreactive axon cartridges reflects decreased GAT-1 protein secondary to decreased GAT-1 mRNA expression in chandelier neurons. However, the magnitude of the decrease in GAT-1 mRNA+ neuron density suggests that other subpopulations of GABA neurons, in addition to chandelier neurons, may also be affected.
Alterations in gene expression restricted to a subset of GABA neurons in prefrontal cortex layers 1–5 might reflect the developmental origin of this subset of neurons. For example, although the majority of neurons in the primate neocortex migrate radially from the subventricular zone during the second trimester of gestation (28), many GABA neurons appear to find their final location in the cortex following a tangential migration from the ganglionic eminences (29). Although it is not known what proportion of GABA neurons originate from each of these two sources, and to which cortical layers these neurons migrate, it is possible that the site of embryonic origin may be associated with a greater susceptibility to altered gene expression in schizophrenia. Alternatively, the subset of GABA neurons affected in schizophrenia could include those that are a product of postnatal neurogenesis. It is interesting to note that in monkeys, cortical neurons that originate during adulthood appear to migrate selectively to layers 1–5, but not to layer 6, of association regions (30). Although speculative, these comparisons may provide novel clues as to links between either pre- or postnatal developmental events and the specific types of cortical circuitry abnormalities observed in schizophrenia.
Alternatively, an abnormality in afferents from another brain region may be the pathophysiological mechanism behind alterations in GABA markers in the prefrontal cortex in schizophrenia. For example, the number of neurons in the mediodorsal nucleus of the thalamus, which projects to the prefrontal cortex (31), has been reported to be lower in schizophrenia (32, 33). Furthermore, a decrease in thalamic relay input to the cortex can produce a decreased expression of the gene products regulating GABA neurotransmission in layer 4 and adjacent layers, at least in the visual cortex of monkeys (34, 35). However, additional studies are needed to determine whether a loss of input from the mediodorsal nucleus accounts for the decreased expression of GAD67 and GAT-1 mRNA in a subset of prefrontal cortex neurons in schizophrenia.
 |
Presented in part at the 29th annual meeting of the Society for Neuroscience, Miami, Nov. 23–28, 1999, and the 55th annual meeting of the Society of Biological Psychiatry, Chicago, May 11–13, 2000. Received June 6, 2000; revision received Oct. 2, 2000; accepted Oct. 9, 2000. From the Departments of Neuroscience, Psychiatry, and Statistics, University of Pittsburgh. Address reprint requests to Dr. Lewis, University of Pittsburgh, 3811 O’Hara St., W1650 BST, Pittsburgh, PA 15213; [email protected] (e-mail). Supported by NIH grants MH-43784, MH-00519, and MH-45156.

Figure 1. GAT-1 mRNA Expression in Prefrontal Cortex Area 9 of a Comparison Subjecta
aThis bright field photomicrograph from comparison subject 604 was processed by in situ hybridization then counterstained with cresyl violet. Note the accumulation of grains over small and medium-sized neurons (red open arrows) but not over the larger pyramidal neurons (blue solid arrows).

Figure 2. Laminar Distribution of GAT-1 mRNA+ Neurons in Prefrontal Cortex Area 9 of a Comparison Subjecta
aThis dark field photomicrograph from comparison subject 685 shows the higher density of grain clusters in layers 2 and 4, the intermediate density in layers 3 and 5, and the low density of grain clusters in layers 1 and 6. This pattern matches the known distribution of GABA neurons.

Figure 3. GAT-1 mRNA+ Neuron Density at the Layer 3–4 Border of Prefrontal Cortex Area 9 in a Matched Comparison-Schizophrenic Subject Paira
aIn these dark field photomicrographs from comparison subject 685 and schizophrenic subject 622 (pair 10), note that the density of grain clusters, which represent GAT-1 mRNA+ neurons, is less in the subject with schizophrenia than in the comparison subject but that the sizes of the grain clusters are similar in the two subjects.

Figure 4. Cell Density and Grain Density of GAT-1 mRNA+ Neurons in Comparison and Schizophrenic Subjects for Each Layer of Prefrontal Cortex Area 9a
aHorizontal bars represent the means of each subject group. Analyses within layers revealed that GAT-1 mRNA+ neuron density was significantly lower in the schizophrenic subjects at layers 1 and 2 and at superficial layer 3 and the layer 3–4 border, with a nonsignificantly lower density at layer 5. In contrast, grain density of GAT-1 mRNA+ neurons did not differ between the two groups at layer 2, superficial layer 3, layer 5, or layer 6 but was significantly lower in the schizophrenic subjects at the layer 3–4 border and nonsignificantly lower at layer 1.
bSuperficial layer 3.

Figure 5. Differences in Cell Density and Grain Density of GAT-1 mRNA+ Neurons Within Matched Comparison-Schizophrenic Subject Pairs for Each Layer of Prefrontal Cortex Area 9a
aNegative values indicate a lower density for the schizophrenic subject.

Figure 6. Density of GAT-1 and GAD67 mRNA+ Neurons in Each Layer of Prefrontal Cortex Area 9 in Schizophrenic and Comparison Subjects
aSuperficial layer 3.

Figure 7. Affected GABA Neurons in Schizophreniaa
aThe left side of the diagram shows that approximately 25% of GABA neurons in layers 1–5 of prefrontal cortex area 9 in schizophrenic subjects express undetectable levels of GAT-1 mRNA. The right side of the diagram illustrates the unique relationship between chandelier neurons, which appear to be included in the subset of affected GABA neurons, and pyramidal neurons, the axons of which provide excitatory input to other cortical regions. Immunoreactivity for GAT-1 protein is lower than normal in the axon cartridges (vertical arrays of axon terminals) of chandelier neurons, which form inhibitory synapses exclusively at the axon initial segment of pyramidal neurons.
1. Sherman AD, Davidson AT, Baruah S, Hegwood TS, Waziri R: Evidence of glutamatergic deficiency in schizophrenia. Neurosci Lett 1991; 121:77–80Crossref, Medline, Google Scholar
2. Impagnatiello F, Guidotti AR, Pesold C, Dwivedi Y, Caruncho H, Pisu MG, Uzunov DP, Smalheiser NR, Davis JM, Pandey GN, Pappas GD, Teuting P, Sharma RP, Costa E: A decrease of reelin expression as a putative vulnerability factor in schizophrenia. Proc Natl Acad Sci USA 1998; 95:15718–15723Google Scholar
3. Simpson MDC, Slater P, Deakin JFW, Royston MC, Skan WJ: Reduced GABA uptake sites in the temporal lobe in schizophrenia. Neurosci Lett 1989; 107:211–215Crossref, Medline, Google Scholar
4. Hanada S, Mita T, Nishino N, Tanaka C: [3H]Muscimol binding sites increased in autopsied brains of chronic schizophrenics. Life Sci 1987; 40:239–266Crossref, Medline, Google Scholar
5. Benes FM, Vincent SL, Alsterberg G, Bird ED, SanGiovanni JP: Increased GABAA receptor binding in superficial layers of cingulate cortex in schizophrenics. J Neurosci 1992; 12:924–929Crossref, Medline, Google Scholar
6. Akbarian S, Kim JJ, Potkin SG, Hagman JO, Tafazzoli A, Bunney WE Jr, Jones EG: Gene expression for glutamic acid decarboxylase is reduced without loss of neurons in prefrontal cortex of schizophrenics. Arch Gen Psychiatry 1995; 52:258–266Crossref, Medline, Google Scholar
7. Volk DW, Austin MC, Pierri JN, Sampson AR, Lewis DA: Decreased GAD67 mRNA expression in a subset of prefrontal cortical GABA neurons in subjects with schizophrenia. Arch Gen Psychiatry 2000; 57:237–245Crossref, Medline, Google Scholar
8. Huntsman MM, Tran BV, Potkin SG, Bunney WE, Jones EG: Altered ratios of alternatively spliced long and short gamma 2 subunit mRNAs of the gamma-amino butyrate type A receptor in prefrontal cortex of schizophrenics. Proc Natl Acad Sci USA 1998; 95:15066–15071Google Scholar
9. Peters A: Chandelier cells, in Cerebral Cortex, vol 1. Edited by Jones EG, Peters A. New York, Plenum, 1984, pp 361–380Google Scholar
10. Borden LA: GABA transporter heterogeneity: pharmacology and cellular localization. Neurochem Int 1996; 29:335–356Crossref, Medline, Google Scholar
11. Woo T-U, Whitehead RE, Melchitzky DS, Lewis DA: A subclass of prefrontal gamma-aminobutyric acid axon terminals are selectively altered in schizophrenia. Proc Natl Acad Sci USA 1998; 95:5341–5346Google Scholar
12. Pierri JN, Chaudry AS, Woo T-UW, Lewis DA: Alterations in chandelier neuron axon terminals in the prefrontal cortex of schizophrenic subjects. Am J Psychiatry 1999; 156:1709–1719Google Scholar
13. Glantz LA, Lewis DA: Reduction of synaptophysin immunoreactivity in the prefrontal cortex of subjects with schizophrenia: regional and diagnostic specificity. Arch Gen Psychiatry 1997; 54:943–952Crossref, Medline, Google Scholar
14. Daviss SR, Lewis DA: Local circuit neurons of the prefrontal cortex in schizophrenia: selective increase in the density of calbindin-immunoreactive neurons. Psychiatry Res 1995; 59:81–96Crossref, Medline, Google Scholar
15. Nelson H, Mandiyan S, Nelson N: Cloning of the human brain GABA transporter. FEBS Lett 1990; 269:181–184Crossref, Medline, Google Scholar
16. Durkin MM, Smith KE, Borden LA, Weinshank RL, Branchek TA, Gustafson EL: Localization of messenger RNAs encoding three GABA transporters in rat brain: an in situ hybridization study. Mol Brain Res 1995; 33:7–21Crossref, Medline, Google Scholar
17. Gerfen CR, McGinty JF, Young WS: Dopamine differentially regulates dynorphin, substance P, and enkephalin expression in striatal neurons: in situ hybridization histochemical analysis. J Neurosci 1991; 11:1016–1031Google Scholar
18. Minelli A, Brecha NC, Karschin C, DeBiasi S, Conti F: GAT-1, a high-affinity GABA plasma membrane transporter, is localized to neurons and astroglia in the cerebral cortex. J Neurosci 1995; 15:7734–7746Google Scholar
19. Neter J, Kutner MH, Nachtsheim CJ, Wasserman W: Applied Linear Statistical Models, 4th ed. Chicago, Irwin, 1996Google Scholar
20. Harrison PJ, Heath PR, Eastwood SL, Burnet PWJ, McDonald B, Pearson RCA: The relative importance of premortem acidosis and postmortem interval for human brain gene expression studies: selective mRNA vulnerability and comparison with their encoded proteins. Neurosci Lett 1995; 200:151–154Crossref, Medline, Google Scholar
21. Hendry SHC, Schwark HD, Jones EG, Yan J: Numbers and proportions of GABA-immunoreactive neurons in different areas of monkey cerebral cortex. J Neurosci 1987; 7:1503–1519Google Scholar
22. Glantz LA, Austin MC, Lewis DA: Normal cellular levels of synaptophysin mRNA expression in the prefrontal cortex of subjects with schizophrenia. Biol Psychiatry 2000; 48:389–397Crossref, Medline, Google Scholar
23. Benes FM, McSparren J, Bird ED, SanGiovanni JP, Vincent SL: Deficits in small interneurons in prefrontal and cingulate cortices of schizophrenic and schizoaffective patients. Arch Gen Psychiatry 1991; 48:996–1001Google Scholar
24. Selemon LD, Rajkowska G, Goldman-Rakic PS: Abnormally high neuronal density in the schizophrenic cortex: a morphometric analysis of prefrontal area 9 and occipital area 17. Arch Gen Psychiatry 1995; 52:805–818Crossref, Medline, Google Scholar
25. Thune JJ, Hofsten DE, Uylings HBM, Pakkenberg B: Total neuron numbers in the prefrontal cortex in schizophrenia. Abstracts of the Society for Neuroscience 1998; 24:985Google Scholar
26. Guidotti A, Auta J, Davis JM, Gerevini VD, Dwivedi Y, Grayson DR, Impagnatiello F, Pandey G, Pesold C, Sharma R, Uzunov D, Costa E: Decrease in reelin and glutamic acid decarboxylase67 (GAD67) expression in schizophrenia and bipolar disorder. Arch Gen Psychiatry 2000; 57:1061–1069Google Scholar
27. Ohnuma T, Augood SJ, Arai H, McKenna PJ, Emson PC: Measurement of GABAergic parameters in the prefrontal cortex in schizophrenia: focus on GABA content, GABAA receptor α-1 subunit messenger RNA and human GABA transporter-1 (HGAT-1) messenger RNA expression. Neuroscience 1999; 93:441–448Crossref, Medline, Google Scholar
28. Rakic P: Specification of cerebral cortical areas. Science 1988; 241:170–176Crossref, Medline, Google Scholar
29. Anderson S, Mione M, Yun K, Rubenstein JLR: Differential origins of neocortical projection and local circuit neurons: role of DIx genes in neocortical interneuronogenesis. Cereb Cortex 1999; 9:646–654Crossref, Medline, Google Scholar
30. Gould E, Reeves AJ, Graziano MSA, Gross CG: Neurogenesis in the neocortex of adult primates. Science 1999; 286:548–552Crossref, Medline, Google Scholar
31. Goldman-Rakic PS, Porrino LJ: The primate mediodorsal (MD) nucleus and its projection to the frontal lobe. J Comp Neurol 1985; 242:535–560Crossref, Medline, Google Scholar
32. Pakkenberg B: Pronounced reduction of total neuron number in mediodorsal thalamic nucleus and nucleus accumbens in schizophrenics. Arch Gen Psychiatry 1990; 47:1023–1028Google Scholar
33. Young KA, Manaye KF, Liang C-L, Hicks PB, German DC: Reduced number of mediodorsal and anterior thalamic neurons in schizophrenia. Biol Psychiatry 2000; 47:944–953Crossref, Medline, Google Scholar
34. Hendry SHC, Jones EG: Activity-dependent regulation of GABA expression in the visual cortex of adult monkeys. Neuron 1988; 1:701–712Crossref, Medline, Google Scholar
35. Benson DL, Huntsman MM, Jones EG: Activity-dependent changes in GAD and preprotachykinin mRNAs in visual cortex of adult monkeys. Cereb Cortex 1994; 4:40–51Crossref, Medline, Google Scholar