Evidence for a Gender-Related Effect of Alcoholism on Brain Volumes
Abstract
OBJECTIVE: The goal of this study was to compare brain volumes of alcoholic and nonalcoholic men and women and determine if the magnitudes of differences in brain volumes between alcoholic women and nonalcoholic women are greater than the magnitudes of the differences between alcoholic men and nonalcoholic men. METHOD: The study group included 118 subjects: 79 inpatients 30–60 years of age who were alcohol dependent but had no clinically apparent cognitive impairment or medical illness (43 men and 36 women) and 39 healthy comparison subjects of similar age who were not alcoholic (20 men and 19 women). The volume of intracranial contents was segmented into gray matter, white matter, sulcal CSF, and ventricular CSF from a T1-weighted magnetic resonance image obtained after the alcoholic subjects had attained 3 weeks of sobriety. RESULTS: Alcoholic women had significantly smaller volumes of gray and white matter as well as greater volumes of sulcal and ventricular CSF than nonalcoholic women. The differences in gray and white matter volumes between alcoholic and nonalcoholic men were significant, but the significance of these differences was of a smaller magnitude than the significance of the differences between alcoholic and nonalcoholic women. Direct comparisons of alcoholic men and women showed that the proportion of intracranial contents occupied by gray matter was smaller in alcoholic women than in alcoholic men. The magnitudes of differences in brain volumes adjusted for intracranial size between alcoholic women and nonalcoholic women were greater than the magnitudes of the adjusted differences between alcoholic men and nonalcoholic men. CONCLUSIONS: These results are consistent with greater sensitivity to alcohol neurotoxicity among women.
Over the past two decades researchers have recognized that there may be important differences in how rapidly the disease of alcoholism progresses in men and women. Although, in general, alcoholic women begin to drink excessively later in life than alcoholic men, they often develop adverse consequences of alcoholism sooner than their male counterparts (1). For example, alcoholic women develop cirrhosis (2) and alcohol-induced cardiomyopathy (3) after fewer years of heavy drinking than alcoholic men. The role of gender in the development of central nervous system complications of alcoholism, however, is less clear.
Many studies have found small, but usually significant differences in the brain volumes of alcoholic men compared with nonalcoholic men. Two magnetic resonance imaging (MRI) analyses of the brains of male alcoholics found smaller volumes of gray and white matter as well as larger amounts of CSF (4, 5). Unfortunately, the study of brain structure among alcoholic women has been largely neglected. Two studies using computerized tomography to measure CSF have compared the brain structure of male and female alcoholics (6, 7). Both reported that male and female alcoholics show similarly greater intracranial CSF than control subjects, despite a shorter duration of excessive drinking and a smaller average daily alcohol consumption among the women. In contrast, in one report (8) MRI failed to detect enlarged cerebral ventricles in alcoholic women, although ventricular enlargement has been reported in alcoholic men (9).
We used high-resolution, volumetric MRI to measure total intracranial CSF, gray matter, and white matter in abstinent alcoholic men and women and similarly aged healthy comparison subjects who were not alcoholic. Because women’s heads and brains are smaller than men’s and because men and women may differ in the proportion of gray to white matter (10), we compared men and women separately. In addition, to compare male and female alcoholics directly we constructed ratios of brain volumes to intracranial volume minus the brain volume of interest.
Method
Subjects
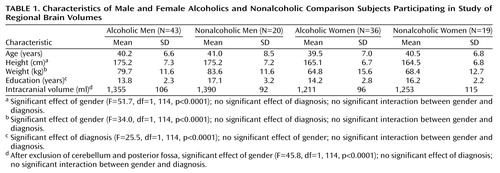
As depicted in Table 1, 43 alcoholic men, 36 alcoholic women, 20 healthy men who were not alcoholic, and 19 healthy women who were not alcoholic participated in the study. Alcoholic subjects were recruited from among all of the alcoholic patients admitted to the National Institute of Alcohol Abuse and Alcoholism (NIAAA) inpatient unit at the Clinical Center of the National Institutes of Health (NIH) between 1994 and 1998. Nonalcoholic comparison subjects were recruited through the Normal Subject Office of the Clinical Center of NIH. All subjects were between 30 and 60 years old. They were interviewed with the Structured Clinical Interview for DSM-III-R (11). Information on recent and chronic alcohol use was obtained from structured research questionnaires (12). All subjects provided written informed consent to participate in the study, which was approved by the NIAAA Institutional Review Board.
All alcoholic patients met DSM-III-R criteria for alcohol dependence. Patients who met the criteria for alcohol abuse but not alcohol dependence or who had a history of delirium tremens or psychotic disorders were excluded. In addition, patients whose IQ was less than 80 or who demonstrated signs of dementia or Korsakoff’s disease were excluded. No subjects were thiamine deficient at admission. Subjects with a history of intravenous drug use at any time during their life or substance dependence other than alcohol or tobacco in the 6 months preceding admission were excluded. The comparison subjects had no disorders meeting DSM-III-R criteria and reported no first-degree relatives with a history of alcoholism or problem drinking. None of the comparison subjects reported drinking more than three drinks a day on a regular basis.
On the basis of history, physical examination, blood chemistry, and a negative urinary drug screen, all subjects were judged to be medically healthy. On admission, 35 (44%) of the alcoholic patients had mild to moderate elevations of liver transaminases consistent with recent heavy alcohol consumption. Three weeks after admission, the transaminase values of all of the alcoholics had decreased, and only seven (9%) of the alcoholics had mildly elevated transaminase values. None of the alcoholic patients showed signs of hepatitis or cirrhosis or any neurological disorders associated with alcoholism. The nutritional status of the alcoholics was assessed by measuring the total protein, albumin, and transferrin in serum at admission. None of the subjects had a history of head injury requiring hospitalization. The alcoholic patients were scanned 3 weeks after admission or, in cases of patients who had been directly transferred from another hospital, at least 3 weeks after their last alcohol use.
Magnetic Resonance Imaging Scan Acquisition and Analysis
Subjects were scanned with 1.5-T MRI (GE Medical Systems, Milwaukee) that used a fast spoiled gradient/recall acquisition in the steady-state sequence. We used a gapless series of high-contrast, 2-mm thick, T1-weighted coronal images (repetition time=25 msec, inversion time=5 msec, and echo time=16 msec). The images were acquired with a 256 × 256 matrix and a 240 × 240-mm field of view. Each volumetric brain consisted of 124 coronal slices with voxel size of 0.9375 × 0.9375 × 2.0 mm.
The intracranial tissue was separated from the skull on coronal sections by using a hand-driven cursor. The intracranial volume included the cerebrum and CSF spaces covering the cortex but excluded the cerebellum and CSF of the posterior fossa. Intracranial volume was automatically segmented into CSF, gray matter, and white matter according to methods previously described and validated (13).
Statistical Analysis
Differences among groups were tested by using analysis of variance (ANOVA). Two analyses were performed. In the first analysis, differences in gray matter, white matter, sulcal CSF, and ventricular CSF volumes between alcoholics and nonalcoholic comparison subjects were tested in women and men separately. Since the intracranial volume differed significantly between men and women but not between alcoholics and nonalcoholics (Table 1), corrections for differences in intracranial volume were not needed for within-sex analyses.
In the second analysis, we combined data from both men and women by using a ratio approach. Ratios were created between the brain volume of interest and the remainder of the intracranial volume. For example, the ratio for sulcal CSF would be the volume of sulcal CSF divided by the intracranial volume minus the volume of sulcal CSF. This method of calculating ratios has been previously suggested as an appropriate treatment for compositional data (14, 15). Since the sum of CSF, gray matter, and white matter equals the intracranial volume, these volumes must be treated as compositional data. Pearson correlations were used to examine the relationships between age, measures of alcohol consumption, and brain volumes. Because of the number of statistical comparisons, the alpha level for significance was set at 0.01. All data are expressed as means and standard deviations. Brain volumes are reported in milliliters.
Results
Subject Characteristics
Subject groups did not differ in age. Men weighed more, were taller, and had larger intracranial volumes than women, but alcoholics and comparison subjects did not differ significantly on any of these measures (Table 1). However, there were two characteristics on which the alcoholics and nonalcoholics differed. Alcoholics had completed fewer years of education (Table 1), and more of the alcoholics smoked cigarettes: 51 (65%) of the alcoholics were smokers, compared with only four (10%) of the nonalcoholics (χ2=18.0, df=1, p<0.0001). Male and female alcoholics did not differ in the proportion of smokers in each group. Sixty-three (80%) of the alcoholics and 35 (90%) of the nonalcoholics were right-handed (χ2=1.6, df=1, n.s.).
On admission there were no significant differences in nutritional status between male and female alcoholics as measured by total serum protein (for men, mean=7.30 G/dl, SD=0.64, and for women, mean=7.31 G/dl, SD=0.54) (t=0.69, df=77, n.s.), albumin (for men, mean=4.33 G/dl, SD=0.46, and for women, mean=4.20 G/dl, SD=0.42) (t=–1.81, df=72, n.s.), and transferrin (for men, mean=267.8 mg/dl, SD=41.4, and for women, mean=289.2 mg/dl, SD=54.6) (t=1.73, df=77, n.s.). The mean time between hospital admission and MRI scan was 22.2 days (SD=7.8) for male alcoholics and 21.5 days (SD=6.1) for female alcoholics (t=0.48, df=77, n.s.). The alcoholic women reported significantly fewer years of heavy drinking (mean=8.5 years, SD=5.7) than the alcoholic men (mean=14.3 years, SD=7.5) (t=3.76, df=75, p<0.001), but they did not differ significantly in their estimates of total lifetime alcohol consumption (for men, mean=703 kg of ethanol, SD=602, and for women, mean=480 kg of ethanol, SD=516) (t=1.73, df=75, n.s.) or in their estimates of consumption during the 6 months preceding admission (for men, mean=24.1 kg of ethanol, SD=15.0, and for women, mean=24.2 kg of ethanol, SD=14.1) (t=–0.05, df=75, n.s.). Thirty-one (72%) of the alcoholic men and 28 (78%) of the alcoholic women had at least one first-degree relative with a history of alcoholism or problem drinking (χ2=0.36, df=1, n.s.). Thirty-three (77%) of the alcoholic men and 32 (89%) of the alcoholic women met criteria for an axis I disorder other than substance abuse disorders (χ2=0.91, df=1, n.s.). These were primarily mood or anxiety disorders.
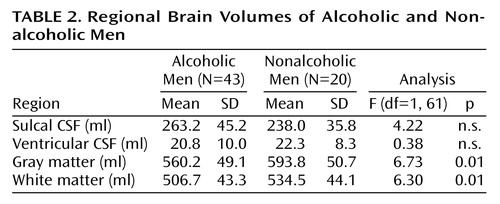
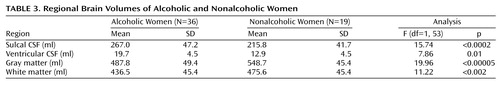
Brain Volumes Not Adjusted for Intracranial Volume
Although the alcoholic men had a greater mean volume of sulcal CSF and smaller mean volumes of gray and white matter than nonalcoholic men, only the differences in gray and white matter volumes achieved statistical significance (Table 2). Ventricular volumes were virtually identical in the two groups. In contrast, all of the mean brain and CSF volumes of the alcoholic women were significantly different from those of the nonalcoholic women (Table 3). The largest difference in brain volume between alcoholic and nonalcoholic women was in gray matter, which was 11% smaller among the alcoholic women (Table 3). Adjusting for years of education by using ANCOVA did not change any of these results. Alcoholics who were cigarette smokers did not demonstrate any significant differences in brain volumes from alcoholic nonsmokers. Similarly, alcoholics with and without a family history of alcoholism or a personal history of axis I psychiatric disorders other than substance abuse disorders did not differ significantly in any brain volumes. Brain volumes did not differ between right-handed and left-handed individuals.
Brain Ratios: Brain Volumes Adjusted for Intracranial Volume
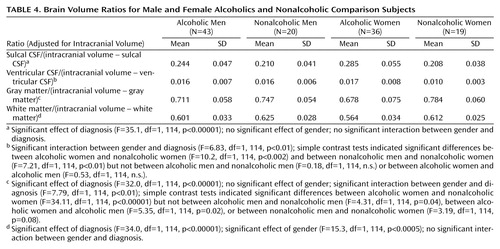
When we adjusted brain volumes for intracranial volume, it was possible to include all four groups in a single analysis. The results are shown in Table 4. All of the brain ratios, except for ventricular volume/(intracranial volume–ventricular volume), differed significantly between alcoholics and comparison subjects (ANOVA, main effect for diagnosis). The alcoholics had a larger proportion of their intracranial volume occupied by CSF than the comparison subjects and had a smaller proportion of intracranial gray and white matter than comparison subjects.
There was a significant interaction between diagnosis and gender in the analysis of gray matter ratio. Simple contrast tests within genders between alcoholics and nonalcoholics indicated that the difference between the groups was due to alcoholic women having a smaller proportion of gray matter than nonalcoholic women (Table 4). In contrast, alcoholic men had only a slightly smaller ratio of gray matter to remainder of intracranial volume than nonalcoholic men (Table 4).
There were no significant interactions between gender and diagnosis for CSF or white matter ratios. However, there was a significant interaction between diagnosis and gender in the analysis of ventricular ratios. Simple contrast tests indicated that this interaction was due to the alcoholic women having larger ventricular ratios than the nonalcoholic women (Table 4).
The only difference in the ratios between women and men, irrespective of diagnosis, was in the proportion of intracranial volume contents occupied by white matter (Table 4). Women had proportionally less white matter than men. Adjusting for years of education by ANCOVA did not change any of the results. Comparisons between alcoholics who were cigarette smokers and alcoholics who were not smokers revealed no significant differences in brain volume ratios; comparisons between alcoholics with or without a family history of alcoholism also revealed no significant differences. Alcoholics with or without other axis I disorders did not differ in brain volume ratios.
Brain Volumes, Age, Education, Family History, and Alcohol Consumption
Among the alcoholic patients, none of the measures of alcohol consumption (years of heavy drinking, lifetime alcohol consumption, and recent alcohol consumption) or number of first-degree relative reported to be alcoholic correlated significantly with any of the direct measures of brain volume or any of the brain volume ratios. Similarly, years of education did not significantly correlate with any direct or ratio measure of brain volume among either the alcoholics or nonalcoholic comparison subjects. In contrast, age did correlate significantly with many brain volume measures, particularly among the comparison subjects. The ratio measures were more highly correlated with age than were the brain volumes unadjusted for intracranial volume. Among the unadjusted volumes, only CSF among the healthy comparison subjects was significantly correlated with age (r=0.55, N=39, p<0.001).
Correlations between age and the ratios of gray matter (r=–0.64, N=39, p<0.001), white matter (r=–0.49, N=39, p<0.001), and CSF (r=0.66, N=39, p<0.001) were all significant among the healthy comparison subjects. Ventricular volume was not related to age among alcoholics or comparison subjects. Among the alcoholics, only gray matter ratio significantly correlated with age (r=–0.29, N=79, p<0.01). Figure 1 and Figure 2 show scatter plots of the relationships between age and the ratio of gray matter to the remainder of the intracranial volume among men and women, respectively. The slopes of the regression lines are very similar across the four groups, suggesting that, at least over the age range we examined, alcohol may not accelerate normal aging of the brain. However, given the limitations of analysis of cross-sectional data, this interpretation must be viewed with caution. It also appears that by early in their fourth decade of life, alcoholics, particularly alcoholic women, have considerably smaller brain volumes than nonalcoholics.
Discussion
Our results confirm earlier studies showing smaller gray and white matter brain volume among alcoholic men compared with nonalcoholic men (4, 5). In addition, we provide the first evidence, to our knowledge, that alcoholic women have smaller gray and white matter volumes and greater CSF volumes than healthy nonalcoholic women, and that the brain volume differences between alcoholic and nonalcoholic women, particularly in gray matter, are considerably larger than those found between alcoholic and nonalcoholic men. These differences occur despite the fact that the alcoholic women reported fewer years of heavy drinking than the alcoholic men. Our results are consistent with reports that women develop hepatic (2) and cardiac (3) complications of alcoholism earlier in the course of the disease than men do.
One interpretation of these results is that women are more sensitive to brain damage caused by alcoholism than men are. However, this is not the only possible interpretation. Other factors could be involved. It is possible that poor nutrition could lead to differences in brain volume. However, we found no evidence of nutritional differences between the alcoholic men and women. It is also possible that the duration of the interval between last drink and imaging could affect brain volumes. The gray matter volume of alcoholics increases during the first month of abstinence (16). However, in our study, the male and female alcoholic subjects had similar durations of abstinence, making it unlikely that recovery of cortical volume with abstinence could account for the gender differences we observed.
Diseases associated with alcoholism could reduce brain volume, but it is unlikely that this played a role in the differences we observed because medically and neurologically healthy alcoholics were studied. Although we excluded subjects with a history of head injury requiring hospitalization, it is possible that alcoholics experience more frequent minor head trauma not resulting in loss of consciousness or hospitalization than nonalcoholics. It is not known if minor head injuries that do not come to medical attention reduce brain volume or if alcoholic women are more likely to suffer from minor head injury than alcoholic men.
Although we can exclude or at least mitigate many factors other than alcohol consumption as possible causes for the differences in brain volumes we observed, we cannot exclude the possibility that alcoholics, particularly alcoholic women, have smaller brain volumes than nonalcoholics before the onset of alcoholism. Most investigators have assumed that the differences in brain volume between alcoholics and nonalcoholics are caused by the cumulative effects of alcohol neurotoxicity. However, there is little direct evidence for a cumulative dose effect of alcohol on brain volume. Most studies of alcoholics, including ours, have failed to show that lifetime alcohol consumption predicts brain volume (5, 17, 18). This failure may be due to an inherent inaccuracy in self-report of alcohol consumption.
Cross-sectional studies, like this study and earlier studies, are not ideal for detecting cumulative neurotoxic effects. Unfortunately, longitudinal studies of brain volume loss in alcoholism have been rare. In 1998, Pfefferbaum and co-workers (19) examined brain volume loss in 16 alcoholic men over a period of 5 years and found that the rate of gray matter volume loss was predicted by estimated alcohol consumption over the interval. This study suggests that there may be a dose-effect relationship between alcohol consumption and reduction in brain volume. However, the results of Pfefferbaum et al. need to be confirmed with larger study groups that include both men and women as well as younger alcoholics.
Given our uncertainty regarding the causes of smaller brains among alcoholics, it is prudent to consider explanations for both why alcoholic women might be more sensitive to alcohol-induced brain damage and why they might have smaller brains even before alcohol exposure. Women may develop organ damage earlier in the course of alcoholism than men because they achieve higher blood alcohol concentrations for a given dose of alcohol. Smaller body size, lower proportion of total body water (20), and lower concentrations of alcohol dehydrogenase in the lining of the gut (21) all lead to higher blood alcohol concentrations per standard alcohol-containing drink in women than in men. The alcoholic women in our study group reported fewer years of heavy drinking than the alcoholic men. However, their estimates of total lifetime alcohol consumption, although lower, were not significantly lower than the men’s estimates. Furthermore, alcoholic men and women reported drinking virtually identical amounts of alcohol during the 6 months preceding admission, suggesting that during this period the alcoholic women may have achieved higher blood alcohol concentrations on each day they drank than the men did.
Animal studies (22) suggest that alcohol may exert a toxic effect only after the blood alcohol concentration exceeds a certain threshold. Individual genetic, metabolic, dietary, and other biological factors may all influence this threshold. A threshold model would predict that, as a group, women would show greater alcohol-induced brain damage than men because women would be likely to exceed any blood alcohol concentration threshold more often than men. In addition to an individual blood alcohol concentration threshold for toxicity, gender, independent of its effects on blood alcohol concentration, must be considered as well. Even when blood alcohol concentration is controlled, female rats develop more severe alcohol-induced liver injury than male rats (23). Gender-based hormonal differences may affect the threshold for alcohol toxicity or act to modify the brain’s response to alcohol and its metabolites.
Although the evidence for alcohol neurotoxicity as the cause of gender differences in brain volume among alcoholics is not conclusive, it is stronger than the evidence for pre-alcoholism differences. No studies have examined the brain volumes of children at risk for alcoholism before they begin drinking, and no longitudinal imaging studies of individuals at risk for alcoholism have been conducted. Although there is no direct evidence of smaller brain volumes among individuals at risk for alcoholism, there is evidence that emotional trauma during childhood is associated with smaller intracranial volume and brain volume (24). Since alcoholic women report a higher rate of emotional trauma during childhood than alcoholic men (25), it is possible that this could contribute to differences in pre-alcoholism brain volume. However, we have found that the presence or absence of posttraumatic stress disorder does not influence hippocampal volume among alcoholic women (26). Further studies are needed to understand the effects of emotional trauma on the developing brain and the adult brain. Genetic influences also may affect pre-alcoholism brain volume.
Despite our inability to specify the causes of smaller brain volume among alcoholics, our results support two conclusions. First, alcoholic women have proportionally smaller brains after fewer years of heavy drinking than alcoholic men. Second, a smaller brain volume is present among alcoholic women by early in the fourth decade of life. Although the alcoholics in our study did not show clinically apparent cognitive dysfunction, more sensitive testing may have revealed impairment (27). The effects of significant brain volume reduction in early middle age on future cognitive ability are unknown. Likewise, the impact of brain volume reduction on the ability to maintain sobriety is also unknown.
 |
 |
 |
 |
Received Oct. 19, 1999; revision received Feb. 25, 2000; accepted March 24, 2000. From the Section on Electrophysiology and Brain Imaging, Laboratory of Clinical Studies, National Institute on Alcohol Abuse and Alcoholism, National Institutes of Health. Address reprint requests to Dr. Hommer, NIAAA, NIH, Rm. 3C103, 10 Center Dr., MSC 1256, Bethesda, MD 20892-1256; [email protected] (e-mail). Funded by the Division of Intramural Clinical and Biological Research, National Institute on Alcohol Abuse and Alcoholism. The authors thank Michael Kerich for computer system management and programming, Elizabeth Israel for database management, and Mary Dufour, M.D., for her comments on an earlier version of this article. They also thank the nursing and social work staff of the Alcohol Treatment Unit of the NIH Clinical Center.

Figure 1. Relationship Between Age and the Ratio of Gray Matter to the Remainder of the Intracranial Volume Among Male Alcoholics and Nonalcoholic Comparison Subjectsa
aValues for three alcoholic men cannot be seen because there were duplicate values for four alcoholic men.

Figure 2. Relationship Between Age and the Ratio of Gray Matter to the Remainder of the Intracranial Volume Among Female Alcoholics and Nonalcoholic Comparison Subjectsa
aThe value for one alcoholic woman cannot be seen because there were duplicate values for two alcoholic women.
1. Ashley MJ, Olin JS, le Riche WH, Kornaczewski A, Schmidt W, Rankin JG: Morbidity in alcoholics: evidence for accelerated development of physical disease in women. Arch Intern Med 1977; 137:883–887Crossref, Medline, Google Scholar
2. Loft S, Olesen KL, Dossing M: Increased susceptibility to liver disease in relation to alcohol consumption in women. Scand J Gastroenterol 1987; 22:1251–1256Google Scholar
3. Fernandez-Sola J, Estruch R, Nicolas JM, Pare JC, Sacanella E, Antunez E, Urbano-Marquez A: Comparison of alcoholic cardiomyopathy in women versus men. Am J Cardiol 1997; 80:481–485Crossref, Medline, Google Scholar
4. Jernigan TL, Butters N, DiTraglia G, Schafer K, Smith T, Irwin M, Grant I, Schuckit M, Cermak LS: Reduced cerebral grey matter observed in alcoholics using magnetic resonance imaging. Alcohol Clin Exp Res 1991; 15:418–427Crossref, Medline, Google Scholar
5. Pfefferbaum A, Lim KO, Zipursky RB, Mathalon DH, Rosenbloom MJ, Lane B, Ha CN, Sullivan EV: Brain gray and white matter volume loss accelerates with aging in chronic alcoholics: a quantitative MRI study. Alcohol Clin Exp Res 1992; 16:1078–1089Google Scholar
6. Jacobson R: Female alcoholics: a controlled CT brain scan and clinical study. Br J Addict 1986; 81:661–669Crossref, Medline, Google Scholar
7. Mann K, Batra A, Gunthner A, Schroth G: Do women develop alcoholic brain damage more readily than men? Alcohol Clin Exp Res 1992; 16:1052–1056Google Scholar
8. Kroft CL, Gescuk B, Woods BT, Mello NK, Weiss RD, Mendelson JH: Brain ventricular size in female alcoholics: an MRI study. Alcohol 1991; 8:31–34Crossref, Medline, Google Scholar
9. Pfefferbaum A, Sullivan EV, Rosenbloom MJ, Shear PK, Mathalon DH, Lim KO: Increase in brain cerebrospinal fluid volume is greater in older than in younger alcoholic patients: a replication study and CT/MRI comparison. Psychiatry Res 1993; 50:257–274Crossref, Medline, Google Scholar
10. Filipek PA, Richelme C, Kennedy DN, Caviness VS Jr: The young adult human brain: an MRI-based morphometric analysis. Cereb Cortex 1994; 4:344–360Crossref, Medline, Google Scholar
11. Spitzer RL, Williams JBW, Gibbon M, First MB: Structured Clinical Interview for DSM-III-R—Non-Patient Edition (SCID-NP, Version 1.0). Washington, DC, American Psychiatric Press, 1990Google Scholar
12. Eckardt MJ, Parker ES, Noble EP, Feldman DJ, Gottschalk LA: Relationship between neuropsychological performance and alcohol consumption in alcoholics. Biol Psychiatry 1978; 13:551–565Medline, Google Scholar
13. Momenan R, Hommer D, Rawlings R, Ruttiman R, Kerich M, Rio D: Intensity-adaptive segmentation of single-echo T1-weighted magnetic resonance images. Hum Brain Mapp 1997; 5:194–205Crossref, Medline, Google Scholar
14. McCrory SJ, Ford I: Multivariate analysis of SPECT images with illustrations in Alzheimer’s disease. Stat Med 1991; 10:1711–1718Google Scholar
15. Aitchison J: The Statistical Analysis of Compositional Data. New York, Chapman & Hall, 1983Google Scholar
16. Pfefferbaum A, Sullivan EV, Mathalon DH, Shear PK, Rosenbloom MJ, Lim KO: Longitudinal changes in magnetic resonance imaging brain volumes in abstinent and relapsed alcoholics. Alcohol Clin Exp Res 1995; 19:1177–1191Google Scholar
17. Ron MA: The alcoholic brain: CT scan and psychological findings. Psychol Med Monogr Suppl 1983; 3:1–33Crossref, Medline, Google Scholar
18. Sullivan EV, Marsh L, Mathalon DH, Lim KO, Pfefferbaum A: Anterior hippocampal volume deficits in nonamnesic, aging chronic alcoholics. Alcohol Clin Exp Res 1995; 19:110–122Crossref, Medline, Google Scholar
19. Pfefferbaum A, Sullivan EV, Rosenbloom MJ, Mathalon DH, Lim KO: A controlled study of cortical gray matter and ventricular changes in alcoholic men over a 5-year interval. Arch Gen Psychiatry 1998; 55:905–912Crossref, Medline, Google Scholar
20. Thomasson HR: Gender differences in alcohol metabolism: physiological responses to ethanol. Recent Dev Alcohol 1995; 12:163–179Medline, Google Scholar
21. Frezza M, di Padova C, Pozzato G, Terpin M, Baraona E, Lieber CS: High blood alcohol levels in women: the role of decreased gastric alcohol dehydrogenase activity and first-pass metabolism. N Engl J Med 1990; 322:95–99; corrections:322:1540, 323:553Google Scholar
22. Collins MA, Corso TD, Neafsey EJ: Neuronal degeneration in rat cerebrocortical and olfactory regions during subchronic “binge” intoxication with ethanol: possible explanation for olfactory deficits in alcoholics. Alcohol Clin Exp Res 1996; 20:284–292Crossref, Medline, Google Scholar
23. Iimuro Y, Frankenberg MV, Arteel GE, Bradford BU, Wall CA, Thurman RG: Female rats exhibit greater susceptibility to early alcohol-induced liver injury than males. Am J Physiol 1997; 272(5, part 1):G1186–G1194Google Scholar
24. De Bellis MD, Keshavan MS, Clark DB, Casey BJ, Giedd JN, Boring AM, Frustaci K, Ryan ND: AE Bennett Research Award: developmental traumatology, part II: brain development. Biol Psychiatry 1999; 45:1271–1284Google Scholar
25. Windle M, Windle RC, Scheidt DM, Miller GB: Physical and sexual abuse and associated mental disorders among alcoholic inpatients. Am J Psychiatry 1995; 152:1322–1328Google Scholar
26. Agartz I, Momenan R, Rawlings RR, Kerich MJ, Hommer DW: Hippocampal volume in patients with alcohol dependence. Arch Gen Psychiatry 1999; 56:356–363Crossref, Medline, Google Scholar
27. Nixon SJ, Glenn SW: Cognitive psychosocial performance and recovery in female alcoholics. Recent Dev Alcohol 1995; 12:287–307Medline, Google Scholar