Relative Risk of Attention Deficits in Siblings of Patients With Schizophrenia
Abstract
OBJECTIVE: Impaired attention has frequently been observed in studies of unaffected siblings of patients with schizophrenia. To assess the suitability of impaired attention for use as an intermediate phenotype in genetic studies, the authors estimated the relative risk of impaired attention in a large group of siblings. METHOD: The authors used the Continuous Performance Test, 1-9 version, with and without a distraction condition, to study 147 patients with schizophrenia, 193 of their siblings, and 47 normal comparison subjects. Relative risk (l) was estimated by using cutoff scores that were one, two, and three standard deviations below the mean sensitivity index value (d¢) of the normal comparison group in both Continuous Performance Test conditions. RESULTS: Patients but not their siblings performed worse than the normal comparison subjects in both conditions. Fifty percent of the patients, 24% of their siblings, and 18% of the normal comparison subjects scored one standard deviation below the mean score of the comparison group for the more difficult distraction version of the Continuous Performance Test. The patients with Continuous Performance Test scores one standard deviation below the mean score of the comparison group had a total of 97 siblings. Compared with the comparison group, this subgroup of siblings had significantly lower Continuous Performance Test scores. Relative risk was also significantly higher for the siblings of patients whose scores were one standard deviation (l=2.1) and two standard deviations (l=3.3) below the mean of comparison subjects. Attempts to assess ascertainment bias suggest that this may be an underestimate. CONCLUSIONS: Poor performance on the Continuous Performance Test appears to be familial and, possibly, genetic. Relative risk estimates were in the moderate range. Given the ease of administering the Continuous Performance Test, the use of impaired attention as an intermediate phenotype could increase the power of genetic studies of schizophrenia.
Numerous studies have provided strong evidence of a major genetic component to schizophrenia (1). Despite intensive efforts, linkage studies have generally yielded only weak evidence for minor susceptibility loci (e.g., references 2–5). Positional cloning of such minor genes is, at present, difficult and will require very large numbers of affected sibling pairs (6). Because many genes may be involved in schizophrenia, the role that any single locus may play in affecting the most disabling features of the illness could be relatively unimportant.
An alternative approach is to use neurobiological traits associated with schizophrenia as phenotypes (7–9). The underlying assumption of this approach is that different susceptibility loci produce distinct, measurable neurobiological phenotypes that may each increase the risk for developing schizophrenia. An analogy would be heart disease, where obesity, hyperlipidemia, and smoking are separate traits, each with its own genetics and each of which increases the risk of heart disease. This approach offers several advantages for genetic studies of schizophrenia. First, it may be possible to identify subgroups that are genetically more homogeneous. Second, intermediate neurobiological phenotypes may have a simpler genetic architecture. Third, traits such as cognitive impairment may be more directly associated with the most incapacitating features of the illness (10–12). Using different aspects of cognitive dysfunction as phenotypes may facilitate the identification of susceptibility loci directly relevant to the severe functional impairment found in schizophrenia.
Cognitive function has been studied in patients with schizophrenia and their relatives. These studies suggest that cognitive dysfunction in general and poor attention in particular are familial and could be genetically related to the risk of schizophrenia (7, 13, 14). Measures of attention appear to be stable over time, are not worsened by neuroleptic medications, and are relatively independent of clinical state (13, 15–17). Prospective studies suggest that impaired attention is present from early childhood, before diagnostic symptoms appear, and persists for decades (13). Heritability estimates, however, have been lacking, making it difficult to know whether this phenotype is useful for genetic studies. To our knowledge, only one study of impaired attention—by Chen et al. (18), who studied a Taiwanese cohort—has examined this issue. Chen et al. reported relative risk estimates ranging from 9.6 to 130.3 for a combined group of parents and siblings of patients with schizophrenia.
Relative risk is a measure used in genetics and epidemiology to quantify, among other things, familial similarity. It can be used to estimate upper limits of heritability by using the James identity (19). Relative risk has also been used to estimate the feasibility and design of genetic studies for locating genes (20–22). The very high relative risk for impaired attention found by Chen et al. in the Taiwanese cohort suggests that this phenotype is highly heritable and a compelling candidate for genetic studies. Indeed, if the estimates of Chen et al. are accurate, it may be easier to find genes for impaired attention than for schizophrenia, for which the relative risk is 10.
Relative risk estimates are sensitive to ascertainment bias and require large numbers of subjects (23). Replication in a large, independent cohort, preferably with subjects of different ethnicity and including one type of first-degree relative (e.g., siblings alone) is critical for evaluating the utility of this phenotype. Different ethnic groups may have different genetic and environmental components of phenotypic variance for cognitive abilities (e.g., see references 24 and 25). In addition to ethnicity, the type of relative evaluated can have important effects on estimates of relative risk and heritability (23, 26, 27). Correlations with parents and siblings can be affected by different environmental, genetic, and gene-environment interactions. For this reason, genetic studies normally distinguish these relative types (e.g., see references 23, 26, and 28).
We investigated attention deficits in a relatively large group of siblings of patients with schizophrenia to estimate relative risk. We tested the following hypotheses: 1) siblings of patients with schizophrenia have impaired Continuous Performance Test performance, 2) siblings of patients with schizophrenia who have impaired Continuous Performance Test performance also have a higher rate of impaired Continuous Performance Test performance, and 3) relative risk for poor Continuous Performance Test performance is moderate or higher in siblings of patients with schizophrenia. Furthermore, we attempted to evaluate ascertainment bias. On the basis of pilot data, we hypothesized that healthier siblings would participate, biasing relative risk estimates downward.
Method
One hundred forty-seven index patients with a history of schizophrenia, 193 of their full siblings, and 47 normal comparison subjects who had no first-degree relatives with schizophrenia participated in a family study of neurobiological phenotypes associated with schizophrenia. Subjects were recruited from local and national sources.
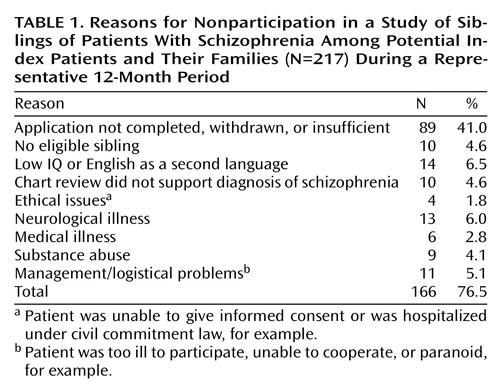
Preliminary diagnoses of the index patients were established by a research social worker through review of psychiatric records and interview with family members. Applicants with alcohol or drug abuse within the last 6 months, alcohol or drug dependence within the last year, or more than a 5-year history of alcohol or drug abuse or dependence were not recruited. The 147 patients represented a fraction of the potential index patients and/or their families who initially inquired about the project. Reasons for nonparticipation of the potential index families for a representative 12-month period are listed in Table 1. During this period, 23.5% of inquiring families were eventually studied.
All study procedures were approved by the Institutional Review Board of the National Institute of Mental Health. Participants had to be from 18 to 60 years of age, above 70 in premorbid IQ, and able to give informed consent.
Comparison subjects were recruited through the NIH Normal Volunteer Office and screened according to the same criteria with the additional requirement that they not have a first-degree relative with schizophrenia. Written informed consent was obtained from all study participants after complete description of the study.
Participants were interviewed and videotaped by a research psychiatrist (blind to comparison group or sibling status) using the Structured Clinical Interview for DSM-IV Axis I Disorders Research Version (SCID-I) (29) (patient or nonpatient version as indicated) and the Structured Clinical Interview for DSM-IV Axis II Disorders (SCID-II) (30). All available psychiatric records were reviewed. A second psychiatrist reviewed all SCID and family data; disagreements in diagnosis were reviewed by a third psychiatrist who was the tie breaker. Interrater reliability was assessed in independent interviews with 14 to 17 probands. In all cases, raters agreed on the diagnosis of schizophrenia or schizoaffective disorder. All subjects received a neurological examination, EEG, magnetic resonance imaging scan of the brain, and a screening battery of blood tests. Two subjects were excluded due to central nervous system pathology.
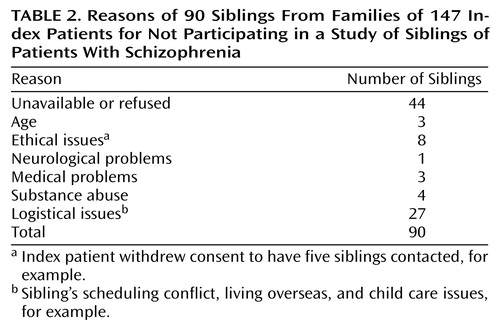
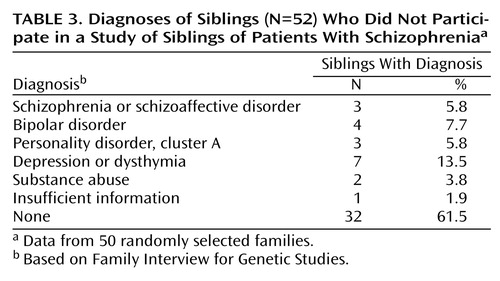
Families of the 147 index patients had a total of 283 siblings; 193 of these siblings were examined. Reasons of the 90 siblings for not participating are described in Table 2. To assess ascertainment bias, we evaluated the psychiatric diagnosis of nonparticipating siblings using two informants (a parent and a well sibling) and the Family Interview for Genetic Studies (31). Of 50 randomly selected families, 28 had 52 untested siblings; 22 families had 100% participation. Psychiatric diagnoses based on the Family Interview for Genetic Studies for the 52 nonparticipating siblings are listed in Table 3.
Data from a number of participants were excluded. For 19 families, complete data on both the index patient and one of the patient’s siblings were not available because of problems with testing or logistics. Twelve index patients were excluded for failing to meet diagnostic criteria. Of 147 index patients and 193 siblings, data for 116 patients and 183 siblings were analyzed. Two comparison subjects were excluded for substance abuse and family history of psychosis not otherwise specified in a sibling. The final study group included 183 sibling pairs.
We used the Continuous Performance Test from Gordon Diagnostic Systems (32). The procedure has been described in detail elsewhere (17). Briefly, patients were tested on two versions, the 1-9 task without distractors (vigilance version) and the 1-9 task with distractor numbers flashing adjacent to the target numbers (distraction version). Subjects were required to press a button every time a number 1 was followed by number 9 in sequence. Stimuli were presented every second, with a stimulus duration of 200 msec and an interstimulus interval of 800 msec. Each task lasted 6 minutes; 360 trials were presented with 30 targets. Three parameters were examined: commission errors, omission errors, and overall number correct. IQ (from the WAIS-R) and reading comprehension (Wide Range Achievement Test, Revised [WRAT-R] [33]) were also determined. The sensitivity index (d¢) was derived from the hit rate and false alarm rate (16). Response bias (beta) was calculated by using the ratio of the hit rate to the false alarm rate (16). The log of beta was analyzed to derive a linear distribution.
Data analysis was performed with Statistica (Statsoft Corp, Tulsa, Okla.). Demographic data were compared by using t tests (paired or unpaired as appropriate) and chi-square tests for nonparametric data. Correlations were assessed with Pearson’s correlation coefficient. Because no age or sex effects were seen in this group, uncorrected dependent measures were used in all analyses. Four dependent variables (d¢ and log beta for vigilance and distractibility conditions) were compared with t tests. Because data for related family members may be correlated, we conservatively chose to use only one randomly selected sibling from each family for these analyses. Analysis of variance with all three groups was not used because of possible violation of the assumption of independence between groups.
Several criteria were used to calculate relative risk. Subjects were designated as affected if their Continuous Performance Test scores fell below specific cutoff values. These values were defined as one, two, and three standard deviations below the mean score of the subjects in the normal comparison group. The number of affected siblings of index patients who were themselves affected with impaired attention was determined; these were concordant pairs for impaired attention. Unaffected siblings of index patients who were affected with impaired attention were defined as nonconcordant pairs.
Relative risk was calculated as (concordant pairs/[concordant + nonconcordant pairs])/percent affected in the comparison group. Chi-square was used to test for significance of relative risk values by comparing distributions of affected status in siblings compared with the subjects in the normal comparison group. All siblings were included in this analysis to test the null hypothesis of no correlation between family members (34).
An alternative method to estimating relative risk based on logistic regression (35) was not used because such methods are either 1) asymptotic and assume large numbers or 2) require matching families to comparison subjects. This latter approach would require omitting families and would markedly reduce power.
Results
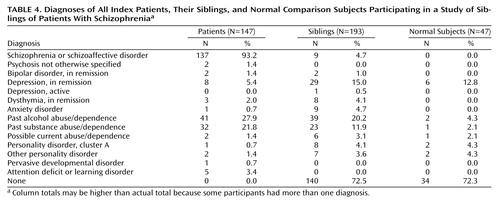
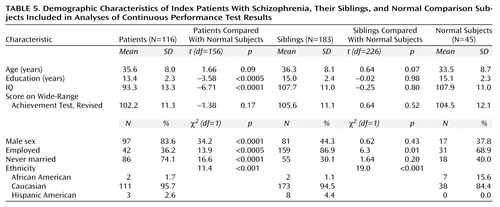
Diagnoses and demographic data of the participating index patients, their siblings, and the normal comparison subjects are shown in Table 4 and Table 5. Briefly, the comparison subjects were slightly younger than patients and siblings, but the difference was not significant. No correlation was found between age and Continuous Performance Test variables in any group or overall. There were more men in the patient group than in either the sibling or the comparison group. No differences between sexes were observed in any group for any Continuous Performance Test measure. There was no difference between siblings and the normal comparison subjects in IQ, WRAT-R score, sex, age, or education. There were significantly more African Americans in the comparison group than in the group of siblings and the group of patients. Within the comparison group, there was no significant effect of race on any Continuous Performance Test measure, suggesting that this should not affect relative risk estimates. Rates of depression were comparable between the sibling and normal groups (χ2=0.23, df=1, p=0.63) (Table 4) and are similar to lifetime prevalence data in large community samples (36). The group of siblings had a higher rate of past alcohol abuse and dependence than the normal comparison group (χ2=5.0, df=1, p=0.03) (Table 4). When we used a diagnosis of past alcohol abuse or dependence as a grouping factor, however, we noted no differences for any attention variable for the entire study group.
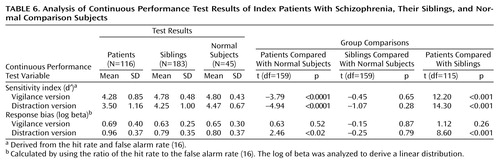
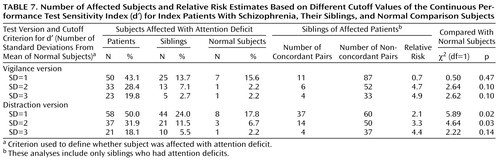
Continuous Performance Test results are given in Table 6. Briefly, index patients were significantly worse than siblings and normal subjects for the sensitivity index in both test conditions. No differences were seen between the group of siblings and the normal subjects on any measure. The number and percentage of patients, siblings, and normal subjects affected with attention deficits on the basis of different Continuous Performance Test cutoff criteria as well as the number of concordant and nonconcordant sibling pairs and the relative risk estimates are given in Table 7. Significant differences were seen only for the distraction version sensitivity index when one and two standard deviations below the mean were used as the cutoff. Because more sibling pairs met criteria for the former, subsequent analysis will focus on this group.
Fifty percent of the index patients were considered affected with attention deficits because they had scores that were one standard deviation below the comparison group mean on the distraction version sensitivity index. These 55 affected patients had 97 siblings. The scores of these 97 siblings were significantly lower than those of the comparison group (t=–2.18, df=98, p=0.03), and 37 of these 97 siblings had scores that were one standard deviation below the comparison group mean, giving a relative risk of 2.1 (Table 7). Relative risks based on other cutoff criteria and data for the vigilance version are also presented in Table 7.
The patients who were not affected with attention deficits had 86 siblings whose mean sensitivity index (d¢) was 4.53, not significantly different than the comparison group mean. In these families, only eight (9.3%) of the siblings had scores that were one standard deviation below the comparison group mean.
The 37 siblings with poor Continuous Performance Test performance showed few differences on other measures compared with other siblings and the comparison group. Their mean age was 36.2; 13 were men and 24 were women. Their mean IQ was 104, and their WRAT-R mean was 102. Twenty-two had no psychiatric diagnosis, six had schizophrenia or schizoaffective disorder, and six had depression or dysthymia (in remission). Eight (21.6%) had a previous history of drug or alcohol abuse, compared with 11 (18.3%) of nonconcordant siblings.
When we excluded the siblings with schizophrenia or schizoaffective disorder, we found that the remaining 31 siblings (concordant/well) with poor Continuous Performance Test performance were not significantly different from the normal subjects or other siblings in the same family (i.e., nonconcordant siblings) demographically or on other measures. These 31 concordant/well siblings had 13.2 years of education, which was not significantly different from the 14.8 years for both the normal comparison subjects and other nonconcordant siblings in these same families. The 31 siblings had an employment rate of 79%, similar to 89% for nonconcordant siblings and 69% for the comparison subjects. Global Assessment of Functioning Scale scores (axis V, DSM-IV) were similar between groups as well (concordant/well=83.6, nonconcordant=82.9, comparison subjects=87.3).
We attempted to evaluate ascertainment bias for siblings indirectly using several approaches. Of initial inquiries, the majority of families were not tested (Table 1). Of families that participated, more than 30% of siblings did not. Psychiatric diagnoses of those who did not participate are given in Table 3. When schizophrenia, bipolar disorder, and cluster A personality disorders are combined, nonparticipating siblings had a 19.2% prevalence, compared with 9.8% for participating siblings (χ2=3.46, df=1, p=0.06).
Discussion
To our knowledge, this is the first study to report the relative risk of impaired attention in a large cohort of siblings of patients with schizophrenia. The main finding is that the prevalence of impaired attention is greater in siblings of patients who themselves have impaired attention, with relative risk estimates in the moderate range. Attention deficits were more prominent in the more difficult, distraction version of the Continuous Performance Test. The rate of poor Continuous Performance Test performance in siblings was increased when cutoff scores of both one and two standard deviations below the comparison group mean were used to define who had attention deficits. Although no differences were found between the entire group of siblings and the normal comparison group, the subgroup of siblings of patients with poor Continuous Performance Test performance did have lower scores on the distraction version than the comparison group.
Most siblings with attention deficits did not have a psychiatric disorder and were similar to the comparison group and siblings with normal attention on a variety of nonattentional measures, such as IQ, the WRAT-R, and years of education. This suggests that poor attention is not simply an epiphenomenon of psychiatric disorder or lower general cognitive ability and does not invariably produce such disorders.
Regarding ascertainment bias, several indirect measures (IQ and psychiatric diagnosis) suggest that the total group of tested siblings may be above average. This could potentially bias relative risk estimates downward. The higher rate of poor attention suggests that this phenotype could be useful in the attempt to find susceptibility loci associated with schizophrenia.
The relative risk estimates in this study are substantially lower than those found by Chen et al. (18), which ranged from 9.6 to 130.3. There are several possible reasons for this difference, such as the use of slightly different versions of the Continuous Performance Test or different ascertainment strategies for comparison subjects. A more likely explanation, however, is the different ascertainment strategy for probands and relatives. Chen et al. studied patients recently admitted to acute inpatient wards. Continuous Performance Test performance in these patients was markedly worse than the performance of the patients in the current study. Hospitalized patients may be a sicker group and come from families with greater attention deficits than the families of outpatients participating in our study; thus, each ascertainment strategy could bias relative risk in the opposite direction.
A second difference involves the first-degree relatives who were studied. The current study used only siblings who were very close in age and premorbid IQ (i.e., WRAT-R scores) to index patients; Chen et al. used both siblings and parents. The use of parents may have confounded their results by means of significant age or cohort effects, despite attempts to correct for this. Furthermore, it is unclear how much siblings contributed to the higher relative risk. Their entire cohort of first-degree relatives also had a much lower education level than our subjects, again possibly biasing their results in favor of families with impaired attention. It is unclear whether these or other factors, such as ethnic or cultural differences, could account for such markedly worse performance by their families.
The findings of previous studies of attention in siblings of patients with schizophrenia have been mixed. The largest such study, that of Chen et al. (18), found significant group differences, as have several others (17, 37); on the other hand, many (13, 16) have found differences only with more difficult versions of the Continuous Performance Test. Most previous studies have tested small numbers of siblings and have not distinguished between siblings of patients with and without poor Continuous Performance Test performance. Furthermore, with the exception of the study of Chen et al., most previous studies have used markedly biased ascertainment strategies that resulted in either high rates of schizophrenia spectrum disorders in the sibling group (14, 17, 37, 38) or low rates in the comparison group, who are typically selected for having no psychiatric disorder (14, 39). The former overestimates impaired attention in the sibling group, while the latter underestimates it in the comparison group.
Another factor is the type of Continuous Performance Test employed. Although the 1-9 version is commonly used, it is somewhat easier than others, such as the identical pairs version (13, 40). One disadvantage of the 1-9 version is that performance scores are not distributed normally because there is a ceiling effect. This could make finding group differences more difficult and reduce relative risk calculations. Differences between siblings and the comparison group appear to be more robust with more difficult versions. On the other hand, these other versions include substantial visual perceptual or working memory loads (13, 16). The correlation between attention and working memory deficits, for example, is weak; a greater percentage of siblings score poorly when impairments in both domains are included (11). Thus, to the degree that attention and working memory are physiological independent measures that can be deconstructed, the 1-9 version of the Continuous Performance Test could have some advantages over the identical pairs version and other versions.
Despite the higher relative risk, we did not find differences between the sibling group as a whole and the comparison group. Differences from the normal subjects were found only in the subgroup of siblings of patients who themselves had poor Continuous Performance Test performance. There are several possibilities consistent with these data. First, our study group may have consisted of a relatively small number of families with impaired attention. Finding differences between all siblings and the comparison group depends in part on the mix of families ascertained. If siblings from families with normal attention make up a relatively high proportion, the overall means for siblings may not be different in spite of substantial heritability of impaired attention and in spite of the overrepresentation of impaired attention in the patient group as a whole. To use an analogy, obesity is known to have a substantial genetic component and to be a risk factor for heart disease, but whether a specific group of siblings of patients with heart disease are obese depends on the mix of families studied.
Alternatively, the data are also consistent with the conclusion that impaired attention is familial but unrelated to greater liability for schizophrenia. In this case, familial/genetic factors that lead to impaired attention would not increase the risk of developing schizophrenia but would modify its clinical and cognitive manifestations.
We attempted to estimate ascertainment bias using several indirect measures, including IQ and diagnosis. Siblings had above-average IQ (107.7). Although Continuous Performance Test performance is weakly correlated with IQ (r=0.22 to r=0.25, p<0.001, in the current study), siblings and the comparison group were well matched for IQ, which should control for this. Regarding diagnosis, siblings who participated in the study had a lower rate of schizophrenia spectrum disorders by roughly 50% (Table 4) than has been reported in other studies with systematic ascertainment (41, 42). Furthermore, siblings who did not participate may have had a slightly higher rate of severe psychiatric disorders than those who did, suggesting a bias toward healthier siblings (Table 3). Continuous Performance Test performance has been shown in many studies to be correlated with some aspects of psychopathology (14, 43–47).
Finally, the majority of families who inquired about the study did not participate (Table 1). The most common reason for this was not our exclusionary criteria but, presumably, personal reasons such as lack of interest, feelings about research, motivation, or other factors. Overall, the data indicate that ascertainment was skewed toward healthier families and siblings, potentially biasing relative risk estimates downward. Thus, the true relative risk may be higher than our estimates.
Could Continuous Performance Test performance be a useful phenotype for finding susceptibility loci underlying schizophrenia? Estimates of relative risk from this study suggest that it may be. Although relative risk is only moderate, and the genetic architecture is uncertain, a clear advantage is that it distinguishes a subgroup of patients and families. Impaired attention is not redundant with diagnosis and provides additional information regarding an important phenotype linked to psychosocial disability in schizophrenia (10, 11). Impaired attention may thus be one of many possible intermediate phenotypes, similar to sensory gating and eye tracking dysfunction, that could be closer to the molecular effects of susceptibility loci and, as a result, could assist with the genetic dissection of schizophrenia.
Several methods could be used to find susceptibility loci underlying impaired attention and other intermediate phenotypes that increase the risk for schizophrenia. For example, with an affected sibling pair approach and the assumption of a single locus mode (a best-case scenario), only 200 to 300 sibling pairs with poor attention would be required for 80% power (48). If only 20% of all sibling pairs tested are concordant for poor attention, up to 1,500 sibling pairs would need to be tested with the Continuous Performance Test. Sibling pairs in this analysis would include at least one sibling with schizophrenia; the second sibling would not be selected on the basis of diagnosis.
A second approach using Continuous Performance Test scores as a quantitative trait would likely require testing a similar or somewhat larger number of sibling pairs (20, 49). Alternatively, extremely discordant siblings could offer even higher power in a quantitative trait loci analysis (20). The number of subjects needed to find susceptibility loci for impaired attention may not be large compared with the number needed for studies using schizophrenia as phenotype, given the probable phenotypic and genetic heterogeneity. It is important to note, however, that it is difficult to estimate how much power is affected because the genetic architecture of both phenotypes is unknown. The impaired attention associated with schizophrenia could also be genetically complex.
In conclusion, patients with schizophrenia have marked impairments on tests of attention. Impaired attention appears to be a familial trait with moderate relative risk. Given the relative ease of administering the Continuous Performance Test, the use of impaired attention as an intermediate neurobiological phenotype may improve the power of genetic studies for finding genes that increase the risk for or modify the expression of schizophrenia.
 |
 |
 |
 |
 |
 |
 |
Presented at the meeting of the Society for Biological Psychiatry, Washington, D.C., May 13–16, 1999.Received Aug. 6, 1999; revisions received Jan. 7 and Feb. 25, 2000; accepted March 1, 2000.From the NIMH Neuroscience Research Center at St. Elizabeths Hospital, Washington, D.C.; and the National Institutes of Health. Address reprint requests to Dr. Egan, Clinical Brain Disorders Branch, Intramural Research Program, NIMH, National Institutes of Health, Bldg. 10, Center Drive, Rm. 4S-241, MSC1377, Bethesda, MD 20814-9692; [email protected] (e-mail).Supported by NIMH and the Stanley Foundation.The authors thank Michael Wechsler, Tom Raedler, M.D., and Tom Weickert, Ph.D., for their assistance as well as the patients and their families whose participation made this project possible.
1. Gottesman II: Schizophrenia Genesis: Origins of Madness. San Francisco, WH Freeman, 1991Google Scholar
2. Kendler KS, MacLean CJ, O’Neill FA, Burke J, Murphy B, Duke F, Shinkwin R, Easter SM, Webb BT, Zhang J, Walsh D, Straub RE: Evidence for a schizophrenia vulnerability locus on chromosome 8p in the Irish Study of High-Density Schizophrenia Families. Am J Psychiatry 1996; 153:1534–1540Google Scholar
3. Pulver AE, Lasseter VK, Kasch L, Wolyniec P, Nestadt G, Blouin JL, Kimberland M, Babb R, Vourlis S, Chen H: Schizophrenia: a genome scan targets chromosomes 3p and 8p as potential sites of susceptibility genes. Am J Med Genet 1995; 60:252–260Crossref, Medline, Google Scholar
4. Straub RE, MacLean CJ, O’Neill FA, Burke J, Murphy B, Duke F, Shinkwin R, Webb BT, Zhang J, Walsh D, Kendler KS: A potential vulnerability locus for schizophrenia on chromosome 6p24-22: evidence for genetic heterogeneity. Nat Genet 1995; 11:287–293Crossref, Medline, Google Scholar
5. Blouin JL, Dombroski BA, Nath SK, Lasseter VK, Wolyniec PS, Nestadt G, Thornquist M, Ullrich G, McGrath J, Kasch L, Lamacz M, Thomas MG, Gehrig C, Radhakrishna U, Snyder SE, Balk KG, Neufeld K, Swartz KL, DeMarchi N, Papadimitriou GN, Dikeos DG, Stefanis CN, Chakravarti A, Childs B, Pulver AE: Schizophrenia susceptibility loci on chromosomes 13q32 and 8p21. Nat Genet 1998; 20:70–73Crossref, Medline, Google Scholar
6. Kruglyak L, Lander ES: High-resolution genetic mapping of complex traits. Am J Hum Genet 1995; 56:1212–1223; correction, 1996; 58:902Google Scholar
7. Kremen WS, Seidman LJ, Pepple JR, Lyons MJ, Tsuang MT, Faraone SV: Neuropsychological risk indicators for schizophrenia: a review of family studies. Schizophr Bull 1994; 20:103–119Crossref, Medline, Google Scholar
8. Tsuang MT: Genotypes, phenotypes, and the brain: a search for connections in schizophrenia. Br J Psychiatry 1993; 163:299–307Crossref, Medline, Google Scholar
9. Freedman R, Coon H, Myles-Worsley M, Orr-Urtreger A, Olincy A, Davis A, Polymeropoulos M, Holik J, Hopkins J, Hoff M, Rosenthal J, Waldo MC, Reimherr F, Wender P, Yaw J, Young DA, Breese CR, Adams C, Patterson D, Adler LE, Kruglyak L, Leonard S, Byerley W: Linkage of a neurophysiological deficit in schizophrenia to a chromosome 15 locus. Proc Natl Acad Sci USA 1997; 94:587–592Crossref, Medline, Google Scholar
10. Green MF: What are the functional consequences of neurocognitive deficits in schizophrenia? Am J Psychiatry 1996; 15:321–330Google Scholar
11. Goldberg TE, Ragland JD, Torrey EF, Gold JM, Bigelow LB, Weinberger DR: Neuropsychological assessment of monozygotic twins discordant for schizophrenia. Arch Gen Psychiatry 1990; 47:1066–1072Google Scholar
12. Breier A, Schreiber JL, Dyer J, Pickar D: National Institute of Mental Health longitudinal study of chronic schizophrenia: prognosis and predictors of outcome. Arch Gen Psychiatry 1991; 48:239–246; correction, 48:642Crossref, Medline, Google Scholar
13. Cornblatt BA, Keilp JG: Impaired attention, genetics, and the pathophysiology of schizophrenia. Schizophr Bull 1994; 20:31–46; correction, 20:248Crossref, Medline, Google Scholar
14. Keefe RS, Silverman JM, Mohs RC, Siever LJ, Harvey PD, Friedman L, Roitman SE, DuPre RL, Smith CJ, Schmeidler J, Davis KL: Eye tracking, attention, and schizotypal symptoms in nonpsychotic relatives of patients with schizophrenia. Arch Gen Psychiatry 1997; 54:169–176Crossref, Medline, Google Scholar
15. Faraone SV, Seidman LJ, Kremen WS, Toomey R, Pepple JR, Tsuang MT: Neuropsychological functioning among the nonpsychotic relatives of schizophrenic patients: a 4-year follow-up study. J Abnorm Psychol 1999; 108:176–181Crossref, Medline, Google Scholar
16. Nuechterlein KH: Vigilance in schizophrenia and related disorders, in Neuropsychology, Psychophysiology and Information Processing, vol 5. Edited by Steinhauer SR, Gruzelier JH, Zubin J. New York, Elsevier, 1991, pp 397–433Google Scholar
17. Finkelstein JR, Cannon TD, Gur RE, Gur RC, Moberg P: Attentional dysfunctions in neuroleptic-naive and neuroleptic-withdrawn schizophrenic patients and their siblings. J Abnorm Psychol 1997; 106:203–212Crossref, Medline, Google Scholar
18. Chen WJ, Liu SK, Chang C-J, Lien Y-J, Chang Y-H, Hwu H-G: Sustained attention deficit and schizotypal personality features in nonpsychotic relatives of schizophrenic patients. Am J Psychiatry 1998; 155:1214–1220Google Scholar
19. James JW: Frequency in relatives for an all-or-none trait. Ann Hum Genet 1971; 35:47–49Crossref, Medline, Google Scholar
20. Risch N, Zhang H: Extreme discordant sib pairs for mapping quantitative trait loci in humans. Science 1995; 268:1584–1589Google Scholar
21. Risch N, Merikangas K: The future of genetic studies of complex human diseases. Science 1996; 273:1516–1517Google Scholar
22. Risch N: Linkage strategies for genetically complex traits, I: multilocus models. Am J Hum Genet 1990; 46:222–228Medline, Google Scholar
23. Khoury MJ, Beaty TH, Cohen BH: Fundamentals of Genetic Epidemiology. New York, Oxford University Press, 1993Google Scholar
24. DeFries JC, Ashton GC, Johnson RC, Kuse AR, McClearn GE, Mi MP, Rashad MN, Vandenberg SC, Wilson JR: Parent-offspring resemblance for specific cognitive abilities in two ethnic groups. Nature 1976; 261:131–133Crossref, Medline, Google Scholar
25. DeFries JC, Johnson RC, Kuse AR, McClearn GE, Polovina J, Vandenberg SG, Wilson JR: Familial resemblance for specific cognitive abilities. Behav Genet 1979; 9:23–43Medline, Google Scholar
26. Plomin R, DeFries JC, McClearn GE: Behavioral Genetics. New York, WH Freeman, 1990Google Scholar
27. DeFries JC, Corley RP, Johnson RC, Vandenberg SC, Wilson JR: Sex-by-generation and ethnic group-by-generation interactions in the Hawaii Family Study of Cognition. Behav Genet 1982; 15:467–473Crossref, Google Scholar
28. Falconer DS, Mackay TFC: Introduction to Quantitative Genetics. Essex, England, Longman, 1996Google Scholar
29. First MB, Spitzer RL, Gibbon M, Williams JBW: Structured Clinical Interview for DSM-IV Axis I Disorders Research Version (SCID-I). New York, New York State Psychiatric Institute, Biometrics Research, 1996Google Scholar
30. First MB, Gibbon M, Spitzer RL, Williams JB: Structured Clinical Interview for DSM-IV Axis II Disorders (SCID-II), version 2. New York, New York Psychiatric Institute, Biometrics Research, 1996Google Scholar
31. Gershon ES, Guroff JJ: Information from relatives: diagnosis of affective disorders. Arch Gen Psychiatry 1984; 41:173–180Crossref, Medline, Google Scholar
32. Gordon Diagnostic System. DeWitt, NY, Gordon Diagnostic Systems, 1986Google Scholar
33. Jastak S, Wilkinson GS: The Wide Range Achievement Test, Revised. Wilmington, Del, Jastak Associates, 1984Google Scholar
34. Hunt SC, Hasstedt SJ, Williams RR: Testing for familial aggregation of a dichotomous trait. Genet Epidemiol 1986; 3:299–312Crossref, Medline, Google Scholar
35. Liang KY: Extended Mantel-Haenszel estimating procedure for multivariate logistic regression models. Biometrics 1987; 43:289–299Crossref, Medline, Google Scholar
36. Blazer DG, Kessler RC, McGonagle KA, Swartz MS: The prevalence and distribution of major depression in a national community sample: the National Comorbidity Survey. Am J Psychiatry 1994; 151:979–986Link, Google Scholar
37. Cannon TD, Zorrilla LE, Shtasel D, Gur RE, Gur RC, Marco EJ, Moberg P, Price RA: Neuropsychological functioning in siblings discordant for schizophrenia and healthy volunteers. Arch Gen Psychiatry 1994; 51:651–661Crossref, Medline, Google Scholar
38. Keefe RS, Silverman JM, Roitman SE, Harvey PD, Duncan MA, Alroy D, Siever LJ, Davis KL, Mohs RC: Performance of nonpsychotic relatives of schizophrenic patients on cognitive tests. Psychiatry Res 1994; 53:1–12Crossref, Medline, Google Scholar
39. Grove WM, Lebow BS, Clementz BA, Cerri A, Medus C, Iacono WG: Familial prevalence and coaggregation of schizotypy indicators: a multitrait family study. J Abnorm Psychol 1991; 100:115–121Crossref, Medline, Google Scholar
40. Cornblatt BA, Risch NJ, Faris G, Friedman D, Erlenmeyer-Kimling L: The Continuous Performance Test, Identical Pairs Version (CPT-IP), I: new findings about sustained attention in normal families. Psychiatry Res 1988; 26:223–238Crossref, Medline, Google Scholar
41. Kendler KS, McGuire M, Gruenberg AM, O’Hare A, Spellman M, Walsh D: The Roscommon Family Study, I: methods, diagnosis of probands, and risk of schizophrenia in relatives. Arch Gen Psychiatry 1993; 50:527–540Crossref, Medline, Google Scholar
42. Kendler KS, McGuire M, Gruenberg AM, O’Hare A, Spellman M, Walsh D: The Roscommon Family Study, III: schizophrenia-related personality disorders in relatives. Arch Gen Psychiatry 1993; 50:781–788Crossref, Medline, Google Scholar
43. Freedman LR, Rock D, Roberts SA, Cornblatt BA, Erlenmeyer-Kimling L: The New York High-Risk Project: attention, anhedonia, and social outcome. Schizophr Res 1998; 30:1–9Crossref, Medline, Google Scholar
44. Buchanan RW, Strauss ME, Breier A, Kirkpatrick B, Carpenter WT Jr: Attentional impairments in deficit and nondeficit forms of schizophrenia. Am J Psychiatry 1997; 154:363–370Link, Google Scholar
45. Lyons MJ, Toomey R, Faraone SV, Kremen WS, Yeung AS, Tsuang MT: Correlates of psychosis proneness in relatives of schizophrenic patients. J Abnorm Psychol 1995; 104:390–394Crossref, Medline, Google Scholar
46. Pandurangi AK, Sax KW, Pelonero AL, Goldberg SC: Sustained attention and positive formal thought disorder in schizophrenia. Schizophr Res 1994; 13:109–116Crossref, Medline, Google Scholar
47. Roitman SE, Keefe RS, Harvey PD, Siever LJ, Mohs RC: Attentional and eye tracking deficits correlate with negative symptoms in schizophrenia. Schizophr Res 1997; 26:139–146Crossref, Medline, Google Scholar
48. Risch N: Linkage strategies for genetically complex traits, II: the power of affected relative pairs. Am J Hum Genet 1990; 46:229–241Medline, Google Scholar
49. Risch NJ, Zhang H: Mapping quantitative trait loci with extreme discordant sib pairs: sampling considerations. Am J Hum Genet 1996; 58:836–843Medline, Google Scholar