Relative Glucose Metabolic Rate Higher in White Matter in Patients With Schizophrenia
Abstract
Objective: There is increasing evidence demonstrating that circuits involving the frontal lobe, striatum, temporal lobe, and cerebellum are abnormal in individuals with schizophrenia, which suggests that metabolic activity in the white matter connecting these areas should be investigated. Method: The authors obtained [ 18 F]fluorodeoxyglucose (FDG) positron emission tomography (PET) and matching T1-weighted magnetic resonance imaging (MRI) on 170 subjects. Participants were 103 normal volunteers and 67 unmedicated patients with schizophrenia (N=61) or schizoaffective disorder (N=6). The images were coregistered and warped to standard space for significance probability mapping. Results: Compared with normal volunteers, patients showed higher relative metabolic rates in the frontal white matter, corpus callosum, superior longitudinal fasciculus, and white matter core of the temporal lobe. Elevated activity in white matter was most pronounced in the center of large white matter tracts, especially the frontal parts of the brain and the internal capsule. The white matter elevation did not appear to be entirely related to changes in gray matter/white matter brain proportions, whole brain metabolic rate bias, or excess head motion in patients, but this cannot be ruled out without absolute glucose determinations. Patients also showed significantly lower relative glucose metabolism in the frontal and temporal lobes, caudate nucleus, cingulate gyrus, and mediodorsal nucleus of the thalamus relative to normal volunteers, which is consistent with earlier studies. Conclusions: In comparisons of unmedicated schizophrenia patients with normal volunteers, relative metabolic increases are apparent in white matter in patients with schizophrenia as well as decreases in gray matter. Inefficiency in brain circuitry, defects in white matter leading to enhanced energy need, white matter damage, and alterations in axon packing density are among the possible explanations for these schizophrenia-related findings of relatively increased metabolism in white matter.
Functional imaging studies of patients with schizophrenia have revealed low relative glucose metabolic rates (rGMR) in the frontal and temporal lobes, cingulate gyrus, basal ganglia, and thalamus. Structural brain abnormalities in individuals with schizophrenia include volume alterations of the frontal lobe, cingulate gyrus, temporal lobe, and subcortical brain regions, including the striatum, thalamus, cerebellum, and hippocampus (1) . Alterations in connectivity among the frontal lobe, basal forebrain, and limbic system have been proposed as network deficits in schizophrenia patients (2 – 7) . These structures might all be affected by a common neurotransmitter deficit or, alternatively, reflect the downstream effects of a prefrontal abnormality. The possibility of a disturbance in the axonal interconnections of these structures should also be considered. A global deficit in myelin in schizophrenia (8 , 9) might produce a pattern of distributed, multiregional deficits that is compatible with the complex, not clearly localizing, and behavioral and cognitive disorganization in the disorder. Alterations in the number, distribution, and ultrastructural integrity of oligodendrocytes, key white matter components, have been reported in the prefrontal cortex in schizophrenia patients (10 – 13) .
While numerous studies using positron emission tomography (PET) have observed metabolic decreases in gray matter in schizophrenia, white matter has been largely ignored or dismissed as being almost entirely lacking in measurable metabolic activity. Information traffic along axons requires energy, however, and studies in animals have shown strong correlations between cortical stimulation frequency and rGMR in the corpus callosum (14) . A key historical 2-deoxyglucose study conducted by Sokoloff et al. (15) found that the metabolic rate in the corpus callosum was associated with levels of alertness.
Neither our earlier reports nor other reports appear to have examined rGMR in specific regions of interest located in white matter. Indeed, statistical analyses on functional images often involve a thresholding step that is intended to exclude regions that likely comprise white matter or CSF. Reexamining our significance probability maps revealed that areas in the frontal white matter, cingulum bundle, and anterior thalamic radiations showed significant increases in a comparison of 37 drug-free schizophrenia patients and 33 normal volunteers (16) . White matter in the center of the temporal lobe and in some regions of the centrum semiovale showed higher rGMR in recently medicated patients relative to normal volunteers (17) . Hints of a possible abnormality in previous studies have suggested the need for a systematic evaluation of rGMR in white matter in patients with schizophrenia.
Method
Subjects
The study group comprised 170 subjects on whom both PET and magnetic resonance imaging (MRI) were obtained: 103 normal volunteers and 67 patients with schizophrenia (N=61) or schizoaffective disorder (N=6). The patients (49 men, 18 women; mean age=34.3 [SD=17.9] years, range=13–73; mean education=12.9 [SD=2.5] years) were recruited from the Mount Sinai and Bronx Veterans Affairs Hospitals. The patients were evaluated with the Comprehensive Assessment of Symptoms and History (18) and diagnosed according to DSM-IV criteria. Patients were either never previously medicated (N=33) or had been neuroleptic-free for at least 2 weeks (N=34). Fifty-nine patients were right-handed, four were left-handed, three were ambidextrous, and one was undetermined based on the Edinburgh Handedness Inventory (19) . Administered rating scales included the Positive and Negative Syndrome Scale (20) (total psychopathology score=23.9 [SD=14.9]). Positive and Negative Syndrome Scale scores were not available for nine patients because of scheduling logistics.
The 103 normal volunteers (51 men, 52 women; mean age=43.4 [SD=17.7] years; range=20–80; mean education=16 [SD=2.4] years; right-handed [N=96]; left-handed [N=6]; ambidextrous [N=1]) were recruited by word-of-mouth or advertising. These volunteers were assessed using the Comprehensive Assessment of Symptoms and History and were found to have no history of psychiatric illness in themselves or their first-degree relatives.
All participants were screened by medical history, physical examination, and laboratory testing. Individuals with a history of substance abuse/dependence, neurological disorders, head trauma, clinical dementia, or a positive urine test for drugs of abuse on the day of the PET scan were excluded. After a complete description of the study, all participants provided written informed consent. Volumetric data from 40 of the 67 patients’ MRI scans and PET data for the thalamus and cortex (27 patients) have been reported previously (16 , 21 , 22) .
PET Procedures
A 24-gauge angiocath was inserted (by Dr. M.S. Buchsbaum) in the antecubital vein, and a 0.9% saline drip was started. Patients were then moved to a sound-attenuated room and were read standard instructions about the serial verbal learning task (23) , which was specifically developed for the 32-minute [ 18 F]fluorodeoxyglucose (FDG)-uptake period; the serial verbal learning task is analogous to and based on the principles of the California Verbal Learning Test (24) . As described elsewhere (23) , the serial verbal learning task was selected because it requires both short-term memory (or “working memory”) (25) and encoding for long-term memory.
PET and MRI Acquisition
PET scans (20 slices, 6.5 -mm thickness) were obtained with a head-dedicated General Electric (GE, Milwaukee) scanner (model-PC2048B) with a measured resolution of 4.5 mm in plane (4.2 to 4.5 mm across 15 planes). We injected 5 mCi-FDG and processed the images as described elsewhere (16) . T1-weighted axial MRI GE scans were acquired with the Signa 5x system with the following parameters: repetition time=24 ms, echo time=5 ms, flip angle=40°, slice thickness=1.2 mm, pixel matrix=256×256, field of view=23 cm, total slices=128.
MRI Segmentation and Metabolic Rate Normalization
First, we used Automated Image Registration 5.2.5 (26) and a six-parameter rigid-body transformation to coregister each subject’s FDG-PET scan to his or her anatomical MRI. We used FSL FAST (27) to segment the MRI into gray and white matter and CSF and create a binary image for each of the three tissue types. These images were then smoothed with a 5-mm full-width at half-maximum filter to approximate the resolution of FDG-PET images. Smoothing resulted in three images for each subject, representing tissue concentration and ranging continuously in value from 0 to 1. To avoid potential artifacts arising from differences in the proportion of gray and white matter tissue, we computed the mean brain activity within gray (gray matter concentration >0.75) and white matter voxels (white matter concentration >0.75), respectively, and then computed the average of these tissue means. This yielded a mean brain metabolic rate equally weighted for gray and white matter tissue and was used to divide the raw FDG-PET values to compute the rGMR for significance probability mapping. A t test comparing the composite gray-white denominator did not reveal statistically significant differences between patients and volunteers.
Stereotaxic Normalization of MRI and FDG-PET
We used Automated Image Registration 5.2.5 (http://bishopw.loni.ucla.edu/AIR5/index.html) to align each subject’s MRI to the ICBM-452 template with a 12-point affine transformation. On the basis of this transformation, average images were created for the schizophrenia patients and the normal volunteers. These two templates were then averaged to create a custom template unbiased with respect to between-group differences in brain shape. All MRI were then renormalized to this custom template using nonlinear registration with the Automated Image Registration program “align_warp” and a fourth-order 105-parameter model.
Statistical Analysis
We compared rGMR on a voxel-by-voxel basis using standard t tests and our own program written in the R statistical language. In addition, we used spatial mixture analysis (28) to identify significance thresholds that are automatically estimated from the computed statistical images by fitting a mixture of three Gaussian probability distributions (corresponding to activated, deactivated, and nonactivated voxels) to the locally weighted image histogram and thus providing a method for separation of signal from background noise without first selecting an arbitrary p value.
After reviewing the resulting maps, we noted that significant regions of gray matter reduction were confluent across the prefrontal and temporal areas (related in part to the cohort size [N=170]) and that reporting their centroid and highest t value would not be helpful to the reader. Raising the t-value threshold would exclude some regions already reported as hypoactive in the literature, preventing replicatory inspection.
Results
Analysis of Full Group
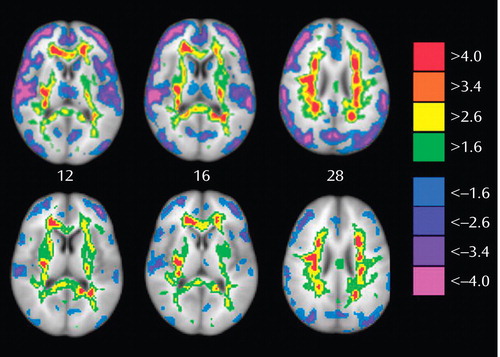
In cortical gray matter regions, voxel-wise statistical comparison of rGMR in patients and the full set of normal volunteers (with age removed as a single covariate for both groups) revealed an activation pattern consistent with previous studies that found relatively decreased activity that was most pronounced in the anterior prefrontal, lateral temporal, and posterior parietal regions in schizophrenia patients ( Figure 1 ). In addition, however, the patients showed pervasive and widespread increases of rGMR in white matter tracts throughout the brain ( Figure 1 ), including the corpus callosum, superior and inferior longitudinal fasciculi, and uncinate fasciculus. Higher rGMR in white matter in patients relative to volunteers was evident in the sagittal sections ( Figure 2 ) in the white matter of the corpus callosum and superior longitudinal and uncinate fasciculi.

a Row 1: Illustrates significance probability maps using a color bar indicating that white matter of the corpus callosum, anterior frontal lobe, posterior limb of internal capsule, uncinate fasciculus, and superior longitudinal fasciculus has higher rGMR in the schizophrenia group, while gray matter of the dorsolateral prefrontal cortex, thalamus, cingulate gyrus, and caudate nucleus has lower rGMR in the schizophrenia group. Areas of significance are relatively widespread and contiguous, encompassing >10,000 voxels in some cases. The significance probability maps are indicated by the color bar so that both protected 0.001 levels of significance are available for exploratory purposes and p<0.05 levels can be appreciated to confirm widely reported gray matter decreases in the frontal lobe, temporal lobe, and thalamus. Row 2: Illustrates spatial mixture modeling analysis identifying a large and contiguous dorsoventral cluster of voxels in white matter that meets the p<0.05 criterion. Row 3: Illustrates the mean white matter template derived from the average of all subjects’ normalized white matter concentration image; note the resemblance to the pattern seen in the admixture analysis in row 2. Row 4: Illustrates (right to left) the Talairach level=12, Montreal Neurological Institute anatomical template, spatial mixture modeling analysis, and t tests.

a Top two rows: Illustrate significance probability maps using a color bar indicating that white matter of the corpus callosum, superior longitudinal fasciculus, and uncinate fasciculus shows higher rGMR in patients relative to normal volunteers. Series begins with the right hemisphere (x=32) and proceeds toward the midline to x=4; the second row shows the left hemisphere. Row 3 shows two sections enlarged and a color bar.
Because previous studies did not detect a generalized pattern of white matter hypermetabolism in schizophrenia, we carried out a series of supplementary analyses aimed at ruling out the possibility that the white matter differential resulted from a statistical or image-processing artifact or that task performance was the major source of variation. The following three plausible alternative hypotheses were established: 1) Because of known structural differences between the brains of patients and comparison subjects, differences in rGMR may be secondary to or confounded by systematic variation in gray/white/CSF tissue concentration in the two groups; 2) since patients performed more poorly relative to comparison subjects on the serial verbal learning task administered during glucose uptake, the appearance of globally heightened white matter activity may be entirely unrelated to the disease state, reflecting the physiology of poor performance instead—a novel but not implausible finding in its own right; and 3) patients moved more in the PET scanner relative to volunteers, blurring gray matter into white matter locations, spuriously raising white matter values.
Contribution of Gray and White Matter Proportions
We examined the normal-versus-schizophrenia t test values as a function of the average local (gray/white) tissue concentration score in spatially normalized gray and white matter templates. These templates were created by averaging the mean gray and white matter atlases for each group, yielding a measure of mean tissue concentration for every voxel in standard space. Throughout the entire brain, the greater the white matter tissue concentration, the higher the t value separating normal volunteers and patients ( Figure 3 ). Thus, the greatest contribution to the effect came from white matter voxels surrounded by other white matter voxels and with higher signal-intensity values. These are the voxels that are farthest from CSF voxels, in the centers of the larger white matter tracts or bundles, and therefore they are the voxels least likely to have rGMR changed by partial volume or resolution-limit effects.
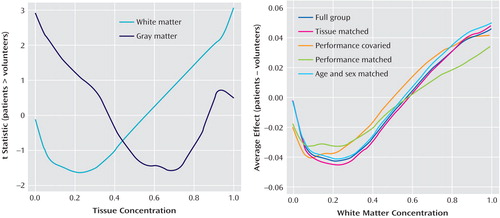
a Positive t values indicate patients >volunteers for relative metabolic rate. For white matter concentration scores above 0.75, t tests are above p<0.05, one-tailed, and reach p<0.005 for scores >0.95. This indicates that the higher the confidence that the voxel is white matter based on the coregistered MRI, the higher the FDG t test comparing normal volunteers and patients on that voxel. Whole brain gray matter differences do not reach significant t values, indicating that gray matter changes are restricted to more limited areas of the brain and not a whole brain tissue effect. This mitigates against the elevation of relative white matter values because of the depression of relative gray matter values, since the same divisor for relative metabolic rate is used for the whole brain. Since regions with low gray matter are likely to have high white matter, a mirror-image graph is created for the low tissue concentration values of the x-axis. The more likely a voxel is to be white matter from 0.2 to 1.0, the more likely the mean patient-minus-comparison difference in rGMR is to be positive. Since rGMR voxel standard deviations are typically 0.06 to 0.12, the effect sizes are in the range of 0.66 to 0.25 for tissue concentration scores >0.75. This is true for the full group of 72 patients and 115 normal volunteers with and without serial verbal learning task performance covariance as well as for the subgroups that were tissue-matched (patients: N=67, normal volunteers: N=67; slightly different for each pixel) and serial verbal learning task-matched (patients: N=30, normal volunteers: N=30). Note that the full group (dark blue) and tissue-matched (red) curves are almost overlapping, mitigating against the explanation that misplaced gray matter voxels in a particular brain area in patients with schizophrenia account for the relative white matter increases.
Proportional Matching of MRI Tissue Type
For every pixel, we used a multivariate algorithm (“Matchit” implemented in R [http://GKing.Harvard.Edu/matchit]) to find the subset of normal volunteers that provided the best “match” for gray, white, and CSF tissue concentration. This procedure is based on optimizing a “propensity score,” which is defined as the probability that an individual is a member of one group given the variables on which to match. This is analogous to matching our normal volunteers and schizophrenia patients simultaneously on age, education, and marital status (analogous to gray, white, and CSF tissue concentration) and discarding some volunteers until the match is optimal. In this analysis, however, a different set of matched normal volunteers was used for each voxel in stereotaxic space. Thus, for each voxel, the group of schizophrenia patients was matched with a group of normal subjects with the same distribution of gray, white, and CSF tissue concentration. This was possible because our large cohort of normal healthy comparison subjects allowed for many potential matching subsets across the whole brain. Voxel-wise t statistics performed on the glucose values after tissue matching did not significantly alter the overall findings of higher rGMR in the white matter of the patients. Note that for each voxel, the groups of PET scans had relative metabolic rate determined in groups of individuals who were matched on the MRI tissue type. As shown in Figure 3 , white matter concentration versus the difference in group means indicated that local gray and white matter concentration differences could not be the sole sources of the observed white matter hypermetabolic effect.
To examine whether the overall white matter raw FDG uptake (in nanocuries) was associated with the gray matter uptake, we examined the correlation between the average uptake from white and gray matter tissue (with segmented tissue concentration values >0.75, which was the same fraction used in the computation of rGMR) in the spatially unnormalized (“native-space”) PET images. This correlation was 0.44 in normal volunteers and 0.41 in schizophrenia patients, and the difference was not significant (p=0.84). Not surprisingly, this indicated that individuals with higher uptake in gray matter also tended to have higher uptake in white matter. When whole brain mean nanocurie values were covaried out, the remaining partial correlations were 0.02 and 0.11, respectively, which was consistent with the lack of a global reciprocal relationship; this latter analysis suggests a very modest linkage between gray and white matter rGMR and argues against the white matter effect being a mere byproduct of gray matter differences. Last, we examined the raw nanocurie uptake values for gray and white matter tissue in the spatially unnormalized images. Here, white matter showed higher values in patients relative to normal volunteers, while gray matter values were not significantly different between the two groups (whole population [schizophrenia patients >normal volunteers]: gray matter: t=–0.348, p=0.73; white matter: t=3.711, p=0.0003; restricted to California verbal learning test-matched subjects [schizophrenia patients >normal volunteers]: gray matter: t=1.02, p=0.31; white matter: t=2.205, p=0.03; restricted to age-matched group [schizophrenia patients >normal volunteers]: gray matter t=–0.37, p=0.71; white matter: t=3.692, p=0.0004). Again, this is consistent with an effect in white matter, which appears despite differences in body weight, dose, and other factors that affect nanocurie uptake. In addition, the persistence of this effect on the unscaled PET data rules out an artifact introduced during the conversion to relative glucose values. Note that since this analysis relied only on native-space (not spatially normalized) images, nonlinear normalization artifacts cannot be the source of patient/normal volunteer differences.
Last, as an additional evaluation of the potential contribution of low gray matter metabolic rate to white matter increase in schizophrenia patients, we recomputed the group difference maps removing three nuisance variables, gray matter metabolic rate (segmentated gray matter value >0.75), an average value from the midbrain determined stereotaxically (chosen in the center of the cerebral peduncles and pons at z=–12 and –16), and age. This analysis ( Figure 4 ) showed that higher metabolic rates in the corpus callosum and frontal white matter still remained statistically significant.
a Top: Statistical images of data relative to the equally weighted mean of gray and white matter. Bottom: Matching comparison covariate images with average gray matter (mean nanocurie value for gray matter voxels with gray concentration >0.75), average midbrain values, and age removed. Note that high white values in the corpus callosum, frontooccipital white and frontal lobe, especially in vicinity of the anterior limb of the internal capsule, remain significant. Decreased metabolic rates in the frontal lobe also remain significant even when mean gray matter activity is statistically removed.
Neuropsychological Task Performance, Age- and Sex-Matched Groups
Performance on the serial verbal learning task was better in normal volunteers than in schizophrenia patients (mean=13.1 [SD=1.84] versus mean=7.8 [SD=3.70], respectively, p<0.001). We carried out two analyses, first with the volunteers and patients matched on the serial verbal learning task total number correct (N=34) in each group, mean number correct (N=10.7), and second on the whole group with the serial verbal learning task as a covariate. As shown in Figure 4 , both the subject-matching and covariance correction using all subjects had little effect on the tissue-concentration/mean-difference curve. Figure 4 also illustrates subanalyses of normal volunteers and patients matched on age and sex, demonstrating that scores continued to show the white matter hypermetabolic pattern.
Finally, patients might have had more head movement relative to normal volunteers during the PET scan, thereby blurring the image and contaminating white matter areas with actual gray matter activity levels. Although the subjects’ heads were restrained by a specially molded plastic headholder during scanning, the possibility of differential head movement between patients and volunteers cannot be dismissed out of hand. Therefore, we examined this potential artifact by outlining each FDG-PET with an automated edge-finding algorithm and each MRI by tracing the gray matter edge. If the patients had moved their heads more than volunteers, the consequently blurred FDG edge outline would tend to be larger than the MRI cortical edge; however, no significant group difference in PET/MRI size ratios was observed.
Discussion
Relative White Matter Hypermetabolism
The data reported in the present study support earlier literature on frontal, temporal, striatal, and thalamic metabolic decreases and cerebellar increases in gray matter in schizophrenia patients as reviewed previously but also indicate white matter increases. White matter change has been little reported in FDG-PET research in schizophrenia, and for this reason we review competing hypotheses of white matter metabolic rate elevation and, briefly, known neurological conditions associated with increased metabolic rate in white matter to cover all potential pathophysiological mechanisms.
Inefficiency Model of High White Matter Metabolic Activity
Communication that is redundantly repeated, routed to multiple destinations, and/or poorly inhibited, synchronized, terminated or regulated by the frontostriatal-thalamic control circuit might demand greater metabolic activity in white matter pathways. Several sets of different but parallel routings are given in models (29) of these pathways, and minor misroutings, disturbances in the topographical organization, and the use of multiple rather than single pathways all provide potential explanations for inefficiency. The possibility of disorder in these pathways in schizophrenia has received theoretical, animal, and imaging support (16 , 30 – 33) . While one might have expected higher rGMR in the gray matter areas associated with higher white matter traffic, it is also possible that longer interhemispheric or longitudinal circuits are used inappropriately in place of more local circuits. Analysis of interregional correlation patterns in individuals with high and low white matter rGMR, examination of electroencephalographic coherence patterns, and functional MRI studies contrasting tasks that require and do not require interhemispheric coordination might help to address this issue.
Axon Density Effects
Tighter packing of axons, dehydration with reduced water between axons, and thinner myelin sheaths or reduced oligodendrocyte cellular volume might be associated with higher metabolic rates per unit area. Tangling, misrouting, brain edema, and thinner sheaths, or even the later development of axons in normal volunteers that are not myelinated in patients, might be associated with lower density. Indeed, recent neuropathological studies have demonstrated a significant loss of oligodendrocytes in the frontal white matter of schizophrenia patients, involving changes in myelin (9) as well as alterations in the spatial distribution and ultrastructural changes in these cells (10 , 11) that may directly contribute to the differences in rGMR observed in this study.
Pathophysiology of Observed Elevated White Matter Metabolic Rates: Inflammation, Radiation, Anoxia, Repair, and Dementia Effects
Elevations in white matter metabolic rate have been reported in spinal cord radiotherapy for hypopharyngeal and thyroid cancer (34 , 35) , and this uptake has been suggested to be associated with the myelopathy known to be a consequence of radiation treatment. An autopsy study of one patient with elevated FDG uptake revealed demyelination (with axonal loss) and neuronal damage in the cervical spinal cord (36) . The investigators speculated that “functional recovery is supported by a process that probably differs from the restoration of the mechanism destroyed by the radiotherapy…an altered conduction mechanism of the action potential, involving an increased number of sodium channels along the demyelinated segments of the injured axons, which is fully congruent with the PET findings” (36) .
Lesions of the white matter in multiple sclerosis may also be metabolically hyperactive, which is consistent with inflammatory or reparative increases in metabolism (37) . In multiple sclerosis, the activation of astrocytes and microglia accompanies the destruction of myelin (38) . Other studies have not confirmed hypermetabolism in multiple sclerosis (39 , 40) , but some of them do not provide information on specific lesion areas or maps of comparison subjects versus patients (40) . Remyelination of damaged areas involves oligodendrocytes. In a recent review, Ludwin (41) suggests that this is more widespread in multiple sclerosis than often credited. Remyelination in schizophrenia has not received significant attention.
Hypoxic damage during childbirth has been noted as a risk factor in schizophrenia. However, oligodendrocytes appear more sensitive to hypoxia than astrocytes or microglia in in vivo studies of neonatal rat brain (42) , suggesting that it might be patients with low white matter uptake rather than those with high white matter uptake who suffer this insult. Carbon monoxide toxicity has been associated with greater white matter than gray matter decreases in regional PET-FDG metabolism, which is again consistent with greater white matter sensitivity to hypoxia (43) . Patients with Wernicke-Korsakoff syndrome have relative hyper metabolism in white matter and hypo metabolism in subcortical gray matter (44) . The relatively confluent white matter mask appearance of the significance probability maps in the Wernicke-Korsakoff patients for Talairach z=28 is not entirely dissimilar to our findings in schizophrenia patients ( Figure 1 ).
Interstitial Neurons and Ectopic Gray Matter
An increased density of interstitial neurons in white matter might elevate the rGMR. Interstitial neurons have been found in the white matter of the frontal and temporal lobes, suggesting a defect during migration with a failure to reach their cortical targets (45 , 46) , and this effect may be more prominent in patients with the deficit form of schizophrenia (47) and in the more superficial regions of frontal white matter (48) , although not all studies confirmed this finding (49) . Ectopic foci of gray matter in an adjacent region anterior to the caudate nucleus have been visualized on MRI (50) and, if sufficiently frequent, even if too small to be routinely observed (<1 mm), might elevate the rGMR in frontal white matter.
Reciprocal Changes in Gray and White Matter
Higher white matter rGMR could stem from reduced rGMR coupled with normal white matter activity. Since imaging studies of schizophrenia have found frontal and temporal metabolic rate decreases, paralleled by reduced frontal and temporal gray matter on anatomical MRI, the possibility merits careful consideration. Brains with proportionately less gray matter might have lower total brain uptake of tracer and a resulting higher white matter pixel/whole brain average ratio. To mitigate this bias for each subject, we divided the raw activity in each pixel by one-half the mean activity in all gray matter (>0.75 probability on MRI segmentation) plus one-half the mean activity in all white matter (similarly selected voxels). In this way, volume changes in gray and white matter in schizophrenia would not bias whole brain metabolic rate. We then performed several analyses. First, we compared rGMR of schizophrenia patients with rGMR in sets of normal volunteers that were selected for each voxel as representing the best match in gray, white, and CSF tissue concentration as determined by an MRI segmentation algorithm; these maps equally confirmed the white matter elevation. Second, we evaluated spatial mixture modeling (28) , which uses a threshold based on a separate population of t values; this analysis confirmed the white matter effect (and yielded a somewhat more confluent indication of white matter change), suggesting separate populations of white matter rGMR values. Third, we examined the plots of tissue concentration/t values to assess whether the white matter elevation arose solely from gray matter decrease. The relationship between the t values and the white matter tissue concentration value could not arise from the rGMR divisor being biased low in patients since the same rGMR divisor is used for white matter voxels with concentrations ranging from 0.1 to 1.0 (had the effect come from the divisor, the increasing t values illustrated in Figure 3 from 0.4 to 1.0 would not have been expected). Moreover, this effect, as illustrated in Figure 3 , was consistent across various matched subsets of the full group. We also examined global differences in gray and white matter activity in native-space images using unscaled nanocurie values. First, this analysis confirmed that the finding of white matter hypermetabolism was not an artifact of the spatial normalization process. We then showed that even when using raw nanocurie values, global white matter, but not gray matter, differences between groups were significant. Next, we found no evidence for differences in the correlation between gray and white matter nanocurie values between the two groups. Thus, this native-space analysis also shows that differences observed in the statistical parametric mapping analysis were not driven by an artifact incurred during the transformation to relative glucose values. Additionally, we examined the statistical images in detail. Effects were greatest in the central regions of large white matter areas, inconsistent with a head movement or whole brain divisor artifact. Finally, we used analysis of covariance to remove the mean gray matter value, mean cerebellar peduncles and pons values, and age. This analysis still confirmed statistically significant white matter values in schizophrenia. It should be noted that this covariance analysis included brain gray matter activity that is generally found to be low in schizophrenia, and thus this analysis might well remove some schizophrenia-related variance (just as using yearly income or the number of close personal friends as a covariate might attenuate gray matter metabolic rate reduction in the temporal and frontal lobes). Despite this possible overcompensation, both white matter increases and frontal metabolic decreases remained significant, even when the areas of cortical decrease—especially in the temporal lobes—were minimized.
Gray Matter Decreases
The relative reduction of gray matter rGMR in the current statistical maps has been observed in earlier studies that included subgroups of this same population using regions of interest for the frontal lobe (16 , 51) , temporal lobe (51) , caudate nucleus (52) , dorsal cingulate gyrus (53) , and mediodorsal nucleus of the thalamus (54) . Similar findings also have been widely reported in the FDG-PET literature (55 , 56) .
Limitations and Summary
In this large cohort of unmedicated patients, artifacts of neuroleptic medication are minimized, cognitive state is controlled, and statistical power to detect differences is enhanced. Some small cohort size studies have found increases in frontal and thalamic FDG uptake in unmedicated patients (N=10 [57] and N=4 [58] ); the lack of significance probability maps, uptake tasks, or white matter regions of interest makes comparison with the current white and gray matter results uncertain. The next level of scientific examination of individual differences in hypo- hyperfrontality and symptom constellations, medication responsiveness, genetic markers, and other features will clearly be necessary to understand this variation. Absolute glucose metabolic rates were not obtained, and thus the possibility that gray matter change did not affect the measurement of white matter activity cannot be fully excluded. Obtaining full glucose quantification on never-medicated schizophrenia patients will be valuable in replication and extension of this finding, although such large cohorts will be difficult to obtain.
In their important study, Weber et al. trenchantly suggest that “monitoring the energy supply of white matter may yield important information on the traffic on the highway and with it on cerebral communication” (14) . We feel that traffic that is inefficient, duplicative, erroneous, and unselected is the likely explanation for these relative metabolic increases and speculate that this may be related to the extensive literature on cognitive deficits in schizophrenia.
1. Shenton ME, Dickey CC, Frumin M, McCarley RW: A review of MRI findings in schizophrenia. Schizophr Res 2001; 49:1–52Google Scholar
2. Benes FM: Emerging principles of altered neural circuitry in schizophrenia. Brain Res Brain Res Rev 2000; 31:251–269Google Scholar
3. Bunney WE, Bunney BG: Evidence for a compromised dorsolateral prefrontal cortical parallel circuit in schizophrenia. Brain Res Brain Res Rev 2000; 31:138–146Google Scholar
4. Carlsson A: A paradigm shift in brain research. Science 2001; 294:1021–1024Google Scholar
5. Grace AA: Gating of information flow within the limbic system and the pathophysiology of schizophrenia. Brain Res Brain Res Rev 2000; 31:330–341Google Scholar
6. Heimer L: Basal forebrain in the context of schizophrenia. Brain Res Brain Res Rev 2000; 31:205–235Google Scholar
7. Middleton FA, Strick PL: Basal ganglia and cerebellar loops: motor and cognitive circuits. Brain Res Brain Res Rev 2000; 31:236–250Google Scholar
8. Hakak Y, Walker JR, Li C, Wong WH, Davis KL, Buxbaum JD, Haroutunian V, Fienberg AA: Genome-wide expression analysis reveals dysregulation of myelination-related genes in chronic schizophrenia. Proc Natl Acad Sci U S A 2001; 98:4746–4751Google Scholar
9. Davis KL, Stewart DG, Friedman JI, Buchsbaum M, Harvey PD, Hof PR, Buxbaum J, Haroutunian V: White matter changes in schizophrenia: evidence for myelin-related dysfunction. Arch Gen Psychiatry 2003; 60:443–456Google Scholar
10. Hof PR, Haroutunian V, Friedrich VL Jr, Byne W, Buitron C, Perl DP, Davis KL: Loss and altered spatial distribution of oligodendrocytes in the superior frontal gyrus in schizophrenia. Biol Psychiatry 2003; 53:1075–1085Google Scholar
11. Uranova N, Orlovskaya D, Vikhreva O, Zimina I, Kolomeets N, Vostrikov V, Rachmanova V: Electron microscopy of oligodendroglia in severe mental illness. Brain Res Bull 2001; 55:597–610Google Scholar
12. Uranova NA, Vostrikov VM, Orlovskaya DD, Rachmanova VI: Oligodendroglial density in the prefrontal cortex in schizophrenia and mood disorders: a study from the Stanley Neuropathology Consortium. Schizophr Res 2004; 67:269–275Google Scholar
13. Vostrikov VM, Uranova NA, Rakhmanova VI, Orlovskaia DD: Lowered oligodendroglial cell density in the prefrontal cortex in schizophrenia. Zh Nevrol Psikhiatr Im S S Korsakova 2004; 104:47–51Google Scholar
14. Weber B, Fouad K, Burger C, Buck A: White matter glucose metabolism during intracortical electrostimulation: a quantitative [ 18 F]fluorodeoxyglucose autoradiography study in the rat. Neuroimage 2002; 16:993–998 Google Scholar
15. Sokoloff L, Reivich M, Kennedy C, Des Rosiers MH, Patlak CS, Pettigrew KD, Sakurada O, Shinohara M: The [ 14 C]deoxyglucose method for the measurement of local cerebral glucose utilization: theory, procedure, and normal values in the conscious and anesthetized albino rat. J Neurochem 1977; 28:897–916 Google Scholar
16. Buchsbaum MS, Hazlett EA, Haznedar MM, Spiegel-Cohen J, Wei TC: Visualizing fronto-striatal circuitry and neuroleptic effects in schizophrenia. Acta Psychiatr Scand Suppl 1999; 395:129–137Google Scholar
17. Desco M, Gispert JD, Reig S, Sanz J, Pascau J, Sarramea F, Benito C, Santos A, Palomo T, Molina V: Cerebral metabolic patterns in chronic and recent-onset schizophrenia. Psychiatry Res 2003; 122:125–135Google Scholar
18. Andreasen N, Flaum M, Arndt S: The Comprehensive Assessment of Symptoms and History (CASH): an instrument for assessing diagnosis and psychopathology. Arch Gen Psychiatry 1992; 49:615–623Google Scholar
19. Oldfield RC: The assessment and analysis of handedness: the Edinburgh Inventory. Neuropsychologia 1971; 9:97–113Google Scholar
20. Kay SR, Fiszbein A, Opler LA: The Positive and Negative Syndrome Scale (PANSS) for schizophrenia. Schizophr Bull 1987; 13:261–276Google Scholar
21. Byne W, Buchsbaum MS, Kemether E, Hazlett EA, Shinwari A, Mitropoulou V, Siever LJ: Magnetic resonance imaging of the thalamic mediodorsal nucleus and pulvinar in schizophrenia and schizotypal personality disorder. Arch Gen Psychiatry 2001; 58:133–140Google Scholar
22. Hazlett E, Buchsbaum M, Byne W, Wei T-C, Spiegel-Cohen J, Geneve C, Kinderlehrer R, Haznedar M, Shihabuddin L, Siever L: Three-dimensional analysis with MRI and PET of the size, shape, and function of the thalamus in the schizophrenia spectrum. Am J Psychiatry 1999; 156:1190–1199Google Scholar
23. Hazlett E, Buchsbaum M, Mohs R, Spiegel-Cohen J, Wei T-C, Azueta R, Haznedar M, Singer M, Shihabuddin L, Luu-Hisa C: Age-related shift in brain region allocation during successful memory performance. Neurobiol Aging 1998; 19:437–445Google Scholar
24. Delis D, Kramer J, Kaplan E, Ober B: The California Verbal Learning Test. New York, Psychological Corp, 1987Google Scholar
25. Baddeley A: Working memory. Science 1992; 255:556–559Google Scholar
26. Woods RP, Grafton ST, Watson JD, Sicotte NL, Mazziotta JC: Automated Image Registration, II. intersubject validation of linear and nonlinear models. J Comput Assist Tomogr 1998; 22:153–165Google Scholar
27. Zhang Y, Brady M, Smith S: Segmentation of brain MR images through a hidden Markov random field model and the expectation-maximization algorithm. IEEE Trans Med Imaging 2001; 20:45–57Google Scholar
28. Woolrich MW, Behrens TE, Beckmann CF, Smith SM: Mixture models with adaptive spatial regularization for segmentation with an application to fMRI data. IEEE Trans Med Imaging 2005; 24:1–11Google Scholar
29. Alexander GE, DeLong MR, Strick PL: Parallel organization of functionally segregated circuits linking basal ganglia and cortex. Annu Rev Neurosci 1986; 9:357–381Google Scholar
30. Swerdlow NR, Koob GF: Dopamine, schizophrenia, mania, and depression: towards a unified hypothesis of cortico-striato-pallido-thalamic function. Behav Brain Sci 1987; 10:197–245Google Scholar
31. Wu JC, Siegel BV, Haier RJ, Buchsbaum MS: Testing the Swerdlow/Koob model of schizophrenia pathophysiology using positron emission tomography. Behav Brain Sci 1990; 13:169–170Google Scholar
32. Kessler RM, Clark, CM, Buchsbaum, MS, Holcomb H, Margolin RA, Cappeletti J, Channing M, Manning RG, van Kammen DP, King AC, Johnson J: Regional correlations in patterns of glucose use in patients with schizophrenia and normal subjects during mild pain stimulation, in Positron Emission Tomography of the Brain. Edited by Heiss WD, Phelps ME. Berlin, Springer-Verlag, 1983, pp 196–200Google Scholar
33. Katz M, Buchsbaum MS, Siegel BV, Wu J, Haier RJ, Bunney WE: Correlational patterns of cerebral glucose metabolism in never-medicated schizophrenics. Neuropsychobiology 1996; 33:1–11Google Scholar
34. Esik O, Emri M, Szakall S Jr, Herzog H, Safrany G, Lengyel E, Boer A, Liszkay G, Tron L, Lengyel Z, Repa I: PET identifies transitional metabolic change in the spinal cord following a subthreshold dose of irradiation. Pathol Oncol Res 2004; 10:42–46Google Scholar
35. Esik O, Emri M, Csornai M, Kasler M, Godeny M, Tron L: Radiation myelopathy with partial functional recovery: PET evidence of long-term increased metabolic activity of the spinal cord. J Neurol Sci 1999; 163:39–43Google Scholar
36. Lengyel Z, Reko G, Majtenyi K, Pisch J, Csornai M, Lesznyak J, Tron L, Esik O: Autopsy verifies demyelination and lack of vascular damage in partially reversible radiation myelopathy. Spinal Cord 2003; 41:577–585Google Scholar
37. Schiepers C, Van Hecke P, Vandenberghe R, Van Oostende S, Dupont P, Demaerel P, Bormans G, Carton H: Positron emission tomography, magnetic resonance imaging and proton NMR spectroscopy of white matter in multiple sclerosis. Mult Scler 1997; 3:8–17Google Scholar
38. Mastronardi FG, Moscarello MA: Molecules affecting myelin stability: a novel hypothesis regarding the pathogenesis of multiple sclerosis. J Neurosci Res 2005; 80:301–308Google Scholar
39. Bakshi R, Miletich RS, Kinkel PR, Emmet ML, Kinkel WR: High-resolution fluorodeoxyglucose positron emission tomography shows both global and regional cerebral hypometabolism in multiple sclerosis. J Neuroimaging 1998; 8:228–234Google Scholar
40. Roelcke U, Kappos L, Lechner-Scott J, Brunnschweiler H, Huber S, Ammann W, Plohmann A, Dellas S, Maguire RP, Missimer J, Radu EW, Steck A, Leenders KL: Reduced glucose metabolism in the frontal cortex and basal ganglia of multiple sclerosis patients with fatigue: an 18 F-fluorodeoxyglucose positron emission tomography study. Neurology 1997; 48:1566–1571 Google Scholar
41. Ludwin SK: The pathogenesis of multiple sclerosis: relating human pathology to experimental studies. J Neuropathol Exper Neurology 2006; 65:305–318Google Scholar
42. Lyons SA, Kettenmann H: Oligodendrocytes and microglia are selectively vulnerable to combined hypoxia and hypoglycemia injury in vitro. J Cereb Blood Flow Metab 1998; 18:521–530Google Scholar
43. Tengvar C, Johansson B, Sorensen J: Frontal lobe and cingulate cortical metabolic dysfunction in acquired akinetic mutism: a PET study of the interval form of carbon monoxide poisoning. Brain Inj 2004; 18:615–625Google Scholar
44. Reed LJ, Lasserson D, Marsden P, Stanhope N, Stevens T, Bello F, Kingsley D, Colchester A, Kopelman MD: FDG-PET findings in the Wernicke-Korsakoff syndrome. Cortex 2003; 39:1027–1045Google Scholar
45. Akbarian S, Kim JJ, Potkin SG, Hetrick WP, Bunney WE Jr, Jones EG: Maldistribution of interstitial neurons in prefrontal white matter of the brains of schizophrenic patients. Arch Gen Psychiatry 1996; 53:425–436Google Scholar
46. Akbarian S, Sucher NJ, Bradley D, Tafazzoli A, Trinh D, Hetrick WP, Potkin SG, Sandman CA, Bunney WE Jr, Jones EG: Selective alterations in gene expression for NMDA receptor subunits in prefrontal cortex of schizophrenics. J Neurosci 1996; 16:19–30Google Scholar
47. Kirkpatrick B, Messias NC, Conley RR, Roberts RC: Interstitial cells of the white matter in the dorsolateral prefrontal cortex in deficit and nondeficit schizophrenia. J Nerv Ment Dis 2003; 191:563–567Google Scholar
48. Anderson SA, Volk DW, Lewis DA: Increased density of microtubule associated protein 2-immunoreactive neurons in the prefrontal white matter of schizophrenic subjects. Schizophr Res 1996; 19:111–119Google Scholar
49. Beasley CL, Cotter DR, Everall IP: Density and distribution of white matter neurons in schizophrenia, bipolar disorder and major depressive disorder: no evidence for abnormalities of neuronal migration. Mol Psychiatry 2002; 7:564–570Google Scholar
50. Nopoulos PC, Flaum M, Andreasen NC, Swayze VW: Gray matter heterotopias in schizophrenia. Psychiatry Res 1995; 61:11–14Google Scholar
51. Buchsbaum MS, Nenadic I, Hazlett EA, Spiegel-Cohen J, Fleischman MB, Akhavan A, Silverman JM, Siever LJ: Differential metabolic rates in prefrontal and temporal Brodmann areas in schizophrenia and schizotypal personality disorder. Schizophr Res 2002; 54:141–150Google Scholar
52. Shihabuddin L, Buchsbaum M, Hazlett E, Silverman J, New A, Brickman A, Mitropoulou V, Nunn M, Fleischman M, Tang C, Siever L: Striatal size and relative glucose metabolic rate in schizotypal personality disorder and schizophrenia. Arch Gen Psychiatry 2001; 58:877–884Google Scholar
53. Haznedar MM, Buchsbaum MS, Luu C, Hazlett EA, Siegel BV Jr, Lohr J, Wu J, Haier RJ, Bunney WE Jr: Decreased anterior cingulate gyrus metabolic rate in schizophrenia. Am J Psychiatry 1997; 154:682–684Google Scholar
54. Hazlett EA, Buchsbaum MS, Kemether EM, Bloom R, Platholi J, Shihabuddin L, Tang C, Byne W: Abnormal glucose metabolism in the mediodorsal nucleus of the thalamus in schizophrenia. Am J Psychiatry 2004; 161:305–314Google Scholar
55. Andreasen N, O’Leary D, Flaum M, Nopoulos P, Watkins G, Boles-Ponto L, Hichwa R: Hypofrontality in schizophrenia: distributed dysfunctional circuits in neuroleptic-naive patients. Lancet 1997; 349:1730–1734Google Scholar
56. Buchsbaum MS, Hazlett EA: Positron emission tomography studies of abnormal glucose metabolism in schizophrenia. Schizophr Bull 1998; 24:343–364Google Scholar
57. Soyka M, Koch W, Möller HJ, Rüther T, Tatsch K: Hypermetabolic pattern in frontal cortex and other brain regions in unmedicated schizophrenia patients: results from a FDG-PET study. Eur Arch Psychiatry Clin Neurosci 2005; 255:308–312Google Scholar
58. Volkow ND, Brodie JD, Wolf AP, Angrist B, Russell J, Cancro R: Brain metabolism in patients with schizophrenia before and after acute neuroleptic administration. J Neurol Neurosurg Psychiatry 1986; 49:1199–1202Google Scholar