Neuroimaging of Inhibitory Control Areas in Children With Attention Deficit Hyperactivity Disorder Who Were Treatment Naive or in Long-Term Treatment
Abstract
Objective: Difficulty with response inhibition is a cardinal symptom of attention deficit hyperactivity disorder (ADHD), combined type. Prefrontal and cingulate brain regions are known to be involved in inhibitory control. Event-related functional magnetic resonance imaging (fMRI) might establish if these regions differ in their activity in ADHD children relative to healthy comparison subjects. Method: Fifteen healthy comparison subjects and 17 children with ADHD, combined type, completed fMRI studies while performing the Stop Signal Task. Eight ADHD subjects were treatment naive; the remainder had a history of long-term treatment with stimulants, but they were medication free at the time of the fMRI. No subject had a learning disorder or a comorbid psychiatric condition (other than oppositional defiant disorder in the ADHD subjects). Results: Both the ADHD and comparison subjects activated the right dorsolateral prefrontal cortex on “stop” trials relative to “go” trials; this increase was greater in ADHD subjects. When inhibition was unsuccessful (relative to successful inhibition), healthy comparison subjects strongly activated the anterior cingulate cortex and the left ventrolateral prefrontal cortex. In contrast, the ADHD subjects did not show these differences. Activations in treatment-naive and ADHD subjects treated in the long term did not differ significantly in any brain regions. Conclusions: In relation to comparison subjects, ADHD subjects failed to activate the anterior cingulate cortex and the left ventrolateral prefrontal cortex after unsuccessful inhibition. These findings appear in treatment-naive ADHD individuals and are unlikely to be an artifact of long-term treatment with stimulants or of abrupt termination of stimulants before imaging.
Poor inhibitory control is a cardinal symptom of attention deficit hyperactivity disorder (ADHD) (1) . Inhibitory control is associated with a distributed network of brain regions, including the right dorsolateral prefrontal cortex (dorsolateral prefrontal cortex: Brodmann’s area 9) (2 , 3) , the anterior cingulate cortex (Brodmann’s area 32) (4) , the inferior parietal cortex (Brodmann’s area 40) (3 , 5) , and the bilateral ventro lateral prefrontal cortex (Brodmann’s area 47) (6) . Garavan and colleagues (5) examined the nature of this network with a modified Go/No-Go Task in healthy adults and found that for successful inhibition, subjects activated the right dorsolateral prefrontal cortex (Brodmann’s area 9/44), the right inferior parietal lobule, and the anterior cingulate cortex (Brodmann’s area 32). In contrast, unsuccessful inhibition was associated with activations in the left Brodmann’s area 9, a more posterior region of the cingulate (Brodmann’s area 24/6), and the insula (Brodmann’s area 13). Based on these results, we proposed that the left prefrontal cortex is involved in top-down tonic inhibitory control, whereas the right dorsolateral prefrontal cortex and the parietal lobe are involved directly in response inhibition or more phasic inhibitory control (5) . Finally, the anterior cingulate cortex was hypothesized to be involved in error detection and behavioral adjustment for subsequent trials. Con sistent with this model, Rubia et al. (3) found that during a “stop” task, healthy adults activated the right Brodmann’s area 9 and the right inferior parietal cortex during successful inhibitions, whereas unsuccessful inhibitions activated the anterior cingulate cortex.
Clinically, children with ADHD show deficits in many of the functions related to inhibitory control: failure to prepare, impulsive response to stimuli, and failure to adjust behavior after making an error. In a block design functional magnetic resonance imaging (fMRI) study with the Go/No-Go Task, Vaidya et al. (7) found that subjects with ADHD had greater frontal activation than comparison subjects to “no-go” blocks than to the “go” blocks. When event-related functional designs were used, children with ADHD (8) and adolescents with a history of childhood ADHD (9) were shown to have greater frontal activation on “no-go” versus “go” trials than healthy comparison subjects. Adolescents with a history of ADHD also showed increased activation in the left ventrolateral prefrontal cortex (Brodmann’s area 47) (10) . These increases in both dorsal and ventral prefrontal areas were highest in subjects whose symptoms had not resolved (10 , 11) . In contrast, Rubia et al. (12) compared healthy adolescents and those with ADHD in an fMRI study with the Stop Signal Task. Using a block design, they found that subjects with ADHD showed less activation of the right dorsolateral prefrontal cortex (Brodmann’s area 9) than comparison subjects in “stop” versus “go” blocks. Using event-related designs, Tamm et al. (13) found that adolescents with ADHD showed less activation of the anterior cingulate cortex on “no-go” trials than to novel distracters. Most recently, Rubia et al. (14) found that the right frontal and posterior cingulate cortex were activated by successful inhibitions relative to unsuccessful inhibitions in comparison subjects and that the magnitude of this difference was decreased in treatment-naive subjects with ADHD.
Based on these studies, we hypothesized that healthy children would show increased activity on event-related fMRI in the right dorsolateral prefrontal cortex and anterior cingulate cortex on “stop” trials relative to “go” trials on the Stop Signal Task and that this increase in activity would be attenuated or absent in subjects with ADHD. Because the anterior cingulate cortex is thought to be involved in error detection and conflict monitoring, we predicted that unsuccessful inhibitions would produce stronger activation of the anterior cingulate cortex than successful inhibitions and that this differential effect would be reduced in subjects with ADHD.
Although Rubia et al. (14) studied treatment-naive subjects with ADHD only, previous neuroimaging studies with children or adolescents with ADHD have combined previously treated and treatment-naive subjects (12) or have studied subjects who had been treated in the long term with stimulants (7 , 8 , 15) . Thus, it is not clear if the changes seen in the imaging studies relative to the comparison subjects reflect baseline differences in the groups or are an artifact of long-term treatment with stimulants. Furthermore, in these studies, children with ADHD who were in long-term treatment discontinued stimulant medication a short period before the imaging was performed, raising the possibility that acute stimulant withdrawal is responsible for any differences in relation to the comparison groups (16) . To resolve this issue, we directly compared two groups of subjects with ADHD: those with at least 1 year of successful stimulant treatment and those who were treatment naive. Two previous studies (7 , 17) also included subjects with both inattentive and combined types of ADHD. Because children with inattentive-type ADHD do not show marked deficits in inhibitory control, the two subtypes may have different neuroimaging responses to the “stop” signal or to the Go/No-Go Task. Thus, we chose to focus exclusively on children with the combined type of ADHD.
Method
Participants and Diagnostic Instruments
The subjects were right-handed children and adolescents ages 9 to 15 of both genders ( Table 1 ). The study groups were healthy comparison subjects, subjects who met criteria for ADHD with a history of long-term treatment with stimulants, and subjects with ADHD who had no history of psychotropic medication treatment (treatment naive). Written informed consent was obtained from each parent and assent from each child. The study was approved by the institutional review board of the University of Texas Health Science Center at San Antonio.

The Diagnostic Interview Schedule for Children, Version IV—Parent Version (DISC-IV-P) (18) was administered to the parent of each subject by a research assistant and the DISC-IV-P report was reviewed with the parent by a child and adolescent psychiatrist. The psychiatrist also performed a mental status examination of each child. Children with ADHD had to meet DISC-IV-P criteria for ADHD, combined type. A subject with ADHD could meet criteria for oppositional defiant disorder but could not meet criteria for conduct disorder or any anxiety, tic, or affective disorder. Healthy comparison subjects could not meet criteria for any of these psychiatric disorders or have any history of past treatment with psychotropic medication. In addition to the DISC-IV-P, each child’s medical history was reviewed. No subjects in any group had a history of substance or alcohol abuse/dependence, and none was taking any prescribed medications in the long term for conditions other than ADHD.
Conners’ Rating Scales—Revised scores (19) were collected for each subject. Healthy comparison subjects were required to have global and restless/impulsive factor scores within one standard deviation of the mean for the child’s age and gender on both the parent and teacher ratings. The children with ADHD in the treatment-naive group were required to have baseline global and restless/impulsive Conners’ Global Index ratings that were at least one and one-half standard deviations above the mean for the child’s age and gender for both parent and teacher ratings. For the children with ADHD who were treated long-term with stimulants, the parents were asked to rate the child during a period when the child was not taking medication for the last 6 months (such as on a weekend). These global and restless/impulsive Conners’ Rating Scales—Revised had to be one and one-half standard deviations above the mean for the child’s age and gender. To be eligible for the long-term treatment group, the teacher ratings on children taking stimulants had to be within one standard deviation of the mean for the child’s age and gender, indicating good response of the ADHD symptoms to stimulants. In addition, these children had to have been clinically stable while taking their stimulant for at least 1 year based on parent reports.
The Differential Abilities Scales (20) was used to provide a measure of the subject’s current cognitive functioning. All subjects were required to have a general cognitive ability score of at least 85 to participate in the study. The Wechsler Individual Achievement Test, 2nd ed. (21) was administered to assess basic reading, writing, and mathematics. No subject could meet criteria for a learning disability; that is, all subjects had to have standard reading and math achievement scores that were within one standard deviation of their full-scale IQ on the Differential Abilities Scale.
The Stop Signal Task
During the fMRI study, each child performed a mixed-trial version of the Stop Signal Task (22) . Each trial lasted 2,000 msec, and a fixation point was present at the center of the screen at all times. On “go” trials (75%), the letters “A” or “B” (a “go” stimulus) appeared just above the fixation point for 150 msec, and the child was instructed to press a button with the left thumb for the letter “A” or a second button with the right thumb for the letter “B.” On the “stop” trials (25%, selected at random), the “go” stimulus was followed by the “stop” signal (the letter “S”). On these trials, the child was instructed not to press the button. The “stop” signal was presented with a random stimulus-onset asynchrony of 250, 350, 450, or 550 msec after the “go” stimulus. The subjects performed 360 “go” trials and 120 “stop” trials, 30 for each of the four stimulus-onset asynchronies. On average, “stop” trials occurred every 8 seconds. The probability of inhibition was calculated for each of the four stimulus-onset asynchronies, and a slope was then calculated with the probability of inhibition values for the four “stop” stimulus-onset asynchronies. The “stop” signal reaction time, which provides a measure of speed of the inhibitory process, was then determined according to the method of Logan et al. (22) . The “stop” signal reaction time is presumed to begin when the “stop” signal occurs. It is calculated from the probability of inhibition and the distribution of reaction times to the “go” signal.
Image Acquisition
All scanning was performed on a GE/Elscint 2T Prestige system (General Electric, Milwaukee) located in the Research Imaging Center of the University of Texas Health Science Center at San Antonio. Before each functional study, a high-resolution axial T 1 -weighted series and a 3-Da structural series were obtained for each subject and used for anatomical reference. Functional imaging used an echo planer sequence sensitive to the blood-oxygen-level-dependent (BOLD) signal, acquiring 16–20 slices parallel to the anterior commissure-posterior commissure plane (TR=2000 msec, TE=45 msec, flip angle 90°, voxel size=3×3×6 mm). “Stop” signal data were collected in three separate 5-minute, 20-second scans, resulting in 360 images per subject. For each run, 120 “go” and randomly interspersed 40 “stop” trials were administered.
Functional Image Analysis
Functional image analyses were performed with tools available as part of the FSL software package (23) (www.fmrib.ox.ac.uk/fsl) and supplemented with utilities developed in house. To combat potential motion artifacts, each image in a time series underwent spatial registration to the middle data point in the time series (24) . Data were smoothed with a nonlinear algorithm designed to preserve image structure by smoothing voxels only thought to be of the same tissue type (5-mm kernel) (25) . Each data set was subjected to a multiple-regression analysis with a prewhitening technique to account for the intrinsic temporal autocorrelation of BOLD imaging. For each intracranial voxel, least squares coefficients were generated, independently reflecting the correct and incorrect trials from the “stop” and “go” conditions (26) . Statistical images were created by contrasting correct “stop” trials with correct “go” trials, incorrect “stop” trials with correct “go” trials, and correct versus incorrect “stop” trials.
To facilitate multisubject analysis based on the parameters created from the higher-resolution anatomical image, statistical images were spatially normalized to a standard stereotactic space (27) . Higher-level multisubject analysis used a mixed-effects model (28) in which each subject was represented by a random factor providing z images reflecting group activation patterns (subjects with ADHD [medication naive and previously medicated] and healthy comparison subjects) for each contrast previously described. Group maps were given a threshold based on the magnitude (z≥2.3) and extent (cluster significance: p<0.01; nine contiguous voxels) of activation (29 , 30) .
In addition to the statistical maps just described, a single omnibus activation map including all participants, regardless of diagnostic or medication status, was generated, and the spatially distinct clusters in the right dorsolateral prefrontal cortex, the anterior cingulate cortex, and the left and right ventrolateral prefrontal cortices were treated as functionally defined regions of interest. These regions of interest were overlaid upon each subject’s data to determine the proportion of signal change over time associated with each trial type. The maximum of these points (4 seconds after trial initiation) was then entered into a two-by-four-by-two multivariate analysis of variance (MANOVA) modeling the main effects of diagnostic group (ADHD versus comparison subjects), region of interest, and trial type (successful versus unsuccessful inhibition), with diagnostic group treated as a between-group factor and region of interest and trial types as repeated factors. Given the temporal blur of the hemodynamic response function (31) , the BOLD signal measured 4 seconds after the initiation of a trial is thought to be more closely associated with the physiological response evoked by the “stop” signal reaction time than earlier time points. Main effects and interactions were deconstructed with region-specific (ANOVAs) and within-subject subtraction scores representing differences in maximum activity for successful minus unsuccessful inhibition. Finally, differences between treatment-naive and previously treated patients were tested with similar ANOVA models.
Results
Criteria for Inclusion in Imaging Analysis
A total of 55 subjects met the diagnostic and neuropsychological criteria outlined and underwent fMRI scanning: 16 treatment-naive subjects with ADHD, 16 subjects in long-term treatment with ADHD, and 23 comparison subjects. However, in order for a subject’s imaging data to be included in the analyses, estimated motion during scanning could not exceed 3.2 mm. Furthermore, only subjects with greater than 75% accuracy on the “go” trials and who successfully inhibited at least 25% of the “stop” trials were included. Normal comparison subjects generally fail to inhibit on about 50% of the “stop” trials in this version of the task. Based on these criteria, four treatment-naive subjects with ADHD, five subjects in long-term treatment, and one comparison subject were excluded for either motion or poor task performance. An additional 13 subjects (two with ADHD in long-term treatment, four treatment-naive with ADHD, and seven comparison subjects) were excluded because of scanner artifacts (typically radio frequency inhomogeneity). Table 1 shows the final numbers of subjects in each group whose fMRI images underwent analysis.
Clinical and Demographic Features
There were no significant differences between the groups in terms of age, IQ, or Wechsler Individual Achievement Test II scores. Although there were more boys in the ADHD groups, this difference was not statistically significant. However, there were not enough girls to perform a group-by-gender analysis. Three of the long-term-treated and three of the treatment-naive children with ADHD had oppositional defiant disorder. The amount of time the ADHD group in long-term treatment was taking stimulants (methylphenidate or amphetamines) ranged from 1 to 9 years, with a mean of 4.9 years (SD=2.9). As expected, there were significant differences between the ADHD group and the comparison group in terms of parent reports for restless/impulsive (F=89.4, df=2, 29, p<0.001) and global (F=85.3, df=2, 29, p<0.001) Conners’ Rating Scales—Revised scores. In contrast, the ADHD groups did not differ. The treatment-naive ADHD group was different from the comparison group on the teacher-rated restless/impulsive (F=48.0, df=2, 28, p<0.001) and the global (F=55.8, df=2, 28, p<0.001) Conners’ Rating Scales—Revised scores, but the ADHD group treated in the long term was not, reflecting that stimulant treatment had successfully controlled ADHD symptoms in the classroom.
Behavior Performance on Stop Signal Task
Table 1 shows behavioral performance on the Stop Signal Task. There were no statistically significant differences between groups on any of the task indices, although the ADHD groups showed a reduced slope on inhibitory function (F=2.6, df=2, 29, p<0.09) and a longer “stop” signal reaction time (F=1.1, df=2, 29, p=0.34).
Based on estimates derived from the motion-correction algorithm (maximum absolute displacement), the children with ADHD were more prone to movement during scanning than the comparison children (F=8.79, df=1, 30, p=0.01). However, these differences abated after motion correction.
Voxel-Level Imaging Results
For healthy children, successful inhibition was associated with a network of brain regions in the right inferior frontal gyrus (Brodmann’s area: 9: 40, 5, and 30) and the right superior temporal gyrus (Brodmann’s area 22: 54, –45, and 14) ( Figure 1 ). In contrast, the comparison subjects activated the anterior cingulate cortex (Brodmann’s area 32; 1, 24, and 30), the bilateral ventrolateral prefrontal cortex (Brodmann’s area 47; 38, 18, and 4; and –42, 20, and 0), the right posterior parietal lobe (Brodmann’s area 7: 38, –42, and 38), and the bilateral precentral gyrus (Brodmann’s area 9; –42, 4 and 37; and 42, 8, and 36) during failed inhibition. Direct comparison of unsuccessful versus successful “stop” trials in comparison subjects showed increased activity in the anterior cingulate cortex (Brodmann’s area 24; 2, 24, and 22) and the left ventrolateral prefrontal cortex (Brodmann’s area 47; –46, 16, and –2), whereas no significant activations were present in the opposite contrast of successful versus unsuccessful “stop” trials.

a Although healthy children showed relatively more activity in the left ventrolateral prefrontal cortex for unsuccessful relative to successful inhibition, the children with ADHD did not. Slices were spaced 4 mm apart, beginning 2 mm below the anterior commissure-posterior commissure plane and were presented according to neurological conventions (right=right).
For children and adolescents with ADHD, successful inhibition was associated with a network of brain regions, including the right insula and the ventrolateral prefrontal cortex (Brodmann’s area 13; 39, 13, and 10), the right superior temporal gyrus (Brodmann’s area 39; 48, –53, and 14), bilateral occipital activity (Brodmann’s areas 19 and 18; 24, –82, and 20; and –40, –73, and 2), the right inferior parietal lobule (Brodmann’s area 40: 31, –51, and 41), and the bilateral precentral frontal gyrus (Brodmann’s area 6; 42, 4, and 28; and –35, –2, and 35) ( Figure 1 ). A similar network of regions was observed for unsuccessful inhibition, including the bilateral insular and the ventrolateral prefrontal cortex regions (Brodmann’s area 13; 37, 13, and 12; and –34, 17, and 1), the anterior cingulate cortex (Brodmann’s area 32; 3, 20, and 32), the left inferior occipital gyrus (Brodmann’s area 19; –43, –73, and 0), and the right superior parietal lobule (Brodmann’s area 7; –29, –52, and 38). Direct comparisons between successful and unsuccessful inhibition trials did not result in any significant differences for children with ADHD ( Figure 1 ).
Functional Region-of-Interest Analysis
Four a priori regions of interest were defined by contrasting “stop” with “go” trials in all subjects. These regions included the anterior cingulate cortex (center of mass: 2, 24, 29; volume=2566 mm 3 ), the right dorsolateral prefrontal cortex (center of mass: 40, 24, 36; volume=458 mm 3 ), and the left (center of mass: –36, 18, 3; volume=1466 mm 3 ) and right (center of mass: 38, 17, 3; 2304 mm 3 ) ventrolateral prefrontal cortex or insular regions. Figure 2 and Table 2 show the proportion of signal change for each region of interest by group and trial type. Significant main effects for region of interest (F=6.48, df=3, 28, p<0.001) and trial type (F=4.47, df=1, 30, p=0.04) and a significant interaction of region of interest by trial type (F=5.92, df=3, 28, p<0.0001) indicated differences in proportional signal change between regions for successful and unsuccessful inhibition trials. Although the overall main effect for diagnosis was not significant (F=1.43, df=1, 30, p=0.24), significant interactions of group and region of interest (F=5.81, df=3, 28, p=0.002) and group by trial type (F=11.30, df=1, 30, p=0.002) suggested that children with ADHD show different levels of activation across regions and trial types.
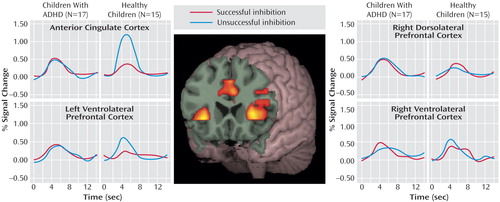
a Activation peaked between 4 and 6 seconds after trial onset for both groups, regardless of the trial type (successful or unsuccessful “stop” trials) or region of interest. Although the healthy children showed relatively more activity for unsuccessful “stop” trials within the anterior cingulate cortex and the left ventrolateral prefrontal cortex than for successful “stop” trials, the children with ADHD did not show differential activation patterns with unsuccessful inhibition in any region. The groups did not differ in the number of successful “stop” trials.

Within the anterior cingulate cortex, main effects of trial type (F=29.80, df=1, 30, p<0.0001) and diagnostic group (F=21.63, df=1, 30, p<0.0001) and an interaction of trial type by group (F=46.15, df=1, 30, p<0.0001) suggested that this region was differentially engaged for successful and unsuccessful inhibition in each group ( Figure 2 ). Although the children with ADHD showed relatively more activation in the anterior cingulate cortex for successful “stop” trials than the comparison subjects (mean=0.51, SD=0.18, versus mean=0.32, SD=0.20) (F=7.26, df=1, 30, p=0.01), they showed decreased activations in relation to comparison subjects during unsuccessful inhibitions (mean=0.42, SD=0.28, versus mean=1.12, SD=0.27) (F=48.80, df=1, 30, p<0.0001). Within-group subtraction scores indicated that in contrast to healthy children who showed significantly more activity in the anterior cingulate cortex for unsuccessful inhibition (mean=–0.80, SD=0.38) (t=–8.03, df=14, p<0.001), the children with ADHD did not differ between correct and incorrect trial types (mean=0.05, SD=0.34) (t=0.62, df=16, p=0.54) ( Figure 3 ).

a Although there was no difference between the groups with ADHD, previously treated children tended to be more similar to healthy children than treatment-naive patients, particularly in the anterior cingulate cortex.
Contrary to findings in adult subjects, there was no main effect of successful versus unsuccessful inhibition for right dorsolateral prefrontal cortex activity (F=0.32, df=1, 30, p=0.58). Although the subjects with ADHD showed relatively more activation in this region in relation to comparison subjects (F=4.83, df=1, 30, p=0.04), the lack of an interaction of group by trial type (F=0.48, df=1, 30, p=0.50) suggested that increased activity in the right dorsolateral prefrontal cortex in children with ADHD may not be specifically related to inhibitory processing ( Figure 2 ).
Neither the left nor the right ventral prefrontal regions statistically differed between groups (F=0.87, df=1, 30, p=0.40, and F=0.83, df=1, 30, p=0.40, respectively) or between trial types (F=3.05, df=1, 30, p=0.09, and F=0.03, df=1, 30, p=0.90, respectively). However, a significant interaction of group and trial type for the left ventrolateral prefrontal cortex (F=4.96, df=1,30, p=0.03) ( Figure 2 ) and a nearly significant interaction in the right ventrolateral prefrontal cortex (F=3.49, df=1, 30, p=0.07) ( Figure 2 ) suggested that children with ADHD employed these regions differently than comparison subjects. Within-subject subtraction scores indicated that although the healthy subjects showed relatively more activation for unsuccessful inhibition trials (left: mean=–0.39, SD=0.68) (t=–2.22, df=1, 14, p=0.04) (right: mean=–0.20, SD=0.60) (t=–1.28, df=1, 14, p=0.22), subjects with ADHD tended to activate these regions more for successful “stop” trials (left: mean=–0.05, SD=0.41) (t=0.47, df=1, 16, p=0.64) (right: mean=–0.17, SD=0.51) (t=–1.36, df=1, 16, p=0.19).
Previously Treated Versus Treatment-Naive Subjects With ADHD
The main effect for group did not reach significance (F=4.16, df=1, 15, p=0.06), suggesting that the level of activation in previously treated and treatment-naive children with ADHD was similar across regions. However, as can be seen in Table 2 , activation levels in previously treated and treatment-naive children with ADHD significantly differed in the anterior cingulate cortex region. Although the previously treated group showed similar levels of activation in the anterior cingulate cortex for successful and unsuccessful trials (mean=0.01, SD=0.45) (t=0.06, df=8, p=0.95), the treatment-naive group showed significantly more activation for successful than unsuccessful trials (mean=0.17, SD=0.19) (t=2.63, df=7, p=0.03), the opposite of healthy children ( Figure 3 ). Together these data suggest that long-term use of methylphenidate is not responsible for the aberrant activation patterns found when we compared ADHD and healthy children.
Discussion
Consistent with our hypothesis, activity in the anterior cingulate cortex differed in ADHD children relative to comparison subjects. The comparison subjects differentially activated the anterior cingulate cortex during unsuccessful inhibitions, whereas the subjects with ADHD did not. This difference was present in treatment-naive subjects and therefore cannot be attributed to the effects of past stimulant treatment. A similar lack of activation in the anterior cingulate cortex was previously reported in adult subjects with ADHD during a block design version of the Stroop Counting Task (32) . Similarly, Tamm et al. (13) found that adolescents with ADHD had reduced activation in the anterior cingulate cortex in relation to that in comparison subjects on “no-go” trials of the Go/No-Go Task. Using a modified Stroop task, Kerns et al. (33) found increased activity in the anterior cingulate cortex on error trials, and such activity correlated significantly with prefrontal cortex activity on subsequent trials. Taken together, these findings are consistent with the role of the anterior cingulate cortex in evaluative processes (4) and suggest that when ADHD subjects make an error or face conflict, the anterior cingulate cortex fails to adequately adjust cognitive control for the demands of the task.
Contrary to our hypothesis, both ADHD and comparison subjects had increased activation in the right dorsolateral prefrontal cortex on “stop” trials relative to “go” trials, and this increase was seen regardless of whether the subjects successfully inhibited their response or not. Our results contrast with findings in adults on the Stop Signal Task, in which increases in activity in the right dorsolateral prefrontal cortex were greater on successful inhibition trials (3) , as well as recent findings in adolescents (14) . Figure 2 does appear to show a slight tendency for comparison subjects to show more activation of the right dorsolateral prefrontal cortex on successful inhibitions. Specific activation of the right dorsolateral prefrontal cortex for successful inhibitions may emerge only later in adolescence. With a larger group, it will be possible to see if older subjects show greater differentiation of brain activation for successful versus unsuccessful inhibitions.
The healthy comparison subjects showed a differential increase in left ventrolateral prefrontal cortex activity on unsuccessful inhibitions; the subjects with ADHD did not show this pattern. Menon et al. (6) found that healthy adults also activated Brodmann’s area 47 after a response inhibition error and suggested that this region is part of an error-processing network. In nonhuman primates, distinct populations of neurons code for “go” and “no-go” stimuli; thus, the ventrolateral prefrontal cortex may attach behavioral meaning to the inhibitory stimulus (34) .
It is difficult to compare our study to previous fMRI studies of ADHD because earlier reports used a block design (12) , included children with the inattentive type of ADHD (8) , or involved adolescents with a childhood history of ADHD who no longer met the criteria for the disorder (9) . Using an event-related design, Rubia et al. (14) found that adolescents with ADHD had less differential activation of the right inferior prefrontal cortex on successful inhibitions than comparison subjects. Event-related potential studies have shown that ADHD groups have a reduced N200 in response to the “stop” signal that occurs over the right frontal area (15) . Yet our fMRI study showed greater activity in ADHD subjects than comparison subjects in this region, consistent with previous studies (8 , 9) . What accounts for these differences? In previous block design studies, error trials were analyzed along with correct trials, and poor-performing ADHD subjects may have been included. The event-related potential technique is less sensitive to head movement or other motion artifacts, and testing can carry on for many more runs to obtain adequate numbers of trials even in poor-performing subjects. Thus, when poor-performing ADHD subjects are included, frontal activity may be decreased relative to that of comparison subjects because more impaired subjects may be included. In contrast, because fMRI requires such effort (especially in the event-related designs in which it is desirable that subject groups have adequate performance on the task), the most severely ill ADHD subjects were excluded from our study. Perhaps the ADHD subjects who can hold still and perform adequately must use extra effort, thus accounting for the increased frontal activity seen in this and other studies (8 , 9) . Alternately, the right frontal areas identified here may not be specific for response inhibition. Indeed, in a combined event-related potential and fMRI study, Garavan and colleagues (5) found that similar regions thought to be selective for successful inhibition were also engaged for unsuccessful inhibition, with relatively slower activation for unsuccessful trials. One ramification of these findings for fMRI design is that simply contrasting correct and incorrect “stop” trials may fail to detect brain regions engaged by both successful and unsuccessful inhibition even though the nature of the activation within the region may differ somewhat with inhibition success. Our finding, in conjunction with those of Rubia et al. (14) , highlights the need to investigate response inhibition with both imaging and electrophysiological processes.
Certain limitations of our study should be noted. The paradigm did not include a null event; thus, we could not analyze the effects of the “go” stimuli alone. The group that completed the imaging study was too small to allow analysis for effects of age or gender. Nonetheless, most studies now show a consistent picture of response inhibition involving the prefrontal cortex as well as the anterior cingulate cortex (5) . The right prefrontal cortex responds phasically to acute “stop” signals, and the anterior cingulate cortex modulates conflict produced by the task and responds to errors by enhancing cognitive control (33) . fMRI and event-related potential studies have suggested that children with ADHD appear to differ from comparison subjects at both nodes of this response inhibition network, although further studies are needed to determine the exact nature of the deficit.
1. Barkley RA: ADHD and the Nature of Self Control. New York, Guilford, 1997Google Scholar
2. Garavan H, Ross TJ, Stein EA: Right hemispheric dominance of inhibitory control: an event-related functional MRI study. Proc Natl Acad Sci USA 1999; 96:8301–8306Google Scholar
3. Rubia K, Smith AB, Brammer MJ, Taylor E: Right inferior prefrontal cortex mediates response inhibition while mesial prefrontal cortex is responsible for error detection. Neuroimage 2003; 20:351–358Google Scholar
4. MacDonald AW, Cohen JD, Stenger VA, Carter CS: Dissociating the role of the dorsolateral prefrontal and anterior cingulate cortex in cognitive control. Science 2000; 288:1835–1838Google Scholar
5. Garavan H, Ross TJ, Murphy K, Roche RAP, Stein EA: Dissociable executive functions in the dynamic control of behavior: inhibition, error detection, and correction. Neuroimage 2002; 17:1820–1829Google Scholar
6. Menon V, Adleman NE, White CD, Glover GH, Reiss AL: Error-related brain activation during a go/no-go response inhibition task. Hum Brain Mapp 2001; 12:131–143Google Scholar
7. Vaidya CJ, Austin G, Kirkorian G, Ridlehuber HW, Desmond JE, Glover GH, Gabrieli DE: Selective effects of methylphenidate in attention deficit hyperactivity disorder: a functional magnetic resonance study. Proc Natl Acad Sci USA 1998; 95:14494–14499Google Scholar
8. Durston S, Tottenham NT, Thomas KM, Davidson MC, Eigsti IM, Yang Y, Ulug AM, Casey BJ: Differential patterns of striatal activation in young children with and without ADHD. Biol Psychiatry 2003; 53:871–878Google Scholar
9. Schulz KP, Fan J, Tang CY, Newcorn JH, Buchsbaum MS, Cheung AM, Halperin JM: Response inhibition in adolescents diagnosed with attention deficit hyperactivity disorder during childhood: an event-related fMRI study. Am J Psychiatry 2004; 161:1650–1657Google Scholar
10. Schulz KP, Newcorn JH, Fan J, Tang CY, Halperin JM: Brain activation gradients in ventrolateral prefrontal cortex related to persistence of ADHD in adolescent boys. J Am Acad Child Adolesc Psychiatry 2005; 44:47–54Google Scholar
11. Smith JL, Johnstone SJ, Barry RJ: Inhibitory processing during the Go/No-Go Task: an ERP analysis of children with attention-deficit/hyperactivity disorder. Clin Neurophysiol 2004; 115:1320–1331Google Scholar
12. Rubia K, Overmeyer S, Taylor E, Brammer M, Williams SC, Simmons A, Bullmore ET: Hypofrontality in attention deficit hyperactivity disorder during higher-order motor control: a study with functional MRI. Am J Psychiatry 1999; 156:891–896Google Scholar
13. Tamm L, Menon V, Ringel J, Reiss AL: Event-related fMRI evidence of frontotemporal involvement in aberrant response inhibition and task switching in attention-deficit/hyperactivity disorder. J Am Acad Child Adolesc Psychiatry 2004; 43:1430–1440Google Scholar
14. Rubia K, Smith AB, Brammer MJ, Toone B, Taylor E: Abnormal brain activation during inhibition and error detection in medication-naive adolescents with ADHD. Am J Psychiatry 2005; 162:1067–1075Google Scholar
15. Pliszka SR, Liotti M, Woldorff MG: Inhibitory control in children with attention deficit/hyperactivity disorder: event related potentials identify the processing component and timing of an impaired right-frontal response-inhibition mechanism. Biol Psychiatry 2000; 48:238–246Google Scholar
16. Langleben DD, Acton PD, Austin G, Elman I, Krikorian G, Monterosso JR, Portnoy O, Ridlehuber HW, Strauss HW: Effects of methylphenidate discontinuation on cerebral blood flow in prepubescent boys with attention deficit hyperactivity disorder. J Nucl Med 2002; 43:1624–1629Google Scholar
17. Barkley RA: International Consensus Statement on ADHD, Jan 2002. Clin Child Fam Psychol Rev 2002; 5:89–111Google Scholar
18. Shaffer D, Fisher P, Lucas CP, Dulcan MK, Schwab-Stone ME: NIMH Diagnostic Interview Schedule for Children, Version IV (NIMH DISC-IV): description, differences from previous versions, and reliability of some common diagnoses. J Am Acad Child Adolesc Psychiatry 2000; 39:28–38Google Scholar
19. Conners CK: Conners’ Rating Scales–Revised. Toronto, Multi-Health Systems, 1997Google Scholar
20. Elliot CD: Administration and Scoring Manual for the Differential Ability Scales (DAS). San Antonio, Tex, Psychological Corp, 1990Google Scholar
21. Wechsler Individual Achievement Test, 2nd ed. San Antonio, Tex, Psychological Corp, 2002Google Scholar
22. Logan GD, Cowan WB, Davis KA: On the ability of inhibit simple and choice reaction time responses: a model and a method. J Exp Psychol Human Percept Perform 1984; 10:276–291Google Scholar
23. Smith SM, Jenkinson M, Woolrich MW, Beckmann CF, Behrens TEJ, Johansen-Berg H, Bannister PR, De Luca M, Drobnjak I, Flitney DE: Advances in functional and structural MR image analysis and implementation as FSL. Neuroimage 2004; 23:S208–S219Google Scholar
24. Jenkinson M, Bannister P, Brady M, Smith S: Improved optimization for the robust and accurate linear registration and motion correction of brain images. Neuroimage 2002; 17:825–841Google Scholar
25. Smith SM, Brady JM: Susan: a new approach to low level image processing. Int J Comput Vision 1997; 23:45–78Google Scholar
26. Woolrich MW, Ripley BD, Brady M, Smith SM: Temporal autocorrelation in univariate linear modeling of fMRI data. Neuroimage 2001; 14:1370–1386Google Scholar
27. Talairach J, Tournoux P: Co-Planar Stereotaxic Atlas of the Human Brain 3-Dimensional Proportional System: An Approach to Cerebral Imaging. New York, Thieme Medical, 1988Google Scholar
28. Woolrich MW, Behrens TE, Beckman CF, Jenkinson M, Smith SM: Multilevel linear modelling for FMRI group analysis using Bayesian inference. Neuroimage 2004; 21:1732–1747Google Scholar
29. Poline JB, Worsley KJ, Evans AC, Friston KJ: Combining spatial extent and peak intensity to test for activations in functional imaging. Neuroimage 1997; 5:83–96Google Scholar
30. Forman SD, Cohen JD, Fitzgerald M, Eddy WF, Mintun MA, Noll DC: Improved assessment of significant activation in functional magnetic resonance imaging (fMRI): use of a cluster-size threshold. Magn Reson Med 1995; 33:636–647Google Scholar
31. Boynton GM, Engel SA, Glover GH, Heeger DJ: Linear systems analysis of functional magnetic resonance imaging in human V1. J Neurosci 1996; 16:4207–4221Google Scholar
32. Bush G, Frazier JA, Rauch SL, Seidman LJ, Whalen PJ, Jenike MA, Rosen BR, Biederman J: Anterior cingulate cortex dysfunction in attention-deficit/hyperactivity disorder revealed by fMRI and the counting Stroop. Biol Psychiatry 1999; 45:1542–1552Google Scholar
33. Kerns JG, Cohen JD, MacDonald AW III, Cho RY, Stenger VA, Carter CS: Anterior cingulate conflict monitoring and adjustments in control. Science 2004; 303:1023–1026Google Scholar
34. Sakagami M, Tsutsui K, Lauwereyns J, Koizumi M, Kobayashi S, Hikosaka O: A code for behavioral inhibition on the basis of color, but not motion, in ventrolateral prefrontal cortex of macaque monkey. J Neurosci 2001; 21:4801–4808Google Scholar