Reduced Relationship to Cortical White Matter Volume Revealed by Tractography-Based Segmentation of the Corpus Callosum in Young Children With Developmental Delay
Abstract
Objective: The corpus callosum is the primary anatomical substrate for interhemispheric communication, which is important for a range of adaptive and cognitive behaviors in early development. Previous studies that have measured the corpus callosum in developmental populations have been limited by the use of rather arbitrary methods of subdividing the corpus callosum. The purpose of this study was to measure the corpus callosum in a clinical group of developmentally delayed children using a subdivision that more accurately reflected the anatomical properties of the corpus callosum. Method: The authors applied tractography to subdivide the corpus callosum into regions corresponding to the cortical regions to and from which its fibers travel in a clinical group of very young children with developmental delay, a precursor to general mental retardation, in comparison with typically developing children. Results: The data demonstrate that the midsagittal area of the entire corpus callosum is reduced in children presenting with developmental delay, reflected in the smaller area of each of the fiber-based callosal subdivisions. In addition, while the area of each subdivision was strongly and significantly correlated with the corresponding cortical white matter volume in comparison subjects, this correlation was prominently absent in the developmentally delayed group. Conclusions: A fiber-based subdivision successfully separates lobar regions of the corpus callosum, and the areas of these regions distinguish a developmentally delayed clinical group from the comparison group. This distinction was evident both in the area measurements themselves and in their correlation to the white matter volumes of the corresponding cortical lobes.
The corpus callosum is the largest commissural fiber tract in the brain and serves to connect homologous cortical regions between the two hemispheres. This fiber tract is considered the most important anatomical substrate for interhemispheric communication, which is crucial for a range of human behaviors from motor skills, such as bimanual coordination, to cognitive skills, such as visual attention and reading. The anatomical and functional integrity of this group of pathways that relay information from cortical areas to their contralateral homologues critically affects the development of these and other behaviors.
Developmental studies have established that the corpus callosum has an extended growth trajectory that continues throughout childhood and adolescence. Cross-sectional as well as longitudinal studies indicate that the size of the corpus callosum increases dramatically in the first 2 years after birth (1) and continues to increase substantially throughout childhood and adolescence (2 – 4) . Development appears to follow an anterior-posterior trajectory, with size increasing earlier in the more anterior regions of the corpus callosum, and later in the more posterior regions (5) . It is interesting to note that this is the inverse of the well-known posterior-anterior pattern of development in the cerebral cortex.
Developmental delay is a diagnosis given to very young children who perform below the average range on tests of adaptive behavior. This poor performance is often a precursor to a diagnosis of mental retardation at an older age, when IQ can be reliably assessed. Developmental delay can be associated with a specific syndrome, such as Fragile X, or can be nonsyndromic and thus considered to be of polygenic or epigenetic origin.
The neuroanatomical substrates of developmental delay have yet to be elucidated. The corpus callosum is a viable candidate as a contributor to generalized developmental delay, since a compromise in interhemispheric communication would have global effects on a range of adaptive behaviors. Differences in overall corpus callosum size or variability of corpus callosum size have been observed in clinical groups of children with a variety of disorders of which developmental delay is a feature (1 , 6 – 10) , but the results have been mixed and difficult to interpret. Additionally, differences in corpus callosum size have been demonstrated in syndromic groups that do not have associated developmental delay/mental retardation, such as high-functioning autism (11 , 12) . Only one study has included a clinical group of children with nonsyndromic developmental delay (1) . In addition to global measurement of the entire corpus callosum, many of these studies have achieved a degree of anatomical specificity by dividing the midsagittal corpus callosum area into smaller units and measuring those subregions separately.
The most common method used to divide the corpus callosum into subregions is the Witelson method (13) . This method divides the corpus callosum into seven subregions with an initial division into anterior and posterior halves and subsequent divisions determined by further geometric ratios or anatomical landmarks in the curve of the structure ( Figure 1 [top]). The subdivisions are generally thought to correspond roughly to cortical regions to which their fibers project, but the accuracy of such an assumption is dubious given the fairly arbitrary, geometric nature of the subdivision method.
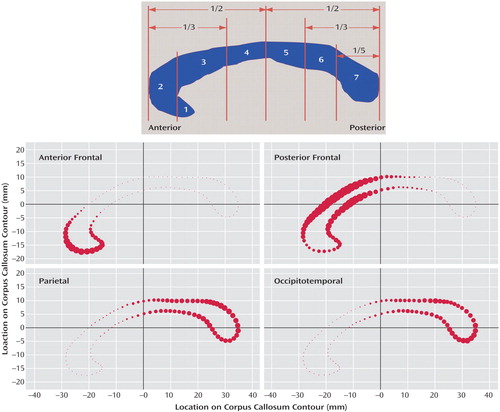
a The midsagittal corpus callosum is bounded and divided into halves. The bounding box is then divided into thirds. These two divisions create subregions 2–5. Subregions 6 and 7 are created by dividing the bounding box into fifths; area 7 is the posterior-most fifth of the structure. Subregion 1 is separated from subregion 2 by a vertical line placed flush with the curve of the genu. (Adapted from Witelson, 1989) (top). Size and brightness of each point along the corpus callosum contour represents the probability of its assignment to the given lobar subdivision (average of six representative cases) (bottom).
Diffusion tensor imaging can be used to predict probable fiber trajectories in white matter tracts such as the corpus callosum. This technique, called tractography, produces a representation of the most probable trajectories and concentration of white matter fibers connecting two regions of interest. Recently, it has been demonstrated that tractography can be used as a tool to subdivide the midsagittal corpus callosum according to the cortical targets of its fibers (14 – 16) . This type of subdivision separates the corpus callosum into more physiologically relevant components than geometric subdivisions, such as the Witelson method, and allows the subdivisions more potential to be interpreted in light of behaviors associated with their different cortical regions.
In this study, we use this novel tractography-based method to subdivide the corpus callosum. Rather than using subjective, artificially imposed boundaries as in the Witelson method ( Figure 1 [top]), our method segments the corpus callosum into truly anatomically relevant regions by using fibers from cortical targets as guides for making divisions. Additionally, instead of hard boundaries, our method uses a probabilistic subdivision that is better suited for a functionally heterogeneous structure such as the corpus callosum (16) . In this study, our goal was to use this technique to compare a group of children with generalized developmental delay to a comparison group on the following variables: midsagittal callosal area, area of four fiber-derived callosal subregions, and correlation between the areas of subregions to the corresponding lobe white matter volumes.
Method
Subjects
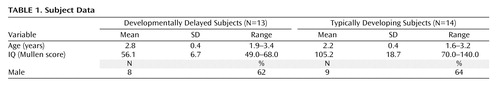
Thirteen children aged 18–40 months with general developmental delay were included. This group represents children who are likely to be diagnosed with nonsyndromic mental retardation at an age when IQ can be reliably assessed. Fourteen age-matched, typically developing comparison children were also included. The developmentally delayed group was recruited from selected regional state Children’s Developmental Services Agencies. Typically developing children were recruited from community advertisements. All developmental delay subjects had a diagnosis of developmental delay and were identified on the basis of Children’s Developmental Services Agencies evaluation scores. Their Children’s Developmental Services Agencies and medical records were screened to ensure that there was no identifiable cause for their delay (e.g., prematurity, genetic or neurological disorder, CNS injury, perinatal trauma) and had no indication of a pervasive developmental disorder or a sibling with autism. This medical record screening was supplemented with a telephone screening interview administered to the parents. Study approval was acquired from the University of North Carolina and Duke Institutional Review Boards, and written informed consent was obtained from the parent or guardian of each subject. Descriptive statistics can be found in Table 1 .
Clinical Assessment
All subjects were administered a battery of measures, including the Mullen Scales of Early Learning (17) , the Vineland Adaptive Behavior Scales (18) , Preschool Language Scale, 4th edition (19) , behavioral rating scales, and a standardized neurodevelopmental examination, and screened for autism with the Childhood Autism Rating Scale (20) . Medical records were reviewed in order to screen for indication of pervasive developmental disorder. Diagnosis of developmental delay was confirmed using the Mullen Scales of Early Learning and the Vineland Adaptive Behavior Scale; subjects scoring <75 on both instruments were included.
Image Acquisition
All scans were acquired on a 1.5 T GE Sigma Advantage MR scanner. The T1-weighted structural images were acquired using a three-dimensional inversion recovery prepped spoiled gradient recalled protocol with a 256×256×124 image matrix at 0.78125×0.78125 x1.5 mm resolution. Diffusion tensor imaging was acquired using four repetitions of a 12-direction spin-echo single-shot echo planar imaging sequence with a 128×128×30 image matrix at 2×2×4 mm resolution using a b-value of 1000 s/mm 2 . Total scan time was approximately 45 minutes. Typically developing children were scanned at night while sleeping; developmental delay children were sedated for the scan following the standard pediatric sedation protocol at the hospital under the supervision of a pediatric anesthesiologist.
Diffusion Tensor Imaging Preprocessing
Each diffusion tensor imaging slice was screened for motion and other artifacts using a custom software program designed to automatically detect and handle slices or shots that fall outside predetermined parameters. After cleaning, both the correction of eddy-current-based image distortions using mutual information-based unwarping and the calculation of the diffusion tensor elements, as well as metrics and the eigensystem (i.e., eigenvectors and values) derived from them, were performed using another customized software package. The tensor parameters derived from this step were used in our tractography program to compute fiber maps (21) .
Segmentation of the Corpus Callosum From Surrounding Brain Tissue
The corpus callosa were segmented from the T1-weighted structural image with the in-house developed corpus callosum segmentation tool using a using a two-dimensional Fourier descriptor-based active shape model segmentation (22) . Based on a prior automatic tissue segmentation, the initial values for position, scale, and grayscale normalization were computed automatically. From these initial values, the corpus callosum segmentation was performed in the following two steps: first using a fully constrained corpus callosum model contour segmentation in a large search region, second using an unconstrained contour segmentation in a smaller search region. During each step a corpus callosum contour model is adapted iteratively until convergence. This segmentation scheme establishes a point-to-point correspondence at the contour between all segmented corpus callosa. It is fully automatic and 100% reproducible. In an additional stability study, the coefficient of variance of the segmented corpus callosum area across different images of the same subject on different scanners (23) was measured at 2.7%. That study thus confirmed the high stability and reliability of our segmentation scheme.
Creation of Subdivision Template Using Tractography
The T1-weighted anatomical images of five subjects, selected from our clinical group on the basis of image quality, were parcellated into four cortical lobes: occipital, parietal, temporal, and frontal. Subjects from both groups were included in the template generation group. Using the left and right lobes of the parcellation maps for these cases as regions of interest, probable fiber trajectories were traced (using an automated, locally developed tractography program) between the midsagittal plane of the corpus callosum (source) and the lobar regions of interests (targets). Thus, we divided the corpus callosum into four segments defined by the fibers that projected to each of the four lobes. Because a very small number of fibers projected to the temporal and occipital lobes in our images and because there was a good deal of overlap between them, fibers from the occipital lobe were combined with fibers from the temporal lobe to result in one occipitotemporal corpus callosum subdivision. Conversely, because a very large number of fibers were found that projected to the frontal lobe, fibers from the frontal lobe were manually divided into those coming from the anterior and posterior frontal lobe to result in an anterior frontal and a posterior frontal corpus callosum subdivision (see Figure 2 [left]). Based on these four fiber maps ( Figure 2 [right]), a probabilistic corpus callosum subdivision model was computed automatically. Each point of the contour of the corpus callosum was assigned a probability of belonging to each of the four subdivisions using the closest distances to produce the final subdivision template. The probabilistic subdivision used is contrasted to a hard subdivision by its assignment of multiple labels with probabilistic weights to each point rather than a forced assignment of each point to a single label. This is ideal for the corpus callosum because of the spatial overlap of its commissural pathways.
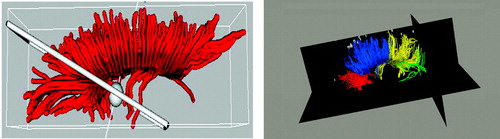
a A plane was rotated manually to divide the frontal fibers into the smaller group of more anteriorly-projecting fibers and the larger group of more posterior/superiorly-projecting fibers (left). Fibers traced from corpus callosum for template using frontal, parietal, and occipital temporal volumes as regions of interests. The frontal fibers were split manually into anterior (red) and posterior (blue). Parietal fibers shown in yellow; occipital temporal fibers in green. The corpus callosum areas under these fibers for five cases were then used as a template to apply to the rest of the group for subdivision of the corpus callosum (right).
Corpus Callosum Subdivision by Application of Template to Remainder of Study Group
The corpus callosa of the remaining subjects were subdivided using this template (16) . The subdivision was propagated to each corpus callosum contour using the template’s point-to-point correspondence with the corpus callosum segmentations. The probability of each point within the corpus callosum belonging to a certain subdivision was then computed as that of its nearest contour point. Corpus callosa subdivided with the template are illustrated in Figure 1 (bottom). The resulting areas of each of the four corpus callosum subregions were measured and added together to produce the total corpus callosum area. The volumes of the total brain, total gray tissue, total white tissue, and each of the four cortical lobes had been previously measured (24) and were used in the analyses to determine the relationships between the corpus callosum, its fiber-based subdivisions, and the cortical lobes.
Statistics
A mixed model for repeated measures was used to examine group differences in corpus callosum size. Each subject had four observations, one per subarea of the corpus callosum. An unstructured covariance matrix was used to estimate the within-subject correlations. This allowed each corpus callosum subarea to have a freely estimated variance and covariance with the other observations. Group, age, gender, corpus callosum region, and group-by-corpus-callosum region interaction were entered into the regression model on the corpus callosum area. Total brain volume was added as a covariate. The regression coefficient for the group indicates the mean difference between developmental delay and typically developing subjects, while the group-by-corpus-callosum region interaction tests whether this difference varies significantly across regions. An estimate of the group difference in total corpus callosum size was evaluated based on the estimates for the four subareas.
In order to examine differences in the correlation between the corpus callosum area and total brain volume and cerebral white matter volumes, partial correlations between the corpus callosum area and total brain volume and cerebral white matter volumes, controlling for age and gender, were estimated for both typically developing and developmental delay subjects. As a follow-up analysis to evaluate possible regional differences in the relationship between the corpus callosum area and white matter volume, the partial correlations between the corpus callosum subarea and the corresponding regional white matter volume were estimated for each group.
Results
Table 2 presents the differences in the corpus callosum area between the developmental delayed subjects and the comparison subjects. The midsagittal area of the full corpus callosum was significantly smaller in the developmentally delayed group than in the comparison group (Diff=–0.50, p=0.011). Additionally, each of the four fiber-based subdivisions of the corpus callosum (anterior frontal, posterior frontal, occipitotemporal, and parietal) was smaller in the developmentally delayed group than the comparison group. This difference remained after adjusting for group differences in total brain volume ( Table 3 ).
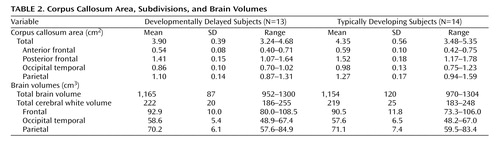
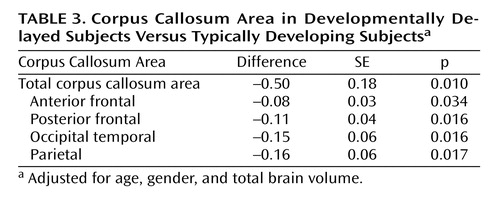
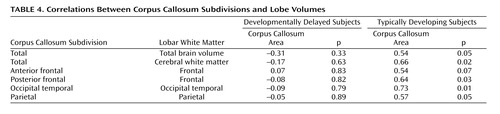
Table 4 presents the correlations between corpus callosum subareas and total brain volume and total white tissue. Analyses were focused on white tissue, since there was a stronger relationship expected between corpus callosum area and cerebral white tissue. For the comparison group, the area of the corpus callosum was significantly correlated with total white tissue volume. The developmentally delayed group showed no evidence of correlations between the corpus callosum area and total brain volume or total white tissue volume. Figure 3 shows the raw data and the mean tendency between the total corpus callosum area and total white matter volume.
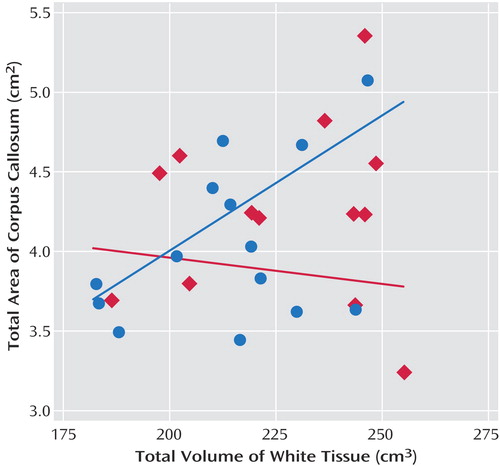
a Relationship between total white tissue volume and total corpus callosum area for the developmentally delayed group (red) and the comparison group (blue).
Follow-up analyses examined the relationship between the subareas of the corpus callosum and their corresponding white matter lobe volumes ( Table 4 ). The areas of the corpus callosum subdivisions and their corresponding lobar white matter volumes were strongly and significantly correlated in the typically developing group at the p≤0.05 level ( Table 4 ), but not in the developmentally delayed group.
Discussion
We have shown that nonspecific developmental delay is associated with robust abnormalities in the corpus callosum. We demonstrate reduced midsagittal corpus callosum area in developmental delay and strikingly reduced correlations between corpus callosum subdivision areas and their corresponding cortical lobe volumes. In the comparison group, the area of each fiber-based corpus callosum subregion was significantly positively correlated with the volume of white matter in its corresponding lobe. There is a remarkable lack of such significant relationships in the developmentally delayed group. This suggests an anatomical nonspecificity in developmental delay, i.e., there may be a disconnection between the fibers in the corpus callosum and the cortical lobes between which they travel. Such nonspecificity may serve to render interhemispheric connections less efficient. The combination of reduced interhemispheric connection as evidenced by the reduced corpus callosum area and this nonspecificity between the corpus callosum subareas and their cortical targets could create a drastically reduced substrate for information transfer between hemispheres.
Our area results are consistent with those of Njiokiktjien et al. (1) , who demonstrated reduced callosal size in severe learning disability/mental retardation. This smaller area was regionally nonspecific: each of the four fiber-based corpus callosum subdivisions was consistently smaller in the developmentally delayed group. This is in contrast to previous studies of children whose delay was of a specific, known etiology, in which area differences were concentrated in particular regions of the corpus callosum. For example, Schmitt et al. (9) and Tomaiuolo et al. (10) both found a greater reduction of corpus callosum area in the posterior half of the structure in Williams syndrome. This is consistent with the visual spatial deficits seen in this disorder, since visual spatial processing is largely mediated by posterior cortex in the occipital and parietal lobes. Similarly, the Preis et al. (7) study of developmental language disorder, although demonstrating no significant differences, revealed a tendency toward altered anterior corpus callosum area, corresponding to the frontal and anterior temporal cortices that mediate language processing.
In addition, these data validate the method of using tractography to subdivide the corpus callosum. This is a novel method, and we submit that is of considerable value in adding to and improving the vast literature on the corpus callosum and providing a more physiologically meaningful way to subdivide it. In addition, the method is more stable than previous methods in that it is automatically rather than manually applied and probabilistic rather than hard-decision based. It is noteworthy that this new method was successfully used to distinguish a clinical group from a comparison group in a way that was fairly dramatic, especially considering the relatively small size of our study group.
This small clinical group size is one of the primary limitations of this study. Developmental delay without a genetic or otherwise identifiable etiology is relatively rare, and this limits both the power of the study and our ability to extrapolate the results to other clinical groups that exhibit mental retardation. Another significant limitation is the difficulty in assessing cognitive ability reliably in such young children. This highlights the importance of replication at older ages.
Future directions will include repeating this analysis in the same group at a time point 2 years after their initial assessment, as part of an ongoing longitudinal study, to determine the trajectory of corpus callosum development in developmentally delayed children relative to healthy comparison children. The deficits characterized as delay in our young clinical group are likely to be precursors to mental retardation, which will be more clearly manifest and more easily measured when the children are older. In addition, at the time of follow-up it would be of significant benefit to conduct an age-appropriate battery of tests for functional laterality (i.e., handedness, dichotic listening, etc.) in this group. The addition of these data would be valuable in assessing the relationship between anatomical abnormalities in the corpus callosum and the behavioral and cognitive profiles with which they are associated in developmental delay/mental retardation. It would be of great interest to conduct some of these laterality tests using functional magnetic resonance imaging (fMRI) to assess any differences in related neural activity, although even with the best training methods available this would most likely have to be done with an older population. The disconnection we demonstrate between corpus callosum fibers and their cortical targets may not be specific to the corpus callosum. It may simply be an index of a more general disconnection of projecting axons in the brains of delayed individuals. It will be important to use other applications of diffusion tensor imaging in combination with structural MRI to elucidate the relationships between other groups of projecting axons and their targets in the brains of this group of children with developmental delay. Finally, although the methodology we used in this study is not adequate to determine whether the differences in corpus callosum area can be attributed to fewer fibers, less myelination, or smaller fiber diameter, it would be extremely instructive to devise experiments to begin to distinguish between these possibilities.
1. Njiokiktjien C, de Sonneville L, Vaal J: Callosal size in children with learning disabilities. Beh Brain Res 1994; 64:213–218Google Scholar
2. Giedd JN, Rumsey JM, Castellanos FX, Rajapakse JC, Kaysen D, Vaituzis AC, Vauss YC, Hamburger SD, Rapoport JL: A quantitative MRI study of the corpus callosum in children and adolescents. Develop Brain Res 1996; 91:274–280Google Scholar
3. Giedd JN, Blumenthal J, Jeffries NO, Rajapakse JC, Vaituzis AC, Liu H, Berry YC, Tobin M, Nelson J, Castellanos FZ: Development of the human corpus callosum during childhood and adolescence: a longitudinal MRI study. Progr Neuopsychopharmacol Biol Psychiatry 1999; 23:571–588Google Scholar
4. Keshavan MS, Diwadkar VA, DeBellis M, Dick E, Kotwal R, Rosenberg DR, Sweeney JA, Minshew N, Pettegrew JW: Development of the corpus callosum in childhood, adolescence and early adulthood. Life Sci 2002; 70:1909–1922Google Scholar
5. Thompson PM, Giedd JN, Woods RP, MacDonald D, Evans AC, Toga AW: Growth patterns in the developing brain detected by using continuum mechanical tensor maps. Nature 2000; 404:190–192Google Scholar
6. Manes F, Piven J, Vranic D, Nanclares V, Plebst C, Starkstein SE: An MRI study of the corpus callosum and cerebellum in mentally retarded autistic individuals. J Neuropsychiatry Clin Neurosci 1999; 11:470–474Google Scholar
7. Preis S, Steinmetz H, Knorr U, Jancke L: Corpus callosum size in children with developmental language disorder. Cogn Brain Res 2000; 10:37–44Google Scholar
8. Shashi V, Muddasani S, Santos CC, Berry MN, Kwapil TR, Lewandowski E, Keshavan MS: Abnormalities of the corpus callosum in nonpsychotic children with chromosome 22q11 deletion syndrome. NeuroImage 2004; 21:1399–1406Google Scholar
9. Schmitt JE, Eliez S, Warsofsky IS, Bellugi U, Reiss AL: Corpus callosum morphology of Williams syndrome: relation to genetics and behavior. Developmental Med and Child Neurol 2001; 43:155–159Google Scholar
10. Tomaiuolo F, Di Paola M, Caravale B, Vicari S, Petrides M, Caltagirone C: Morphology and morphometry of the corpus callosum in Williams syndrome: A T1-weighted MRI study. Neuroreport 2002; 13:2281–2284Google Scholar
11. Piven J, Bailey J, Ranson BJ, Arndt SA: An MRI study of the corpus callosum in autism. Am J Psychiatry 1997; 154:1051–1056Google Scholar
12. Hardan AY, Minshew NJ, Keshavan MS: Corpus callosum size in autism. Neurology 2000; 55:1033–1036Google Scholar
13. Witelson SF: Hand and sex differences in the isthmus and genu of the human corpus callosum, a postmortem biological study. Brain 1989; 112:799–835Google Scholar
14. Abe O, Masutani Y, Aoki S, Yamasue H, Yamada H, Kasai K, Mori H, Hayashi N, Masumoto T, Ohtomo K: Topography of the human corpus callosum using diffusion tensor tractography. J Comp Assist Tomography 2004; 28:533–539Google Scholar
15. Huang H, Zhang J, Jiang H, Wakana S, Poetscher L, Miller MI, van Zijl PCM, Hillis AE, Wytic R, Mori S: DTI tractography based parcellation of white matter: application to the mid-sagittal morphology of corpus callosum. NeuroImage 2005; 26:195–205Google Scholar
16. Styner M, Smith RG, Cascio C, Oguz I, Jomier M: Corpus callosum subdivision based on a probabilistic model of Inter-hemispheric connectivity. Med Image Computing Comput Assist Intervent LNCS 2005; 3750:765–772Google Scholar
17. Mullen EM: Mullen Scales of Early Learning AGS Edition. American Guidance Service, Inc. 1995Google Scholar
18. Sparrow SS, Balla DA, Cicche HV: Vineland Adaptive Behavior Scales-Interview Edition Survey Form Manual. Circle Pines, American Guidance Service, Inc., 1984Google Scholar
19. Zimmerman IL, Steiner VG, Pond RE: Preschool Language Scale-4th edition (PLS-IV). San Antonio, Psychological Corporation, 2002Google Scholar
20. Mesibov GB, Schopler E, Schaffer B, Michal N: Use of the Childhood Autism Rating Scale with autistic adolescents and adults. J Am Acad Child Adolesc Psychiatry 1989; 28:538–541Google Scholar
21. Fillard P, Gilmore J, Lin W, Piven J, Gerig G: Quantitative analysis of white matter fiber properties along geodesic paths. Lecture Notes in Computer Science LNCS #2879, Medical Image Computing and Computer Assisted Interventions 2003, pp 16–23Google Scholar
22. Szekely G, Kelemen A, Brechbuhler C, Gerig G: Segmentation of 2-D and 3-D objects from MRI volume data using constrained elastic deformations of flexible fourier contour and surface models. Med Imag Analy 1996; 1:19–34Google Scholar
23. Styner M, Charles HC, Park J, Lieberman J, Gerig G: Multi-site validation of image analysis methods: assessing intra and inter-site variability. SPIE Med Imaging 2002: Image Process 2002; 4684:278–286Google Scholar
24. Hazlett HC, Poe MD, Gerig G, Smith RG, Provenzale J, Ross A, Gilmore JH, Piven J: An MRI and head circumference study of brain size in autism: birth through age two years. Arch Gen Psychiatry (in press)Google Scholar