No Effect of Depression on [15O]H2O PET Response to Intravenous d-Fenfluramine
Abstract
Objective: Subnormal prolactin responses to the serotonin-releasing agonist fenfluramine occur in depression. Since many measures of serotonin pathology occur in depression, abnormal responses to fenfluramine may occur in brain structures other than the hypothalamic-pituitary axis. One study compared six depressed and six healthy subjects’ responses to oral d,l-fenfluramine by assessing [18F]fluorodeoxyglucose uptake as detected by positron emission tomography (PET). That study showed several abnormalities within the cortex, and the authors concluded that low responsivity to d,l-fenfluramine is widespread in depression. In this study abnormalities in regional neuromodulation by serotonin in major depression were assessed with intravenous d-fenfluramine and [15O]H2O PET. Method: Changes in regional cerebral blood flow (CBF) were detected by using [15O]H2O PET after administration of intravenous d-fenfluramine to 13 depressed and 18 healthy women. The PET scans were done 20 and 5 minutes before and 20 and 35 minutes after d-fenfluramine administration. Differences between the depressed and healthy groups in change in regional CBF (mean postfenfluramine minus mean prefenfluramine) were analyzed by using statistical parametric mapping.Results: There were no significant differences between depressed and healthy subjects; in fact, changes in regional CBF after intravenous d-fenfluramine were remarkably similar.Conclusions: Degrees of neuronal responsivity to d-fenfluramine are similar in depressed and healthy subjects. Differences between the previous and current findings may be accounted for by greater specificity of intravenous d-fenfluramine to serotonin release, timing of scans, paucity of suicidal subjects in the current study, or greater variance in regional CBF from direct vascular effects of serotonin. Am J Psychiatry 1998; 155: 1241-1246
There is significant evidence implicating low brain serotonin turnover in the pathophysiology of depression. Brain uptake of the serotonin precursor 5-hydroxytryptophan is low during depression (1). Depletion of the serotonin precursor tryptophan induces recurrence of sad mood in treated depressed subjects (2). The serotonin metabolite 5-hydroxyindoleacetic acid in cerebrospinal fluid is often low in depression (3). These measures could reflect low serotonin turnover in specific brain regions or a more generalized hyposerotonergic state.
Measures of serotonin (5-HT) receptor binding are one approach to detecting focal changes; however, results are inconsistent. The best-replicated finding, greater than normal 5-HT2 binding within the frontal cortex, was found in fewer than one-half (4, 5) of such studies (4-10). Furthermore, the laterality of this finding has not been well replicated: D’haenen et al. (7) found a high ratio of right to left frontal cortex 5-HT2 binding, but Yates et al. (4) reported greater than normal 5-HT2 binding in the left frontal cortex.
The endpoint of low prolactin response to oral d,l-fenfluramine (a serotonin-releasing agent [11, 12]) in depression (13-16) is a common finding that may reflect serotonin-based pathology. Since whole-brain measures and some receptor studies also have shown serotonin-based abnormalities, it is likely that brain regions other than the hypothalamic-pituitary axis respond differently to fenfluramine in depression. Such structures have a high potential for being pathophysiologically linked to depression.
The response of other brain structures to fenfluramine can be assessed by detecting changes in regional cerebral blood flow (CBF) or regional glucose uptake by means of positron emission tomography (PET) (17-20). Scanning with [18F]fluorodeoxyglucose (FDG) PET after administration of oral d,l-fenfluramine, as compared to placebo, has been reported to be a valid method in at least two centers (17, 20). Several changes were subsequently introduced to improve this method: intravenous administration, use of the more specific d- form of fenfluramine (11, 12), and a one-session format with [15O]H2O PET scans before and after injection (18).
The older version of this technique ([18F]FDG PET with oral d,l-fenfluramine) was applied by Mann et al. (19) to six depressed and six healthy subjects. Relative to global FDG uptake, increases in the left parietal-temporal cortex and the left medial frontal cortex and decreases in the right prefrontal cortex and the right parietal-temporal cortex were seen in the healthy subjects but not in the depressed patients. Mann et al. (19) concluded that serotonin neuromodulation is lower than normal throughout the brains of depressed persons.
Using the improved approach—intravenous d-fenfluramine with [15O]H2O PET—with more subjects and more rigorous subject selection, we retested the theory of a generalized hyposerotonergic state in depression. We hypothesized that there are specific brain regions with abnormal responses to fenfluramine. The same differences previously reported by Mann et al. (19), between depressed and healthy subjects, should occur in the current study. Intravenous d-fenfluramine should have localized effects on healthy subjects (18) but none in the depressed group.
METHOD
This study was approved by the review committee on the use of human subjects at the University of Toronto. The subjects were 13 depressed and 18 healthy women aged 18 to 30 years who were recruited by advertisement. All were physically healthy, right-handed, nonsmoking, and not pregnant. All of them had been free of drugs (including psychotropic drugs) for the previous 6 weeks. The depressed subjects had been free of psychotropic medication for at least 3 months (see the following). After complete description of the study to the subjects, written informed consent was obtained.
The first eight healthy subjects have been previously described (18). The remaining healthy subjects were similarly screened by using the Structured Clinical Interview for DSM-IV (SCID) (21) and the Hamilton Depression Rating Scale (22). A score of less than 8 on the Hamilton scale was required for entry of the healthy subjects into the study.
For each depressed patient, a diagnosis of a major depressive episode was confirmed by the SCID, which was administered by a trained research assistant. Patients with psychotic symptoms or comorbid axis I diagnoses were excluded from the study. Ten subjects had a diagnosis of major depressive disorder, and three subjects had a diagnosis of bipolar disorder, type II. Only one depressed subject, with bipolar disorder, had ever completed a 6-week trial of an antidepressant. This subject had been free of psychotropic drugs for 3 months. One subject, with major depressive episode, had a history of a previous deliberate suicide attempt. In addition, each patient received a psychiatric consultation (J.H.M., S.K., or G.M.B.). A score of greater than 17 on the Hamilton Depression Rating Scale was required for entry into the study. Each depressed subject had routine tests to rule out common medical causes of depression (thyroid function, electrolytes, complete blood cell count).
On the scan day, 0.3 mg/kg of intravenous d-fenfluramine was administered over 3 minutes. [15O]H2O PET measurements of regional CBF were done 20 and 5 minutes before the d-fenfluramine injection and 20 and 35 minutes afterward. The latter two times coincide with the peak cortisol response to intravenous d-fenfluramine (18). Blood samples for determination of serum cortisol levels were drawn at –25, –10, 15, 30, 45, 60, and 75 minutes.
PET scanning was carried out with a GEMS-Scanditronix PC-2048 15B head scanner. Each subject received a bolus intravenously of 60 mCi of [15O]H2O. Data acquisition began when the activity threshold exceeded 8,000 counts per second, which is approximately 30 seconds after the bolus. Data were taken in one 60-second frame for each scan. A 68Ge transmission scan was used to correct attenuation.
To standardize cognitive activity, the subjects did a continuous performance task during scanning (18, 23). To maximize the reliability of the task-related activation, the continuous performance task began 20 seconds before the bolus (24).
The PET scans were assessed with Statistical Parametric Mapping software, version 1995 (25-28). The threshold for each voxel was set at p=0.001. This threshold does not account for multiple comparisons. To correct for multiple comparisons, regional changes were considered significant only if both the spatial extent of suprathreshold voxels and the corrected peak voxel were significant (p<0.01 for each) (25).
RESULTS
The mean ages of the patients and healthy subjects were 25.1 and 25.7 years, respectively; the difference was not significant (t=0.39, df=29, p=0.70). The mean scores on the Hamilton Depression Rating Scale of the patients and healthy subjects, respectively, were 22.3 (SD=4.4) and 1.4 (SD=1.9); this difference was significant (Satterthwaite’s method, t=16.58, df=8, p<0.0001). Three of the healthy subjects and four depressed subjects were in the luteal phase of the menstrual cycle, and the remaining subjects were in the follicular phase (Fisher’s exact test, p=0.45, n.s.).
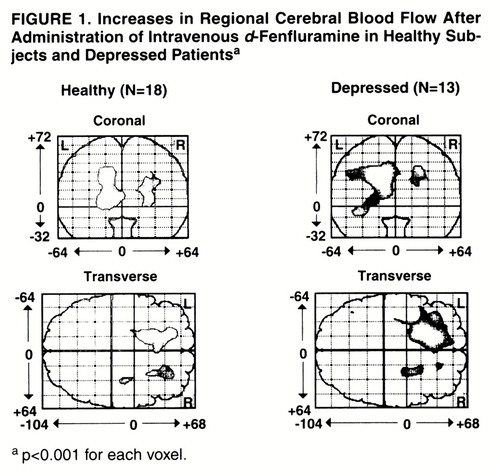
Change in regional CBF was defined as the mean of the values for the last two scans minus the mean of the values for the first two scans. With statistical parametric mapping (25-28), increases in regional CBF (relative to change in the whole brain) in the healthy and depressed subjects were found (figure 1). In the healthy subjects, relatively increased activity was found bilaterally in the medial frontal cortex both superiorly and inferiorly. For the left frontal cortex, the peak Talairach and Tournoux coordinates (29), z score, number of 2×2×4-mm voxels, p value for number of voxels by chance alone, and p value for peak voxel change were as follows: x=–14, y=18, z=32; z score=5.41; N=894; p<0.001; p<0.001. For the right frontal cortex, the respective values were as follows: x=24, y=22, z=24; z score=4.92; N=298; p=0.02; p=0.001. In the depressed subjects, relatively increased activity was found primarily in the left medial frontal cortex both superiorly and inferiorly. The peak coordinates, z score, number of voxels, p value for peak voxel change, and p value for this number of voxels were the following: x=–18, y=16, z=32; z score=5.51; N=1,897; p<0.001; p<0.001.
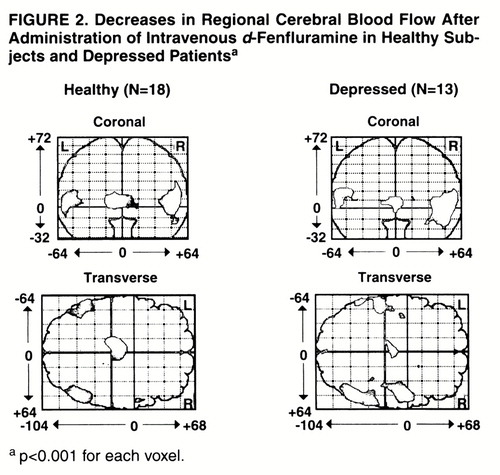
Decreases in regional CBF were also found in the healthy and depressed groups (figure 2). In the healthy subjects, relatively decreased activity was found in the bilateral posterior temporal cortex and in the left thalamus. For the left temporal cortex, the peak Talairach and Tournoux coordinates, z score, number of voxels, p value for number of voxels, and p value for peak voxel change were as follows: x=–52, y=–54, z=8; z score=4.53; N=385; p=0.01; p=0.008. For the right temporal cortex, the values were x=46, y=–62, z=8; z score=4.94; N=588; p=0.003; p=0.001. For the left thalamus, the values were the following: x=–10, y=–20, z=4; z score=5.73; N=504; p=0.005; p<0.001. Within the depressed group, relatively decreased activity was found bilaterally in the inferior parietal-superior temporal cortex. The peak coordinates, z score, number of voxels, p value for peak voxel change, and p value for this number of voxels were, for the left side, x=–56, y=–50, z=8; z score=4.11; N=386; p=0.01; p=0.04. For the right side (two regions) they were as follows: x=50, y=–62, z=0; z score=5.37; N=881; p<0.001; p<0.001; and x=50, y=2, z=8; z score=4.55; N=484; p=0.006; p=0.007.
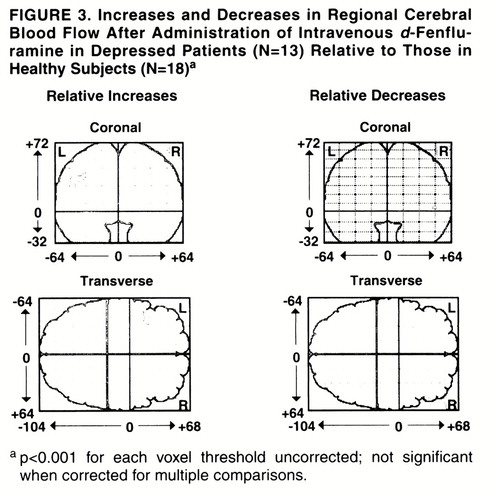
The effect of diagnosis on relative increases and decreases after intravenous d-fenfluramine was examined by using statistical parametric mapping (25-28). No significant differences were present. The depressed group had a nonsignificantly greater increase of regional CBF in the left frontal cortex (figure 3). This region was 72 voxels in size (not significant: p=0.18 for size, p=0.19 for peak voxel difference in change).
To eliminate any possibility that the difference between the healthy and depressed groups was a result of merely going through the procedure, relative decreases and increases in depressed as compared to healthy subjects from the first to the second baseline scan (before d-fenfluramine administration) were calculated. This would indicate changes in regional CBF between scan 1 and scan 2. No significant changes were found.
To demonstrate the consistency of our findings with those from other studies of regional CBF in depression (30), we examined the effect of diagnosis on regional CBF within the baseline condition. The baseline condition was defined as the two scans done before d-fenfluramine administration. The most significant findings were that the depressed patients had significantly less regional CBF in the bilateral dorsal and ventral anterior cingulate cortex (left spatially greater than right). The Talairach and Tournoux coordinates, z score, and p value for peak voxel changes were, for the left side, x=–12, y=24, z=28; z score=7.03; p<0.001; and, for the right side, x=12, y=20, z=28; z score=7.68; p<0.001. The total (left and right) region included 1,705 voxels (p<0.001). The most inferior level of anterior frontal cortex included in the analysis corresponded to approximately z=–12 in Talairach-Tournoux space; hence, the analysis did not include the orbital cortex.
Repeated measures analysis of variance (ANOVA) for the rate of response in the cognitive performance task showed that the effect of diagnosis, effect of repeated performance, and interaction of diagnosis and repetition were all nonsignificant (diagnosis: F=0.83, df=1, 29, p=0.37; repeated performance: F=0.21, df=3, 87, p=0.89; repeated performance by diagnosis: F=0.72, df=3, 87, p=0.54). Repeated measures ANOVA for response accuracy showed that the effect of diagnosis, effect of repeated performance, and interaction of diagnosis and repetition were also all nonsignificant (diagnosis: F=1.39, df=1, 29, p=0.25; repeated performance: F=1.31, df=3, 87, p=0.28; repeated performance by diagnosis F=0.66, df=3, 87, p=0.58).
The intravenous d-fenfluramine challenge elicited hormone responses, as would be expected of a serotonergic agonist. Blood samples were drawn from 28 of the 31 subjects. Repeated measures ANOVA of serum cortisol found significant effects over time (F=4.26, df=6, 156, p=0.001), which reflected a rise in cortisol after fenfluramine administration. There was no interaction with diagnosis in this small study group (F=0.63, df=6, 156, p=0.70). Diagnosis was significant for mean cortisol level (of seven samples) only (t=2.12, df=26, p=0.04). The mean serum cortisol levels for the depressed and healthy groups were 137 ng/ml (SD=45) and 109 ng/ml (SD=25), respectively. Peak cortisol change, defined as the maximum cortisol level of the five postfenfluramine samples minus the mean of the two samples taken before d-fenfluramine, was 14 ng/ml (SD=26). The time of peak cortisol response was 37 minutes (SD=15).
DISCUSSION
The major finding was that intravenous d-fenfluramine had remarkably similar effects on regional CBF in depressed and healthy subjects. There was no evidence for global hyporesponsiveness to d-fenfluramine.
The differences between depressed and healthy subjects’ responses to oral d,l-fenfluramine found by Mann et al. (19) were not replicated. The discrepancies may be explained by methodological differences. In the current study d-fenfluramine was used rather than d,l-fenfluramine. d,l-Fenfluramine is less selective for serotonin release because l-fenfluramine also has effects on dopamine and norepinephrine (11). The current findings are secondary to serotonin release, whereas the findings reported by Mann et al. (19) may be secondary to the release of multiple monoamines.
A second major methodological difference between the current study and the one by Mann et al. (19) is that we used intravenous, not oral, administration of fenfluramine. Consequently, scanning occurred much earlier in the current study (at 20 and 35 minutes after fenfluramine dosing) than in the study by Mann et al. (3 hours).
The differences in timing between the two studies may be responsible for dissimilar results because fenfluramine initially releases serotonin and then depletes presynaptic serotonin. Reports of preclinical studies (31, 32) suggest that serotonin storage is depleted about 1 to 2 hours after intraperitoneal fenfluramine administration. In the current study, scanning may have occurred before presynaptic serotonin depletion in both the depressed and healthy groups. In the study by Mann et al. (19), at 3 hours after oral fenfluramine presynaptic serotonin may have been depleted in depressed patients but not in healthy subjects. This would explain the finding that the depressed patients showed no response to fenfluramine but the healthy subjects did.
Selection of patients may also explain discrepancies between our findings and those of Mann et al. In our study, only one of 13 depressed subjects had a history of a suicide attempt and there were no patients with bipolar disorder, type I. In the Mann et al. study, two patients had backgrounds of suicide attempts and type I bipolar disorder.
The design of the current study has some limitations common to PET work using challenges and regional CBF tracers. A separate placebo challenge was not done, but the difference between our results and those of Mann et al. is unlikely to be attributable to any confounding interaction between diagnosis and duration of time spent in the scanner: no such interactions were present when we compared changes between the first two scans (done before d-fenfluramine administration). The measure of difference in regional CBF is relative; thus, the absolute change within the frontal cortex could be a greater increase in CBF than in the rest of the brain or a milder decrease in CBF compared to the decrease in the rest of the brain. Arterial sampling could have provided absolute values, but this more invasive method was not necessary to test the hypothesis of hyporesponsivity to d-fenfluramine in depression.
Changes in regional CBF are highly responsive to change in neuronal activity. There is a question about whether d-fenfluramine directly influences CBF within localized blood vessels. The regions with significant changes found in the healthy subjects refute the question of direct serotonin effect because they do not reflect any pattern of vascular supply and they are similar in location to those found with our previous oral d,l-fenfluramine challenge (17), which used [18F]FDG, a measure of glucose metabolism, as a radiotracer. The available evidence does not indicate localized differences in vasoconstriction by serotonin agonists. Of the cerebral arteries assessed in humans—basilar (33), middle cerebral (34), and smaller arteries within the temporal-parietal cortex (35)—the rank potencies of vasoconstriction by specific agonists are similar. d-Fenfluramine may have a direct global effect on cerebral vasculature, but statistical parametric mapping accounts for this by using global CBF as a covariate. In an animal study (36), regional CBF remained highly correlated with regional cerebral glucose uptake after 5-HT1A agonist administration, but to our knowledge correlations of regional CBF to regional glucose uptake have not been investigated with other selective 5-HT agonists or fenfluramine.
We did not find any differences between healthy and depressed subjects in regional CBF response to intravenous d-fenfluramine. This demonstrates that at least some postsynaptic serotonergic pathways are intact in depression. Differences between the findings in this study and the previous report (19) may be accounted for by greater specificity of intravenous d-fenfluramine to serotonin release, the timing of the scans, clinical differences in the depressed subjects recruited, or greater variance in regional CBF from direct vascular effects of serotonin. Future investigation with intravenous d-fenfluramine should focus on the effects of scan timing and should target subgroups of depressed subjects.
Presented in part at the 52nd annual meeting of the Society of Biological Psychiatry, San Diego, May 14–18, 1997.Received Dec. 20, 1996; ; revisions received Sept. 11, 1997, and March 20, 1998; accepted April 3, 1998. From the Clarke Institute of Psychiatry, University of Toronto.. Address reprint requests to Dr. Brown, Clarke Institute of Psychiatry, 250 College Street West, Toronto, Ont. M5T 1R8, Canada; [email protected] (e-mail). Supported by the Medical Research Council of Canada (grant MT-13137), the Physicians Services Incorporated Foundation (grant R95-11), and the Clarke Institute of Psychiatry (grant 5470).The authors thank PET center director Dr. Sylvain Houle; research scientist Dr. Shitij Kapur; radiochemists Dr. Alan Wilson and Dr. Jean DaSilva; research assistants Beata Owczarek, Fiona Downie, and Corey Jones; technicians Doug Hussey, Stephen Dobbin, and Kevin Cheung; and article reviewer Dr. Paul Fletcher.
1. Agren H, Reibring L: PET studies of presynaptic monoamine metabolism in depressed patients and healthy volunteers. Pharmacopsychiatry 1994; 27:2–6Crossref, Medline, Google Scholar
2. Delgado PL, Charney DS, Price LH, Aghajanian GK, Landis H, Heninger GR: Serotonin function and the mechanism of antidepressant action: reversal of antidepressant-induced remission by rapid depletion of plasma tryptophan. Arch Gen Psychiatry 1990; 47:411–418Crossref, Medline, Google Scholar
3. Asberg M, Traskman L, Thoren P: 5-HIAA in the cerebrospinal fluid: a biochemical suicide predictor? Arch Gen Psychiatry 1976; 33:1193–1197Google Scholar
4. Yates M, Leake A, Candy JM, Fairbairn AF, McKeith IG, Ferrier IN: 5HT2 receptor changes in major depression. Biol Psychiatry 1990; 27:489–496Crossref, Medline, Google Scholar
5. Hrdina PD, Demeter E, Vu TB, Sotonyi P, Palkovits M: 5-HT uptake sites and 5-HT2 receptors in brain of antidepressant-free suicide victims/depressives: increase in 5-HT2 sites in cortex and amygdala. Brain Res 1993; 614:37–44Crossref, Medline, Google Scholar
6. McKeith IG, Marshall EF, Ferrier IN, Armstrong MM, Kennedy WN, Perry RH, Perry EK, Eccleston D: 5-HT receptor binding in post-mortem brain from patients with affective disorder. J Affect Disord 1987; 13:67–74Crossref, Medline, Google Scholar
7. D’haenen H, Bossuyt A, Mertens J, Bossuyt-Piron C, Gijsemans M, Kaufman L: SPECT imaging of serotonin2 receptors in depression. Psychiatry Res 1992; 45:227–237Crossref, Medline, Google Scholar
8. Cheetham SC, Crompton MR, Katona CLE, Horton RW: Brain 5-HT2 receptor binding sites in depressed suicide victims. Brain Res 1988; 443:272–280Crossref, Medline, Google Scholar
9. Crow TJ, Cross AJ, Cooper SJ, Deakin JF, Ferrier IN, Johnson JA, Joseph MH, Owen F, Poulter M, Lofthouse R, Corsellis JAN, Chambers DR, Blessed G, Perry EK, Perry RH, Tomlinson BE: Neurotransmitter receptors and monoamine metabolites in the brains of patients with Alzheimer-type dementia and depression, and suicides. Neuropharmacology 1984; 23:1561–1569Crossref, Medline, Google Scholar
10. Mayberg HS, Robinson RG, Wong DF, Parikh R, Bolduc P, Starkstein SE, Price T, Dannals RF, Links JM, Wilson AA, Ravert HT, Wagner HN: PET imaging of cortical S2 serotonin receptors after stroke: lateralized changes and relationship to depression. Am J Psychiatry 1988; 145:937–943Link, Google Scholar
11. Invernizzi R, Berettera C, Garattini S, Samanin R: D- and L-isomers of fenfluramine differ markedly in their interaction with brain serotonin and catecholamines in the rat. Eur J Pharmacol 1986; 120:9–15Crossref, Medline, Google Scholar
12. Bonnano G, Fassio A, Severi P, Ruelle A, Raiteri M: Fenfluramine releases serotonin from human brain nerve endings by a dual mechanism. J Neurochem 1994; 63:1163–1166Crossref, Medline, Google Scholar
13. Heninger GR, Charney DS, Sternberg DE: Serotonergic function in depression. Arch Gen Psychiatry 1984; 41:398–402Crossref, Medline, Google Scholar
14. Siever LJ, Murphy DL, Slater S, de la Vega E, Lipper S: Plasma prolactin changes following fenfluramine in depressed patients compared to controls: an evaluation of central serotonergic responsivity in depression. Life Sci 1984; 34:1029–1039Crossref, Medline, Google Scholar
15. Lopez-Ibor JJ, Saiz-Ruiz J, Iglesias LM: The fenfluramine challenge test in the affective spectrum: a possible marker of endogeneity and severity. Pharmacopsychiatry 1988; 21:9–14Crossref, Medline, Google Scholar
16. Malone KM, Thase ME, Mieczkowski T, Myers JE, Stull SD, Cooper TB, Mann JJ: Fenfluramine challenge test as a predictor of outcome in major depression. Psychopharmacol Bull 1993; 29:155–161Medline, Google Scholar
17. Kapur S, Meyer J, Wilson AA, Houle S, Brown GM: Modulation of cortical neuronal activity by a serotonergic agent: a PET study in humans. Brain Res 1994; 646:292–294Crossref, Medline, Google Scholar
18. Meyer JH, Kapur S, Wilson AA, Dasilva JN, Houle S, Brown GM: Neuromodulation of frontal and temporal cortex by intravenous d-fenfluramine: an [15O]-H2O PET study in humans. Neurosci Lett 1996; 207:25–28Crossref, Medline, Google Scholar
19. Mann JJ, Malone KM, Diehl DJ, Perel J, Cooper TB, Mintun MA: Demonstration in vivo of reduced serotonin responsivity in the brain of untreated depressed patients. Am J Psychiatry 1996; 153:174–182Link, Google Scholar
20. Mann JJ, Malone KM, Diehl DJ, Perel J, Nichols TE, Mintun MA: Positron emission tomography imaging of serotonin activation effects on prefrontal cortex in healthy volunteers. J Cereb Blood Flow Metab 1996; 16:418–426Crossref, Medline, Google Scholar
21. First MB, Spitzer RL, Gibbon M, Williams JBW: Structured Clinical Interview for DSM-IV Axis I Disorders, Patient Edition (SCID-P), version 2. New York, New York State Psychiatric Institute, Biometrics Research, 1995Google Scholar
22. Hamilton M: A rating scale for depression. J Neurol Neurosurg Psychiatry 1960; 23:56–62Crossref, Medline, Google Scholar
23. Kapur S, Meyer J, Wilson AA, Houle S, Brown GM: Activation of specific cortical regions by apomorphine: an [15O]H2O PET study in humans. Neurosci Lett 1994; 176:21–24Crossref, Medline, Google Scholar
24. Hurtig RR, Hichwa RD, O’Leary DS, Boles Ponto LL, Narayana S, Watkins GL, Andreasen NC: Effects of timing and duration of cognitive activation in [15O]water PET studies. J Cereb Blood Flow Metab 1994; 14:423–430Crossref, Medline, Google Scholar
25. Friston KJ, Frith CD, Liddle PF, Frackowiak RS: Comparing functional (PET) images: the assessment of significant change. J Cereb Blood Flow Metab 1991; 4:690–699Crossref, Google Scholar
26. Friston KJ, Ashburner J, Pollne JB, Frith CD, Heather JD, Frackowiak RSJ: Spatial realignment and normalization of images. Human Brain Mapping 1995; 1:165–189Crossref, Google Scholar
27. Friston KJ, Frith CD, Liddle PF, Frackowiak RSJ: Assessing the significance of focal activations using their spatial extent. Human Brain Mapping 1994; 1:214–220Google Scholar
28. Friston KJ, Holmes AP, Worsley KJ, Poline JB, Frith CD, Frackowiak RSJ: Statistical parametric maps in functional imaging: a general linear approach. Human Brain Mapping 1995; 2:189–210Crossref, Google Scholar
29. Talairach J, Tournoux P: Co-Planar Stereotaxic Atlas of the Human Brain. New York, Thieme Medical, 1988Google Scholar
30. Kennedy SH, Javanmard M, Vaccarino FJ: A review of functional neuroimaging in mood disorders: positron emission tomography and depression. Can J Psychiatry 1997; 42:467–475Crossref, Medline, Google Scholar
31. Duhault J, Beregi L, Roman R: Substituted phenethylamines and anorexia. Prog Neuropsychopharmacol 1980; 4:341–349Crossref, Medline, Google Scholar
32. Fuller RW, Snoddy HD, Hemrick SK: Effects of fenfluramine and norfenfluramine on brain serotonin metabolism in rats. Proc Soc Exp Biol Med 1978; 157:202–205Crossref, Medline, Google Scholar
33. Parsons AA, Whalley ET, Feniuk W, Connor HE, Humphrey PP: 5-HT1 like receptors mediate 5-hydroxytryptamine-induced contraction of human isolated basilar artery. Br J Pharmacol 1989; 96:434–449Crossref, Medline, Google Scholar
34. Hamel E, Bouchard D: Contractile 5-HT1 receptors in human isolated pial arterioles: correlation with 5-HT1D binding sites. Br J Pharmacol 1991; 102:227–233Crossref, Medline, Google Scholar
35. Jansen I, Olesen J, Edvinsson I: 5-Hydroxytryptamine receptor characterization of human cerebral, middle meningeal and temporal arteries: regional differences. Acta Physiol Scand 1993; 147:141–150Crossref, Medline, Google Scholar
36. McBean DE, Sharkley J, Ritchie IM, Kelly PAT: Cerebrovascular and functional consequences of 5-HT1A receptor activation. Brain Res 1991; 555:159–163Crossref, Medline, Google Scholar