Alterations of Benzodiazepine Receptors in Type II Alcoholic Subjects Measured With SPECT and [123I]Iomazenil
Abstract
Objective:Alterations in cortical benzodiazepine receptor density have been described in postmortem and in vivo studies of alcoholic subjects. The authors attempted to replicate these findings using single photon emission computed tomography and the benzodiazepine receptor radiotracer [123I]iomazenil. Method:They measured the distribution volume of benzodiazepine receptors in 11 recently detoxified patients with type II alcoholism and 11 healthy comparison subjects. The tracer was given as a bolus followed by a continuous infusion to achieve sustained binding equilibrium at the benzodiazepine receptors. Data were analyzed by using a region of interest method (regions of interest were identified on coregistered magnetic resonance imaging scans) and by a pixel-by-pixel method (distribution volume maps were analyzed with statistical parametric mapping for between-group differences).Results:The region of interest analysis revealed that alcoholic patients had significantly lower benzodiazepine distribution volume than comparison subjects in the frontal, anterior cingulate, and cerebellar cortices. Statistical parametric mapping revealed two large excursions in which the distribution volume in alcoholic patients was significantly lower than in comparison subjects: the anterior cingulate, extending into the right middle frontal gyrus, and the left occipital cortex. Conclusions:Benzodiazepine receptor distribution volume is significantly lower in several cortical regions and the cerebellum in alcoholic subjects than in healthy comparison subjects. These results are consistent with previous reports and might indicate either a toxic effect of alcoholism on benzodiazepine receptors or a vulnerability factor for developing alcoholism. Am J Psychiatry 1998; 155: 1550-1555
Multiple lines of evidence support a role for γ-aminobutyric acid (GABA)-ergic transmission in the mechanisms of action of ethanol. More specifically, alcohol appears to have agonist properties at the GABAA receptor. GABAA agonists and benzodiazepines show cross-tolerance with ethanol and are typically used to alleviate withdrawal symptoms. Interestingly, abnormal densities of the benzodiazepine/GABAA receptor complex have been reported in some brain regions of alcoholic subjects. Using [3H]flunitrazepam, Freund and Ballinger showed a decrease in benzodiazepine densities in the frontal cortex (1) and hippocampus (2) of alcoholic subjects, and Korpi et al. (3) found reductions in the cerebellum measured with [3H]Ro15-4513. The decrease in the frontal cortex was not reported by an earlier study (4). No changes were reported in the striatum (5) or temporal cortex (6) of alcoholic subjects. In vivo positron emission tomography (PET) imaging has contributed to the study of alterations in brain GABAergic function related to alcoholism. A blunted metabolic response to lorazepam in the thalamus, basal ganglia, and orbitofrontal cortex has been described in alcoholic subjects (7) and in the cerebellum of subjects at risk for alcoholism (8). Initial in vivo studies of benzodiazepine receptor density (9–11) failed to demonstrate abnormalities in [11C]flumazenil binding in a small number of patients (N=5). However, a more recent study (12) reported a significant decrease in [11C]flumazenil distribution volume in the medial frontal lobes and cingulate gyrus of nine alcoholic subjects as well as a decrease in the same regions and in the cerebellum of eight alcoholic subjects with alcoholic cerebellar degeneration. Together, these studies suggest that alcoholism might be associated with a decreased benzodiazepine/GABAA receptor complex in some brain regions, such as the frontal cortex, the cingulate cortex, the hippocampus, and the cerebellum. However, the heterogeneity of the alcoholic patients included in these studies, as well as the presence of neurological impairment, might have contributed to some discrepancies between the studies.
The purpose of the present investigation was to confirm and extend these findings by measuring benzodiazepine distribution volume in a homogeneous group of neurologically intact and recently detoxified subjects with chronic alcoholism, using single photon emission computed tomography (SPECT) and [123I]iomazenil. In this study, we restricted our study group to subjects with type II alcoholism, i.e., alcoholism associated with early age at onset and social consequences (13). A radiotracer constant-infusion method was used to allow establishment of a true equilibrium binding condition and to remove the effects of blood flow changes on the measurement of benzodiazepine receptors. Two methods were used for the data analysis; the first was based on regions of interest defined a priori that were identified on coregistered magnetic resonance imaging (MRI) scans, and the second was based on a voxel-by-voxel analysis using statistical parametric mapping (14).
METHOD
Eleven male patients with chronic type II alcoholism were recruited at the West Haven Veterans Affairs Medical Center. Patients fulfilled DSM-IV criteria for alcohol dependence and had no other axis I disorder (including substance abuse) and no active substantial medical or neurological disorder. They had been sober for 1–6 months prior to the study and had not used benzodiazepines in the last month. The patients represented a homogeneous group of alcoholic subjects with severe and chronically dependent type II alcoholism (13, 15) Their mean age was 44 years (SD=8). Two were African American, and nine were Caucasian. Patients reported having had their first drink at mean age 14 (SD=2, range=9–16), their first intoxication at mean age 17 (SD=3, range=13–21), and becoming alcohol dependent at mean age 23 (SD=6, range=17–35). Their mean number of years of dependence was 21 (SD=10, range=7–39). They had a mean of five detoxifications (SD=6, range=0–20) and had been sober for a mean of 98 days (SD=46, range=37–178).
The comparison group included 11 healthy subjects who had no lifetime psychiatric diagnosis, no clinically significant medical or neurological history, and no history of alcoholism or psychiatric illnesses in their first-degree relatives. The comparison subjects were matched for age (mean=43, SD=10), sex (all were men), and ethnicity (two were African American and nine were Caucasian). All patients and comparison subjects gave written informed consent.
Radiolabeling, Data Acquisition, and Image Processing
[123I]Iomazenil was prepared as previously described (16, 17); its average yield was 63.3% (SD=10.7%), and its radiochemical purity was 97.6% (SD=2.0%).
Subjects received potassium iodide (0.6 g of SSKI solution) before the scan. Four fiducial markers filled with [99mTc]NaTcO4 were attached to the subject’s head at the level of the canthomeatal plane. Subjects received a priming bolus of [123I]iomazenil (mean=136.9 MBq, SD=18.5, for comparison subjects and mean=136.9 MBq, SD=22.2, for patients), followed by a continuous infusion at a constant rate (mean=37 MBq/hour, SD=3.7, and mean=37 MBq/hour, SD=7.4, respectively) by using a computer-controlled pump (IMED pump, Jemini PC-1, San Diego, Calif.). The duration of infusion was 7 hours (total injected dose mean=384.8 MBq, SD=51.8, and mean=381.1 MBq, SD=62.9, for comparison subjects and patients, respectively). Four consecutive 10-minute frames were acquired with the CERASPECT camera (Digital Scintigraphics, Waltham, Mass.) (18) from 360 to 400 minutes. Three venous blood samples were collected in the middle of the scanning session (380 minutes). MRI scans were acquired on the General Electric 1.5 T Signa superconducting magnet. Axial slices in the AC-PC plane were acquired using a double-spin echo protocol with TE=30 msec and TE=80 msec, TR=3500 msec or TR=4000 msec, matrix=256×192, NEX=1, thickness=3 mm, and no gap (pixel size=0.94×0.94); T2-weighted images were used in this analysis.
SPECT images were reconstructed with the CERASPECT software. The four acquisitions were reoriented to the first by using the fiducial markers as landmarks. The occipital time-activity curve was analyzed to check the quality of the equilibrium (a regional change of less than 10%/hour was used as the equilibrium criterion). The aligned SPECT acquisitions were summed on a slice-by-slice basis, and the summed SPECT data set was transferred to the program ANALYZE (Mayo Foundation, Rochester, Minn.). MRI T2-weighted images were coregistered to the summed SPECT image by using a contour-fitting procedure (19). Uniform attenuation correction was performed by using an ellipse drawn around the skull, as identified on the coregistered MRI (attenuation coefficient µ=0.12 cm–1). The attenuation-corrected SPECT was then coregistered to the original MRI. This procedure was followed in order to 1) perform the attenuation correction before any substantial rotation or reslicing of the SPECT data and 2) orient the SPECT slices of all subjects into the AC-PC line for data analysis.
Plasma Analysis
Blood samples were analyzed as previously described (16). Extraction (ethyl acetate) was followed by reverse-phase high performance liquid chromatography to measure the metabolite-corrected total plasma activity (Ca(t), µCi/ml). Clearance of the parent compound (liters/hour) was calculated as the ratio of the rate of infusion (µCi/hour) to the average plasma parent compound concentration (µCi/liter). Plasma protein binding was measured by ultrafiltration (20). A standard was processed with each experiment to control for day-to-day variability of the assay. The plasma free fraction measured in each subject (f1 meas) was corrected for interassay variability by using the standard measurement (f1 std) and the average of the standard measurement (f1 ave) over the course of the study ([f1 meas × f1 ave]/f1 std). The average metabolite-corrected plasma activity was multiplied by this corrected f1 value for each individual to generate the free parent concentration at steady-state.
Region of interest data were analyzed blind to the subject’s diagnosis. Nine large regions of interest were drawn on each MRI and transferred to the corresponding SPECT planes. These regions of interest included the prefrontal region (mean=15.7 cm3, SD=2.2), anterior cingulate (mean=2.7 cm3, SD=0.4), temporal region (mean=39.0 cm3, SD=4.0), parietal region (mean=52.0 cm3, SD=5.2), occipital region (mean=26.6 cm3, SD=2.9), medial temporal region (mean=10.6 cm3, SD=1.2) (including the amygdala and hippocampal formation), striatum (mean=7.8 cm3, SD=1.0), thalamus (mean=10.5 cm3, SD=1.2), and cerebellum (mean=13.3 cm3, SD=6.3). No significant differences were found in region size between the groups (data not shown). Average cpm/pixel region of interest activities were decay corrected and expressed in µCi/cc using a calibration factor of 0.0040 µCi/cpm derived from 123I distributed source phantom studies. Right and left hemisphere values were averaged. Regional activities (µCi/g of tissue) were divided by the concentration at steady-state (µCi/ml of plasma) to generate the benzodiazepine distribution volume (ml/g), as previously described (21).
SPECT images were transformed into benzodiazepine distribution volume maps by dividing the activity concentration in each pixel by concentration at steady-state. MRI scans were mapped into the Talairach space (22) with a 12-parameter affine transformation that was then applied to the subject’s benzodiazepine distribution volume map in a concentration-conservative manner. The atlas-fitted distribution volume maps were smoothed with a Gaussian kernel to minimize the effect of intersubject anatomical variability. Since the distribution volume map consists of absolute numbers that are directly comparable between subjects, we performed the statistical parametric mapping analysis without any global normalization. A correlation analysis of benzodiazepine receptor volume distribution with age was performed for each group.
Statistical Analysis
All values are given as means and standard deviations. For region of interest analysis, between-group differences in regional distribution volume values were measured with unpaired, two-tailed t tests. For correlation with clinical variables, given the exploratory nature of the analysis, we applied Bonferroni correction. For statistical parametric mapping analysis, the statistical z map threshold was set at 2.53 (p=0.005).
RESULTS
There were no between-group differences in the injected dose, bolus-to-infusion ratio, and time of scan (data not shown). A mean rate of change of occipital activity of –0.2%/hour (SD=4.8%, range=–8.3% to 6.3%) was observed for comparison subjects, and 1.4%/hour (SD=5%, range=–5.5% to 6.3%) for patients, with no between-group differences (F=0.56, df=1, 20, p=0.46). These distributions were not significantly different from 0 (one-sample t test, df=10, p=0.90 and p=0.37 for alcoholic subjects and comparison subjects, respectively), and all subjects displayed slopes less than 10%/hour. Therefore, all subjects were included in the analysis.
There were no significant differences in the plasma clearance between groups; the mean values for the total parent compound were 113 liters/hour (SD=18) for comparison subjects and 106 liters/hour (SD=34) for alcoholic subjects (F=0.29, df=1, 20, p=0.59). The plasma free fraction (f1) was nonsignificantly higher in alcoholic subjects (mean=34%, SD=2%) than comparison subjects (mean=31%, SD=4%) (df=1, 20, p=0.09).
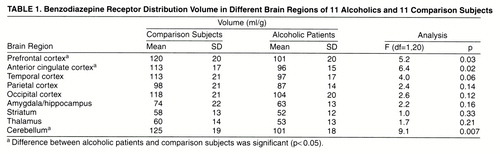
Benzodiazepine distribution volumes were lower in the alcoholic group in every region, but there were considerable regional differences in the magnitude and significance of this effect (table 1). Significantly lower benzodiazepine distribution volumes were observed in the alcoholic group in three regions: the prefrontal cortex, anterior cingulate, and cerebellum. A nonsignificantly lower benzodiazepine distribution volume was observed in the temporal cortex. No significant differences were observed in the parietal, occipital, amygdala/hippocampal, thalamic, and striatal regions. No relationships were observed between age and regional benzodiazepine distribution volume in the alcoholic or the comparison group (data not shown). In the alcoholic group, no significant relationships were observed between regional benzodiazepine distribution volume values and age at first drink, age at first intoxication, age at onset of dependence, years of dependence, number of detoxifications, and days of sobriety before the study (data not shown).
Two large excursions in which the distribution volume in alcoholic subjects was significantly lower than in comparison subjects were found (table 2, figures 1 and 2). The first region had its peak in the anterior cingulate and extended into the right middle frontal gyrus. The second region was smaller, located in the left occipital cortex. Both regions owed their statistical significance to their large extent and had relatively small peak values. No regions of significant correlation with age were detected in either group.
DISCUSSION
In this study, we used the constant-infusion, sustained-equilibrium method with SPECT [123I]iomazenil to compare regional benzodiazepine distribution volume values between type II alcoholic subjects and matched healthy comparison subjects. To our knowledge, this is the first SPECT study of benzodiazepine receptors in alcoholism. The results from both region of interest and statistical parametric mapping analyses indicate that type II alcoholism is associated with a decrease in benzodiazepine receptor distribution volume in several regions, including the anterior cingulate, the prefrontal cortex, and the cerebellum. The decrease in regional benzodiazepine distribution volume observed in this study is likely to be due to a decrease in benzodiazepine receptor density. However, we cannot rule out that these changes may reflect, at least in part, reduced receptor affinity for [123I]iomazenil or reduction in gray matter content in the regions of interest (23).
Two different strategies were followed for image analysis: one based on regions of interest and one based on voxels. Both strategies were in good agreement regarding benzodiazepine receptor distribution of alcoholic subjects in the anterior part of the brain: region of interest analysis showed a significantly lower benzodiazepine distribution volume in the prefrontal cortex and anterior cingulate, and statistical parametric mapping analysis showed decreased benzodiazepine density in the anterior cingulate and the right frontal cortex. The agreement between statistical parametric mapping and region of interest analyses in the anterior cingulate supports the earlier findings of reduced benzodiazepine receptor binding in anterior cingulate reported by Gilman et al. (12). As for the posterior regions of the brain, there were discrepancies between the two analyses. Region of interest analysis revealed a decrease in benzodiazepine density in the cerebellum of alcoholic subjects, but statistical parametric mapping identified a small region of decreased benzodiazepine density in the left occipital pole. The reason for this discrepancy is unclear, but it should be noted that 1) the cerebellum showed a significant decrease in benzodiazepine density in alcoholic subjects by statistical parametric mapping when the z threshold was lowered to 2.3 (data not shown); and 2) the occipital excursion identified by statistical parametric mapping might not have been detected in the region of interest analysis because the region sampled by the latter method was too large to be affected by the localized deficit identified by the statistical parametric mapping analysis.
The results reported here are in good agreement with previous postmortem studies. We replicated the findings of a decrease in benzodiazepine receptors in the frontal cortex (1) and the cerebellum (3). We did not replicate the findings in the hippocampus (2), but the ability to detect a decrease limited to this small region with SPECT is limited. We also replicated the in vivo findings with PET of decreased binding in the frontal and cingulate cortices (12). The main difference between this study and the PET study of Gilman et al. (12) is the decrease in the cerebellum, reported only in alcoholic subjects with cerebellar degeneration, while we observed it in neurologically intact patients. In that regard, our data are in agreement with those of Korpi et al. (3) who reported fewer benzodiazepine sites in the cerebellum of alcoholic subjects than in comparison subjects.
Altered benzodiazepine density might result from a neurotoxic effect of alcohol on the benzodiazepine receptor. Studies in rodents (24–26) have suggested changes in the mRNA expression of GABAA receptor subunits with alcohol consumption. Some (27, 28) but not all (29–31) studies have found that chronic administration of ethanol to rodents decreases benzodiazepine receptor binding in brain tissue homogenates. However, the lack of correlation between the density of receptors and the measures of severity of dependence (i.e., years of illness and number of detoxifications) does not support this interpretation. The second alternative is that a lower benzodiazepine receptor density represents a vulnerability factor to develop alcoholism. Since alcohol acts as a GABAA agonist, we may speculate that these subjects drink to compensate for a relative deficit in GABA function. Such a hypothesis would be supported by the observation of abnormal metabolic response to GABA agonists in nonalcoholic children of alcoholic subjects (8). However, this interpretation is speculative. Imaging benzodiazepine receptors density in nonalcoholic subjects at risk to develop alcoholism is needed to test this hypothesis.
In conclusion, this study confirmed the results of previous postmortem and imaging studies showing that alcoholism is associated with decreased benzodiazepine density in several cortical regions and in the cerebellum. Studies in young alcoholic subjects in their first year of abuse and in children of alcoholic subjects, who are at higher risk for developing alcoholism, may clarify whether the lower benzodiazepine binding represents a consequence of chronic alcohol intake or a vulnerability to develop alcohol dependence.
Presented in part at the Society for Research on Alcoholism, 1995, and at the American College of Neuropsychopharmacology, 1996Received Dec. 29, 1997; ; revision received April 10, 1998; accepted May 5, 1998. From the Departments of Psychiatry and Radiology, Yale University School of Medicine, New Haven, Conn.; the VA-Yale Alcoholism Research Center, VA Connecticut Healthcare System, West Haven; and the Department of Psychiatry, Columbia University College of Physicians and Surgeons, New York. Address reprint requests to Dr. Abi-Dargham, New York State Psychiatric Institute, Unit 28, 722 West 168th St., New York, NY 10032; [email protected] (e-mail). Supported by grant AA-10022 from the National Institute on Alcohol and Alcoholism (Dr. Abi-Dargham) and by the VA.The authors thank Paul B. Hoffer, M.D., for nuclear medicine support; Y. Zea-Ponce, Ph.D., M. Stratton, and M. Madrak for chemistry support; E. Webb, E.O. Smith, G. Wisniewski, M. Early, and C. Fingado for technical assistance in collecting the data; and J. Valenti and R. Weiss for image analysis.
 |
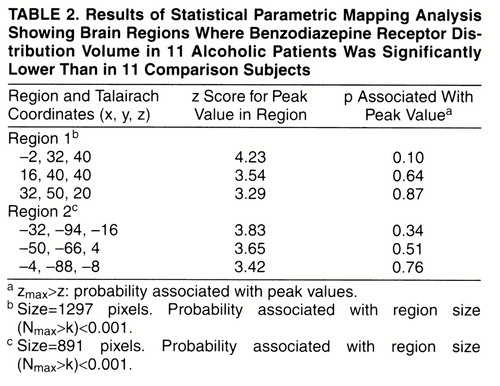 |

FIGURE 1. Projection Views of Regions Where Benzodiazepine Receptor Distribution Volume in Alcoholic Patients Was Significantly Lower Than in Comparison Subjectsa

FIGURE 2. Transaxial Slice of Regions Where Benzodiazepine Receptor Distribution Volume in Alcoholic Patients Was Significantly Lower Than in Comparison Subjects, Superimposed on an MRI Templatea
1. Freund G, Ballinger WE Jr: Decrease of benzodiazepine receptors in frontal cortex of alcoholics. Alcohol 1988; 5:275–282Crossref, Medline, Google Scholar
2. Freund G, Ballinger W Jr: Loss of muscarinic and benzodiazepine neuroreceptors from hippocampus of alcohol abusers. Alcohol 1989; 6:23–31Crossref, Medline, Google Scholar
3. Korpi E, Uusi-Oukari M, Wegelius K, Casanova M, Zito M, Kleinman J: Cerebellar and frontal cortical benzodiazepine receptors in human alcoholics and alcohol-drinking rats. Biol Psychiatry 1992; 31:774–786Crossref, Medline, Google Scholar
4. Tran VT, Snyder SH, Major LF, Hawley RJ: GABA receptors are increased in brains of alcoholics. Ann Neurol 1981; 9:289–292Crossref, Medline, Google Scholar
5. Freund G, Ballinger W Jr: Neuroreceptor changes in the putamen of alcohol abusers. Alcohol Clin Exp Res 1989; 13:213–218Crossref, Medline, Google Scholar
6. Freund G, Ballinger W Jr: Loss of muscarinic and benzodiazepine receptors from the temporal cortex of alcohol abusers. Metab Brain Dis 1989; 4:121–141Crossref, Medline, Google Scholar
7. Volkow ND, Wang G-J, Hitzemann R, Fowler JS, Wolf AP, Pappas N, Biegon A, Dewey SL: Decreased cerebral response to inhibitory neurotransmission in alcoholics. Am J Psychiatry 1993; 150:417–422Link, Google Scholar
8. Volkow ND, Wang G-J, Begleiter H, Hitzemann R, Pappas N, Burr G, Pascani K, Wong C, Fowler JS, Wolf AP: Regional brain metabolic response to lorazepam in subjects at risk for alcoholism. Alcohol Clin Exp Res 1995; 19:510–516Crossref, Medline, Google Scholar
9. Litton J-E, Neiman J, Pauli S, Farde L, Hindmarsh T, Halldin C, Sedvall G: PET analysis of [11C]flumazenil binding to benzodiazepine receptors in chronic alcohol-dependent men and healthy controls. Psychiatry Res Neuroimaging 1992; 50:1–13Crossref, Google Scholar
10. Pauli S, Liljequist S, Farde L, Swahn C-G, Halldin C, Litton JE, Sedvall G: PET analysis of alcohol interaction with the brain disposition of [11C]flumazenil. Psychopharmacology (Berl) 1992; 107:180–185Crossref, Medline, Google Scholar
11. Farde L, Pauli S, Litton JE, Halldin C, Neiman J, Sedvall G: PET-determination of benzodiazepine receptor binding in studies on alcoholism, in Toward a Molecular Basis of Alcohol Use and Abuse. Edited by Jansson B. New York, Birkhauser, 1994, pp 143–153Google Scholar
12. Gilman S, Koeppe RA, Adams K, Johnson-Greene D, Junck L, Kluin KJ, Brunberg JB, Martorello S, Lohman M: Positron emission tomographic studies of cerebral benzodiazepine-receptor binding in chronic alcoholics. Ann Neurol 1996; 40:163–171Crossref, Medline, Google Scholar
13. Von Knorring A, Bohman M, Von Knorring L, Oreland L: Platelet MAO activity as a biological marker in subgroups of alcoholism. Acta Psychiatr Scand 1985; 72:51–58Crossref, Medline, Google Scholar
14. Friston KJ, Holmes AP, Worsley KJ, Poline J-P, Frith CD, Frakowiak RSJ: Statistical parametric maps in functional imaging: a general linear approach. Hum Brain Mapping 1995; 2:189–210Crossref, Google Scholar
15. Cloninger CR: Neurogenetic adaptive mechanisms in alcohol. Science 1987; 236:410–416Crossref, Medline, Google Scholar
16. Zoghbi SS, Baldwin RM, Seibyl JP, al-Tikriti MS, Zea-Ponce Y, Laruelle M, Sybirska EH, Woods SW, Goddard AW, Malison RT, Charney DS, Smith EO, Hoffer PB, Innis RB: Pharmacokinetics of the SPECT benzodiazepine receptor radioligand [123I]iomazenil in human and non-human primates. Int J Radiat Appl Instr Part B: Nucl Med Biol 1992; 19:881–888Crossref, Medline, Google Scholar
17. Zea-Ponce Y, Baldwin RM, Zoghbi SS, Innis RB: Formation of 1-[123I]iodobutane in labeling [123I]iomazenil by iododestannylation: implication for the reaction mechanism. Appl Radiat Isot 1994; 45:63–68Crossref, Medline, Google Scholar
18. Zubal IG, Harrell C, Woods SW, Innis RB, Hoffer PB, Caride VJ, Zimmermann RE: Comparison of quantitation linearity of three brain SPECT imaging instruments using Tc-99m and I-123. J Nucl Med 1990; 31:769–770Google Scholar
19. Jiang H, Robb RA: A new approach to 3-D registration of multimodality images by surface matching, in Proceedings of the Second Conference on Visualization in Biomedical Computing, Chapel Hill, NC, 1992, pp 196–213Google Scholar
20. Gandelman MS, Baldwin RM, Zoghbi SS, Zea-Ponce Y, Innis RB: Evaluation of ultrafiltration for the free fraction determination of single photon emission computerized tomography (SPECT) radiotracers: b-CIT, IBF and iomazenil. J Pharm Sci 1994; 83:1014–1019Crossref, Medline, Google Scholar
21. Abi-Dargham A, Laruelle M, Seibyl J, Rattner Z, Baldwin RM, Zoghbi SS, Zea-Ponce Y, Bremner JD, Hyde TM, Charney DS, Hoffer PB, Innis RB: SPECT measurement of benzodiazepine receptors in human brain with [123I]iomazenil: kinetic and equilibrium paradigms. J Nucl Med 1994; 35:228–238Medline, Google Scholar
22. Talairach J, Tournoux P: Co-Planar Stereotaxic Atlas of the Human Brain. New York, Thieme Medical, 1988Google Scholar
23. Pfefferbaum A, Lim KO, Zipursky RB, Mathalon DH, Rosenbloom MJ, Lane B, Ha CN, Sullivan EV: Brain gray and white matter volume loss accelerates with aging in chronic alcoholics: a quantitative MRI study. Alcohol Clin Exp Res 1992; 16:1078–1089Crossref, Medline, Google Scholar
24. Buck K, Hahner L, Sikela J, Harris R: Chronic ethanol treatment alters brain levels of γ-aminobutyric acid A receptor subunit mRNAs: relationship to genetic differences in ethanol withdrawal seizure severity. J Neurochem 1991; 57:1452–1455Crossref, Medline, Google Scholar
25. Montpied P, Morrow A, Karanian J, Ginns E, Martin B, Paul S: Prolonged ethanol inhalation decreases γ-aminobutyric acid A receptor a subunit mRNAs in the rat cerebral cortex. Mol Pharmacol 1991; 39:157–163Medline, Google Scholar
26. Mhatre MC, Ticku MK: Chronic ethanol administration alters gamma-aminobutyric acidA receptor gene expression. Mol Pharmacol 1992; 42:415–422Medline, Google Scholar
27. Freund G: Benzodiazepine receptor loss in brains of mice after chronic alcohol consumption. Life Sci 1980; 27:987–992Crossref, Medline, Google Scholar
28. Ticku MK, Burch T: Alterations in gamma-aminobutyric acid receptor sensitivity following acute and chronic ethanol treatments. J Neurochem 1980; 34:417–423Crossref, Medline, Google Scholar
29. Hemmingsen R, Braestrup C, Nielsen M, Barry D: The benzodiazepine/GABA receptor complex during severe ethanol intoxication and withdrawal in the rat. Acta Psychiatr Scand 1982; 65:120–126Crossref, Medline, Google Scholar
30. Tamborska E, Marangos PJ: Brain benzodiazepine binding sites in ethanol dependent and withdrawal states. Life Sci 1986; 38:465–472Crossref, Medline, Google Scholar
31. Buck K, Harris R: Benzodiazepine agonist and inverse agonist actions on GABAA receptor operated chloride channels, II: chronic effects of ethanol. J Pharmacol Exp Ther 1990; 253:713–719Medline, Google Scholar