Treatment Course With Antidepressant Therapy in Late-Life Depression
Abstract
Objective
In order to assess the effect of gray matter volumes and cortical thickness on antidepressant treatment response in late-life depression, the authors examined the relationship between brain regions identified a priori and Montgomery-Åsberg Depression Rating Scale (MADRS) scores over the course of an antidepressant treatment trial.
Method
In a nonrandomized prospective trial, 168 patients who were at least 60 years of age and met DSM-IV criteria for major depression underwent MRI and were enrolled in a 12-week treatment study. Exclusion criteria included cognitive impairment or severe medical disorders. The volumes or cortical thicknesses of regions of interest that differed between the depressed group and a comparison group (N=50) were determined. These regions of interest were used in analyses of the depressed group to predict antidepressant treatment outcome. Mixed-model analyses adjusting for age, education, age at depression onset, race, baseline MADRS score, scanner, and interaction with time examined predictors of MADRS scores over time.
Results
Smaller hippocampal volumes predicted a slower response to treatment. With the inclusion of white matter hyperintensity severity and neuropsychological factor scores, the best model included hippocampal volume and cognitive processing speed to predict rate of response over time. A secondary analysis showed that hippocampal volume and frontal pole thickness differed between patients who achieved remission and those who did not.
Conclusions
These data expand our understanding of the prediction of treatment course in late-life depression. The authors propose that the primary variables of hippocampal volume and cognitive processing speed, subsuming other contributing variables (episodic memory, executive function, language processing) predict antidepressant response.
Late-life depression is a heterogeneous disorder that is associated with many adverse conditions, including decreased cognitive function (1–3) and an elevated risk for comorbid medical disorders such as vascular diseases (4, 5), as well as with an elevated mortality rate (1). The etiological factors contributing to late-life depression are not entirely understood, but the vascular depression hypothesis (6, 7) posits that cerebrovascular disease contributes to the development and severity of depression in older adults by causing ischemic white matter lesions of subcortical limbic structure projections to the frontal cortex or in frontal cortical white matter tracts; these interruptions cause alterations in mood regulation (5, 8) and cognition (9).
Gray matter structural alterations are also implicated in late-life depression, especially the regions comprising the frontolimbic pathway, including the orbitofrontal cortex, anterior cingulate gyrus, basal ganglia, hippocampus, parahippocampus, and amygdala. Smaller volumes of the orbitofrontal cortex (10–13), anterior cingulate (11, 13, 14), and hippocampus (1, 15) have been reported in persons with late-life depression. Some (16, 17) but not all (18) studies have found smaller amygdala volumes as well as smaller parahippocampus and caudate volumes in late-life depression, especially in late-onset late-life depression (16, 19).
Few studies have examined how the structural changes observed in late-life depression affect response to antidepressant treatment, yet this is an integral part of understanding the disorder’s pathophysiology. Gunning et al. (20) reported a correlation of smaller anterior cingulate volumes with poorer treatment response in late-life depression, but other cortical and subcortical structures were not investigated. In a previous study (21), we found that both comprehensive neuropsychological function and the severity of ischemic lesions as measured by white matter hyperintensities predicted prospective Montgomery-Åsberg Depression Rating Scale (MADRS) (22) scores over time in persons with late-life depression. In addition, we found that white matter hyperintensity severity and cognitive function were highly correlated with vascular risk factors, lending further support to the vascular depression hypothesis. However, in that study we did not examine whether gray matter regions of interest predicted treatment outcome. It is possible that white matter hyperintensities and gray matter volume loss could be independent but complementary routes contributing to treatment response in late-life depression. Alternatively, white matter hyperintensity lesions shown to interrupt tracts such as the uncinate fasciculus, superior and inferior longitudinal fasciculus (23), and cingulum bundle (24) could also have an impact on the volumes of gray matter structures.
In this study, we investigated the effect of gray matter regions of interest, selected a priori because they were shown to differ between individuals with late-life depression and nondepressed comparison subjects, on prediction of treatment response and rate of response over time to antidepressant treatment. While multiple studies have examined differences between patients with late-life depression and comparison subjects, most have compared brain structures between late-life depression patients with a higher vascular risk factor profile and comparison subjects with a lower vascular risk profile. Given significantly higher vascular risk profiles in most late-life depression samples (21), this approach has left vascular risk factors as a potential confounding source of observed differences. In this study, we first examined differences between patients with late-life depression and comparison subjects matched for vascular risk profile in regions comprising emotional circuits involved in emotional dysfunction. After determining which regions of interest differed between the depression and comparison samples, we used those that differed significantly to examine the effect of gray matter deficits on treatment response in late-life depression. We then added to the model previously identified neuropsychological factor scores (2), which along with white matter hyperintensity severity have been shown to be correlated with MADRS scores across time in an antidepressant treatment trial (21). Thus we constructed a more comprehensive model incorporating gray matter structures, white matter hyperintensity severity, and neuropsychological function to predict treatment outcome.
Method
Participants
Patients were recruited for the National Institute of Mental Health-sponsored Treatment Outcome in Vascular Depression study through advertisements and physician referral to Washington University Medical Center and Duke University Medical Center. The inclusion criteria for participants with late-life depression, study measures, and study design have been described in detail elsewhere (21). To be eligible for the study, patients had to be at least 60 years of age, meet DSM-IV criteria for major depressive disorder according to the Structured Clinical Interview for DSM-IV Axis I Disorders, score at least 20 on the MADRS, and score 0 on the Clinical Dementia Rating (25). Patients were excluded if they had MRI contraindications, severe medical disorders, primary neurologic disorders, or psychotropic drug use and if they had depression requiring hospitalization, a risk of suicide, or a history of failure to respond to two or more antidepressants.
Of 736 individuals originally screened by telephone, the exclusionary criteria reduced the patient study group to 217 (120 at Washington University and 97 at Duke University), 190 of whom completed the study. Patients were enrolled in a 12-week treatment trial of sertraline and were restricted from receiving other therapies during participation. The 190 completers were the subjects analyzed in our previous study of neuropsychological factor scores and white matter hyperintensity effects on treatment outcome (21). Problems with MRI scan acquisition or incomplete data reduced the number available for MRI analysis to 168 patients. In the remission analysis, 10 patients who dropped out of the study before completing 12 weeks of treatment further reduced the sample size to 158.
Regions of Interest
Based on our review of the literature (10–20), we predicted that the following regions of interest would be smaller in the depressed groups relative to a comparison group that was matched on vascular risk factors: volumes of the hippocampus, amygdala, parahippocampus, and caudate and cortical thicknesses of the anterior cingulate gyrus, frontal pole, superior frontal gyrus, orbital frontal gyrus, and middle frontal gyrus cortical gray matter.
Comparison Subjects
To determine which of these regions of interest should be employed in the assessment of treatment response, a sample of comparison subjects (N=57) matched on vascular risk factor profile with no history of depression was recruited from the community. Of these, 50 completed usable MRI scans. Written informed consent approved by the relevant institutional review boards was obtained from all participants.
Measures
Evaluations were performed by research staff at each site. Demographic variables included age, education, gender, race, depression symptom severity (scored on the MADRS), age at depression onset, Mini-Mental State Examination score, final daily dose of sertraline, and vascular risk factor score, as defined by the Framingham study (26). The Framingham study uses a stroke risk prediction assessment tool that includes the following vascular risk factors to predict 10-year risk of stroke in both men and women: age, systolic blood pressure, use of antihypertensive therapy, diabetes mellitus, cigarette smoking, cardiovascular disease (coronary heart disease, cardiac failure, or intermittent claudication), atrial fibrillation, and left ventricular hypertrophy by electrocardiogram. When adjusting for vascular risk factor score in the present study, we used the score without age to avoid doubly correcting for age and to have a measure of illness-related factors. We also conducted our analyses with the full vascular risk factor score as a check on this method and obtained virtually identical results.
Outcome Measures
MADRS scores were obtained at baseline and weekly for 12 weeks by a research psychiatrist. The MADRS is a well-validated 10-item clinician-administered instrument that includes all sources of information (patient report, collateral reports, and clinician observation) and is particularly sensitive to change (22). Remission, which was determined at the end of the 12-week sertraline treatment trial, was defined as a MADRS score ≤7 (21).
Sertraline Treatment
The initial sertraline dosage was 25 mg for 1 day to rule out drug sensitivity, then 50 mg/day, with dosage changes at 2 weeks (to 100 mg/day), 4 weeks (to 150 mg/day), and 6 weeks (to 200 mg/day) based on treatment response and adverse effects. Medication adherence was assessed at each visit by self-report. (For further details on dosing, adherence, and adverse effects, see Sheline et al. [21].)
MRI
Image acquisition.
At Washington University, MR images were collected using a MAGNETOM Sonata 1.5-T scanner (Siemens, Munich, Germany). Three-dimensional T1-weighted scans were acquired with magnetization-prepared rapid acquisition gradient echo (TR=1900 ms; TE=4 ms; TI=1100 ms; 222×256×128 pixels [1×1×1.25 mm]). At Duke University, MR images were collected using a 1.5-T GE scanner (General Electric, Schenectady, New York). The equivalent sagittal T1-weighted sequence was conducted using a three-dimensional inversion recovery-prepared spoiled gradient recalled scan (TR=8.3 ms; TE=3.3 ms; TI=300 ms; 256×256×124 pixels). While the parameters describing the pulse sequences appear to be different between the Siemens and GE scanners, they were chosen to produce images that had very similar contrasts and appearance. The different values are due to the different manufacturers’ implementation of these sequences. To correct for magnetic field inhomogeneities, a parametric bias field correction was used to correct both T1- and T2-weighted image intensities.
Image processing.
MRI preprocessing and the delineation of cortical and subcortical gray matter regions on structural images were conducted through a pipeline in the Washington University School of Medicine Central Neuroimaging Data Archive, based on the XNAT processing environment, using FreeSurfer 4.0.1 (http://surfer.nmr.mgh.harvard.edu), an automated segmentation software program (27–29) (see Figure S1 in the data supplement that accompanies the online edition of this article). Briefly, this processing includes motion correction, averaging of multiple volumetric T1-weighted images, removal of nonbrain tissue using a hybrid watershed/surface deformation procedure, automated Talairach transformation, segmentation of the subcortical white matter and deep gray matter volumetric structures, intensity normalization, tessellation of the gray matter-white matter boundary, automated topology correction, and surface deformation following intensity gradients to optimally place the borders between gray and white matter and between gray matter and CSF. Further data processing and analysis includes parcellation of the cerebral cortex into gyral and sulcal structure (29). Procedures for measurement of cortical thickness have been validated against histological analysis and manual measurements. FreeSurfer morphometric procedures have been demonstrated to show good test-retest reliability and good spatial reproducibility across scanners (30, 31).
Correlation of FreeSurfer measurements with stereology.
A subsample of 20 patients was examined to compare FreeSurfer with the gold standard of volume assessment using stereological estimation methods. From three-dimensional MRI cubical subvolumes (0.5×0.5×0.5-mm voxels), coronal slices were sampled every 1.5 mm. A 7×7-mm2 rigid grid of points with random starting position was superimposed on the images using ANALYZE. Mean volumes from two measurements were averaged for each structure (hippocampus, amygdala, caudate nucleus, and total cortical gray matter). All intraclass correlation coefficients were ≥0.90. Correlations between stereology and FreeSurfer measurements ranged from 0.83 to 0.98 for the structures measured.
Cognitive processing speed.
This domain, which was included in the model to predict outcome, included symbol-digit modality (number completed), the color naming condition of the Stroop test (number completed), and the Trail Making Test, part A (reverse scored time to completion) from a full neurocognitive battery (21).
Statistical Analysis
Linear regression was used to examine brain volume and thickness differences between the depressed and comparison groups, controlling for intracranial volume, age, race, education, vascular risk factor score, and scanner. As noted above, to avoid controlling for age more than once, we subtracted the age component from participants’ total vascular risk factor score. Two different analyses examined effects of predictors on outcome. Our primary analysis used mixed models to examine change in MADRS scores over time. A secondary analysis determined variables associated with remission in a confirmatory analysis. The assumptions of linear regression modeling were examined through residual plots and normality tests. Residuals and Student residuals versus predicted values were used to check the constant variance assumption. Residual histograms, qq-plot, and Kolmogorov-Smirnov tests were used to check the normality assumption. Leverage and Cook’s D plots were used to identify outliers. In cases where normality assumptions were violated or the variances were not constant, we used robust standard errors. The false discovery rate Benjamini-Hochberg procedure (32) was conducted in SAS to adjust p values for multiple comparisons. Spearman’s correlations were conducted between vascular risk factor score (minus age) and the region-of-interest variables, since the data were not normally distributed. A mixed model was used to measure the predictive utility of regions of interest on treatment response. We used 1) a model adjusting for region of interest, age at onset, age, race, gender, education, scanner, time, and depression severity (baseline MADRS score) and 2) a fully adjusted model that included all these variables as well as the interaction of time by regional measure to indicate the effect of region of interest on rate of response over time. In addition, to determine the effect of white matter hyperintensity severity and neuropsychological factor score on rate of response over time, and thus develop a comprehensive model, we added these variables to the model.
Results
A total of 168 patients with late-life depression (108 from Washington University, 60 from Duke University) were included in the mixed model analyses. Because 10 patients did not complete the 12-week study, only 158 were included in the remission analysis. There were no differences on any variables between the overall sample and the 158 patients who completed the trial. The first analysis compared the depressed and comparison groups to generate regions of interest for testing effects on treatment outcome. As shown in Table 1, the two groups were similar in demographic characteristics, although comparison subjects were older and more educated on average. Regions of interest were analyzed using the covariates listed in Table 1.
| Depression Group (N=168) | Comparison Group (N=50) | Analysisb | ||||
|---|---|---|---|---|---|---|
| Measure | Mean | SD | Mean | SD | t | p |
| Demographic variables | ||||||
| Age (years) | 67.96 | 7.49 | 73.00 | 5.31 | 5.40 | <0.01 |
| Education (years) | 14.27 | 3.03 | 15.46 | 3.08 | 2.52 | 0.01 |
| Mini-Mental State Examination score (N=206) | 27.82 | 1.97 | 28.24 | 1.72 | 1.54 | 0.13 |
| Framingham vascular risk factor score (excluding age) (N=218) | 7.40 | 3.73 | 8.04 | 3.40 | 0.96 | 0.34 |
| MRI volumescand thicknesses | ||||||
| Hippocampus (mm3) | 8,072.89 | 1,058.98 | 8,222.20 | 1,062.77 | −3.30 | 0.001* |
| Amygdala (mm3) | 3,252.36 | 491.92 | 3,379.34 | 532.50 | −3.33 | 0.001* |
| Anterior cingulate gyrus (mm) | 10.69 | 1.02 | 11.24 | 1.24 | −2.84 | 0.005* |
| Frontal pole (mm) | 5.61 | 0.65 | 5.96 | 0.78 | −3.11 | 0.002* |
| Superior frontal gyrus (mm) | 5.07 | 0.51 | 5.24 | 0.56 | −3.18 | 0.002* |
| Orbitofrontal gyrus (mm) | 9.99 | 0.94 | 10.36 | 1.11 | −2.71 | 0.007* |
| Middle frontal gyrus (mm) | 9.18 | 0.94 | 9.50 | 1.13 | −2.86 | 0.005* |
| Parahippocampus (mm3) | 3,353.04 | 524.14 | 3,240.12 | 518.69 | −0.33 | 0.74 |
| Caudate (mm3) | 6,653.25 | 1,050.23 | 6,476.56 | 1,069.91 | 0.80 | 0.43 |
| Cortical gray matter (mm3) | 451,724.84 | 52,723.88 | 437,575.62 | 57,641.59 | 1.46 | 0.15 |
After covarying for demographic factors and adjusting for multiple comparisons, the mean differences between groups in volumes and cortical thickness (regression coefficient for group) were computed. The volumes of the hippocampus and amygdala and the thicknesses of the frontal pole, superior frontal gyrus, middle frontal gyrus, orbitofrontal gyrus, and anterior cingulate gyrus differed between the depressed and comparison groups. The parahippocampus and caudate did not differ between groups and were not included in our treatment outcome analyses. Total cortical gray matter volume did not differ significantly between groups.
Using the significant regions of interest generated from the group comparisons, we evaluated the effects of regions of interest on prospective treatment outcome using a mixed model. Table 2 presents the results of a model that adjusted for the covariates age, education, age at onset, gender, scanner, and baseline depression severity but not for the interaction with time. Using this model, smaller amygdala and hippocampal volumes significantly predicted worse depression course as measured by MADRS scores. Using a model that adjusted for these covariates and that also adjusted for the interaction of the particular region of interest with time, only smaller hippocampal volume predicted slower rate of response to antidepressant treatment (hippocampal volume-by-time interaction, p=0.03). We then entered white matter hyperintensity severity, which did not significantly add to the prediction, and neuropsychological factor scores (episodic memory, cognitive processing speed, executive function, language, and working memory), one at a time. The Akaike information criterion (AIC), a goodness-of-fit test, was used to determine whether any neuropsychological factor scores improved the prediction of treatment response. While episodic memory, cognitive processing speed, executive function, and language, in combination with the hippocampal volume-by-time interaction, did predict the rate over time of recovery, cognitive processing speed in combination with the hippocampal volume-by-time interaction resulted in the smallest AIC and therefore was chosen in the model. We repeated this process adding in the other neuropsychological factor scores, but no other variable improved the model when added to the combination of hippocampal volume, hippocampal volume-by-time interaction, and processing speed. Thus, our working model for predicting rate of treatment response over time is presented in Figure 1, with hippocampal volume and cognitive processing speed as the predictors.
| MADRS Scores Over Time | |||
|---|---|---|---|
| Predictor Variable | Coefficient | SE | p |
| Amygdala volume (mm3) | −0.003 | 0.001 | 0.02 |
| Hippocampal volume (mm3) | −0.001 | 0.0005 | 0.04 |
| Anterior cingulate gyrus thickness (mm) | −0.71 | 0.42 | 0.09 |
| Frontal pole thickness (mm) | −1.07 | 0.70 | 0.13 |
| Middle frontal gyrus thickness (mm) | −0.41 | 0.52 | 0.43 |
| Orbitofrontal gyrus thickness (mm) | −0.80 | 0.48 | 0.10 |
| Superior frontal gyrus thickness (mm) | 0.93 | 0.90 | 0.31 |
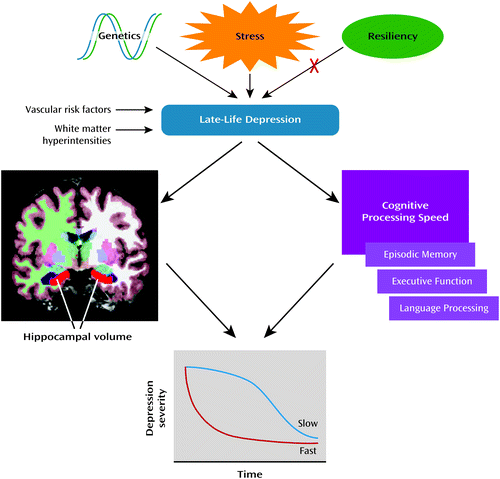
a In this model, the predictor variables for late-life depression are shown as stress and genetics, with resilience as a protective factor, modified by Framingham vascular risk factors and white matter hyperintensity severity. This is not meant to be an exclusive list; other factors, such as baseline depression severity, clearly influence antidepressant response. Furthermore, in some samples, late-life depression can be confounded by dementia. Not shown are the covariates in the model—age, age at onset, education, gender, depression severity, and race. Late-life depression is associated with smaller hippocampal volumes and slower cognitive processing speed. Within cognitive processing speed are subsumed executive function, episodic memory, and language processing. Together, smaller hippocampal volume and slower cognitive processing speed predict a slower rate of response to antidepressant treatment.
We previously showed (21) that vascular risk factor scores predicted worse treatment outcome. As shown in Table 3, using Spearman’s correlation, the vascular risk factor scores (minus age) were highly correlated with all of the predictor variables except frontal pole thickness and anterior cingulate gyrus thickness. Since we wanted to ascertain whether the hippocampal volume predictor was significant independent of vascular risk factor score, we entered the latter post hoc into the analysis and found that hippocampal volume remained a significant predictor.
| Spearman’s Correlation Coefficienta | ||
|---|---|---|
| Region | rs | p |
| Amygdala volume (mm3) | −0.17 | 0.03 |
| Hippocampus volume (mm3) | −0.27 | 0.001 |
| Anterior cingulate gyrus thickness (mm) | −0.12 | 0.12 |
| Frontal pole thickness (mm) | −0.09 | 0.22 |
| Middle frontal gyrus thickness (mm) | −0.22 | 0.005 |
| Orbitofrontal gyrus thickness (mm) | −0.17 | 0.03 |
| Superior frontal gyrus thickness (mm) | −0.18 | 0.02 |
Finally, in a confirmatory analysis, we examined which baseline volume and thickness variables differed between depressed patients who achieved remission (MADRS score ≤7) and those who did not. Table 4 shows that patients who did not achieve remission had significantly smaller hippocampal volumes and thinner frontal poles than those who did achieve remission. There were no significant differences in demographic characteristics between those who achieved remission and those who did not. The box plots in Figure 2 for left and right hippocampal volumes and cognitive processing speed show that the median for both measures was highest in depressed patients who achieved remission, next highest in comparison subjects, and lowest in depressed patients who did not achieve remission.
| Measure | Completed Treatment (N=158a) | Did Not Achieve Remission (N=94) | Achieved Remission (N=64) | Analysisb | ||||
|---|---|---|---|---|---|---|---|---|
| Demographic variables | ||||||||
| N | % | N | % | N | % | χ2 | p | |
| Male | 68 | 43 | 41 | 44 | 27 | 42 | 0.03 | 0.86 |
| White | 145 | 92 | 87 | 93 | 58 | 91 | 0.19 | 0.67 |
| Mean | SD | Mean | SD | Mean | SD | t | p | |
| Age (years) | 68.09 | 7.56 | 68.74 | 7.99 | 67.13 | 6.81 | 1.33 | 0.19 |
| Education (years) | 14.37 | 3.04 | 14.26 | 2.88 | 14.55 | 3.28 | −0.59 | 0.56 |
| Mini-Mental State Examination score | 27.80 | 1.96 | 27.60 | 1.97 | 28.08 | 1.93 | −1.48 | 0.14 |
| Framingham vascular risk factor score (no age) | 7.36 | 3.66 | 7.69 | 3.66 | 6.88 | 3.63 | 1.38 | 0.17 |
| Age at illness onset | 53.10 | 17.14 | 53.43 | 17.68 | 52.62 | 16.44 | 0.28 | 0.78 |
| MRI volumescand thicknesses | ||||||||
| Amygdala volume (mm3) | 3,252.5 | 498.8 | 3,208.9 | 470.0 | 3,316.5 | 535.7 | −1.33 | 0.18 |
| Caudate volume (mm3) | 6,643.0 | 1,013.3 | 6,665.4 | 1,050.3 | 6,610.0 | 963.7 | 0.34 | 0.74 |
| Cortical gray matter volume (mm3) | 450,730.2 | 50,706.0 | 449,226.2 | 52,458.0 | 452,915.7 | 48,370.9 | −0.45 | 0.66 |
| Hippocampus volume (mm3) | 8,086.5 | 1,066.8 | 7,942.3 | 1,075.7 | 8,298.2 | 1,025.3 | −2.08 | 0.04 |
| Parahippocampus volume (mm3) | 3,351.4 | 516.1 | 3,329.0 | 467.0 | 3,384.3 | 583.1 | −0.66 | 0.51 |
| Anterior cingulate gyrus thickness (mm) | 10.7 | 1.04 | 10.6 | 1.09 | 10.9 | 0.95 | −1.52 | 0.13 |
| Frontal pole thickness (mm) | 5.6 | 0.66 | 5.5 | 0.66 | 5.8 | 0.65 | −2.33 | 0.02 |
| Middle frontal gyrus thickness (mm) | 9.2 | 0.95 | 9.1 | 1.00 | 9.3 | 0.87 | −1.09 | 0.28 |
| Orbitofrontal gyrus thickness (mm) | 10.0 | 0.97 | 9.9 | 1.05 | 10.1 | 0.82 | −1.69 | 0.09 |
| Superior frontal gyrus thickness (mm) | 5.1 | 0.52 | 5.0 | 0.56 | 5.1 | 0.45 | −1.11 | 0.27 |

a In panel A, hippocampal volumes are from Table 1 (comparison group) and Table 4 (patients with late-life depression who did or did not achieve remission). In panel B, cognitive processing speed data are from Sheline et al. (21). Box plots show group median, 25%, and 75%. Error bars indicate standard deviations.
Discussion
The primary outcome of this prospective antidepressant treatment study using mixed models in late-life depression was that smaller pretreatment hippocampal volumes significantly predicted a slower rate of change in MADRS scores, from baseline through end of treatment, adjusted for demographic variables, including baseline depression severity and interaction with time. In addition, lower cognitive processing speed significantly added to the model predicting rate of change in depression scores. In a secondary confirmatory analysis, depressed patients who did not achieve remission (a subgroup that did not differ demographically from the subgroup that achieved remission) had smaller hippocampal volumes and thinner frontal pole cortical thicknesses. Thus, mixed models examining rate of change in depression severity and a model examining patients who achieved remission both identified hippocampal volume as a predictor of treatment response.
The findings that gray matter structures as well as white matter integrity (23, 24, 33) and presence of white matter hyperintensities (7, 8, 21, 34) and neuropsychological deficits (21, 35) contribute to depression outcome in late-life depression adds to our understanding of the pathophysiology of the disorder. However, of the brain variables we examined in this study, only hippocampal and amygdala volumes predicted treatment response over and above baseline depression severity. Analogously, in our previous study (21), only cognitive processing speed, executive function, episodic memory, and language factor scores predicted MADRS scores over time, independent of baseline depression severity, whereas working memory factor score and white matter hyperintensity severity did not, since their effect did not survive correction for baseline depression severity.
Based on our data, we propose a model for rate of antidepressant treatment response over time in late-life depression. The model that best fits the data includes hippocampal volume and the interaction between hippocampal volume and time, augmented by cognitive processing speed, to predict rate of improvement with antidepressant treatment. While executive function, language, and episodic memory also significantly predicted rate of response over time to antidepressant treatment in combination with hippocampal volume, when these variables were modeled separately, only cognitive processing speed improved the overall model. Cognitive processing speed is a fundamental aspect of both aging (36) and late-life depression (2, 37). The clinical implication of this study is that patients with late-life depression who have small hippocampal volumes and slow cognitive processing speed are likely to have a slower as well as a less complete recovery. While occult dementing illness can also affect hippocampal volume, we used rigorous criteria to exclude cognitive decline, and thus the smaller hippocampal volume and slower processing speed described here appear to be part of late-life depression per se.
There have been few studies with a healthy comparison group examining brain volumes or cortical thickness as a predictor of antidepressant treatment response in late-life depression. One study found that smaller hippocampal volumes predicted response (38), and another found that patients with nonremitting late-life depression had smaller dorsal and rostral anterior cingulate cortex volumes (20). In contrast, one late-life depression study found no differences between responders and nonresponders (39) in any brain region of interest. These divergent results may be due to methodological differences, such as sample size and differences in population characteristics. In the present study, the brain predictor variables were highly correlated with vascular risk factor score (Table 3). In post hoc analyses, we examined the effect of adding vascular risk factor score to the analysis and found that hippocampal volume remained a significant predictor of antidepressant response, suggesting that the effect was not subsumed under vascular risk factor score. We note that caudate volume did not differ between depressed patients and comparison subjects and therefore was not used in the current analysis. Because basal ganglia are vulnerable to ischemia and stroke, it may be that the discrepancy with prior studies is explained by their not controlling for vascular risk factor score.
The finding that smaller hippocampal volumes predicted slower rate of response after controlling for demographic variables and baseline depression severity appears to be a new finding based on the literature reviewed. It returns to the intriguing debate regarding the interrelationship among hippocampal plasticity, neurogenesis, depression, and treatment outcome. This interrelationship (40) involves interaction between hypothalamic-pituitary-adrenal axis dysfunction, depression, and hippocampal volume. A recent review of the evidence regarding the neurogenesis hypothesis of depression (41) concluded that while there is strong evidence supporting an important role for neurogenesis in the efficacy of antidepressant treatment, a deficiency in neurogenesis does not necessarily create the phenotype of depression. Our study adds to previous findings demonstrating that hippocampal volume is not only a determining factor in treatment outcome and rate of treatment response over time in late-life depression, but also a key indicator of underlying depression pathophysiology. Furthermore, using both hippocampal volume and cognitive processing speed as risk markers may improve our ability to predict which patients with late-life depression will likely have slow and incomplete antidepressant treatment response.
1 : A longitudinal study of hippocampal volume, cortisol levels, and cognition in older depressed subjects. Am J Psychiatry 2004; 161:2081–2090Link, Google Scholar
2 : Cognitive function in late life depression: relationships to depression severity, cerebrovascular risk factors and processing speed. Biol Psychiatry 2006; 60:58–65Crossref, Medline, Google Scholar
3 : Depressive symptoms, brain volumes and subclinical cerebrovascular disease in postmenopausal women: the Women’s Health Initiative MRI Study. J Affect Disord 2011; 132:275–284Crossref, Medline, Google Scholar
4 : Depression in the elderly. Lancet 2005; 365:1961–1970Crossref, Medline, Google Scholar
5 : How late-life depression affects cognition: neural mechanisms. Curr Psychiatry Rep 2010; 12:34–38Crossref, Medline, Google Scholar
6 : ‘Vascular depression’ hypothesis. Arch Gen Psychiatry 1997; 54:915–922Crossref, Medline, Google Scholar
7 : MRI-defined vascular depression. Am J Psychiatry 1997; 154:497–501Link, Google Scholar
8 : Depression and vascular disease: what is the relationship? J Affect Disord 2004; 79:81–95Crossref, Medline, Google Scholar
9 : A comparison of neurocognitive impairment in younger and older adults with major depression. Psychol Med 2009; 39:725–733Crossref, Medline, Google Scholar
10 : Subcortical lesion severity and orbitofrontal cortex volume in geriatric depression. Biol Psychiatry 2003; 54:529–533Crossref, Medline, Google Scholar
11 : Anterior cingulate, gyrus rectus, and orbitofrontal abnormalities in elderly depressed patients: an MRI-based parcellation of the prefrontal cortex. Am J Psychiatry 2004; 161:99–108Link, Google Scholar
12 : Depressive symptoms and brain volumes in older adults: a longitudinal magnetic resonance imaging study. J Psychiatry Neurosci 2009; 34:367–375Medline, Google Scholar
13 : Neuroanatomical characteristics of geriatric apathy and depression: a magnetic resonance imaging study. Am J Geriatr Psychiatry 2007; 15:386–394Crossref, Medline, Google Scholar
14 : Prefrontal brain morphology and executive function in healthy and depressed elderly. Int J Geriatr Psychiatry 2009; 24:459–468Crossref, Medline, Google Scholar
15 : Hippocampal volume in geriatric depression. Biol Psychiatry 2000; 48:301–309Crossref, Medline, Google Scholar
16 : Gray matter changes in late life depression: a structural MRI analysis. Neuropsychopharmacology 2008; 33:2566–2572Crossref, Medline, Google Scholar
17 : Amygdala volume in late-life depression: relationship with age of onset. Am J Geriatr Psychiatry 2011; 19:771–776Crossref, Medline, Google Scholar
18 : Amygdalae morphometry in late-life depression. Int J Geriatr Psychiatry 2009; 24:837–846Crossref, Medline, Google Scholar
19 : Three-dimensional surface mapping of the caudate nucleus in late-life depression. Am J Geriatr Psychiatry 2009; 17:4–12Crossref, Medline, Google Scholar
20 : Anterior cingulate cortical volumes and treatment remission of geriatric depression. Int J Geriatr Psychiatry 2009; 24:829–836Crossref, Medline, Google Scholar
21 : Support for the vascular depression hypothesis in late-life depression: results of a 2-site, prospective, antidepressant treatment trial. Arch Gen Psychiatry 2010; 67:277–285Crossref, Medline, Google Scholar
22 : A new depression scale designed to be sensitive to change. Br J Psychiatry 1979; 134:382–389Crossref, Medline, Google Scholar
23 : Regional white matter hyperintensity burden in automated segmentation distinguishes late-life depressed subjects from comparison subjects matched for vascular risk factors. Am J Psychiatry 2008; 165:524–532Link, Google Scholar
24 : Fiber tract-specific white matter lesion severity findings in late-life depression and by AGTR1 A1166C genotype. Hum Brain Mapp (Epub ahead of print, Oct 22, 2011)Google Scholar
25 : Clinical dementia rating: a reliable and valid diagnostic and staging measure for dementia of the Alzheimer type. Int Psychogeriatr 1997; 9(Suppl 1):173–176, discussion 177–178Crossref, Medline, Google Scholar
26 : Atrial fibrillation as an independent risk factor for stroke: the Framingham Study. Stroke 1991; 22:983–988Crossref, Medline, Google Scholar
27 : Cortical surface-based analysis, I: segmentation and surface reconstruction. Neuroimage 1999; 9:179–194Crossref, Medline, Google Scholar
28 : Automatically parcellating the human cerebral cortex. Cereb Cortex 2004; 14:11–22Crossref, Medline, Google Scholar
29 : An automated labeling system for subdividing the human cerebral cortex on MRI scans into gyral based regions of interest. Neuroimage 2006; 31:968–980Crossref, Medline, Google Scholar
30 : Reliability in multi-site structural MRI studies: effects of gradient non-linearity correction on phantom and human data. Neuroimage 2006; 30:436–443Crossref, Medline, Google Scholar
31 : MRI-derived measurements of human subcortical, ventricular and intracranial brain volumes: reliability effects of scan sessions, acquisition sequences, data analyses, scanner upgrade, scanner vendors and field strengths. Neuroimage 2009; 46:177–192Crossref, Medline, Google Scholar
32 : Controlling the false discovery rate: a practical and powerful approach to multiple testing. J R Stat Soc Series B Stat Methodol 1995; 57:289–300Google Scholar
33 : Diffuse microstructural abnormalities of normal-appearing white matter in late life depression: a diffusion tensor imaging study. Biol Psychiatry 2009; 66:245–252Crossref, Medline, Google Scholar
34 : Relationship between baseline white-matter changes and development of late-life depressive symptoms: 3-year results from the LADIS study. Psychol Med 2010; 40:603–610Crossref, Medline, Google Scholar
35 : Executive dysfunction and the course of geriatric depression. Biol Psychiatry 2005; 58:204–210Crossref, Medline, Google Scholar
36 : Aging and measures of processing speed. Biol Psychol 2000; 54:35–54Crossref, Medline, Google Scholar
37 : The nature and determinants of neuropsychological functioning in late-life depression. Arch Gen Psychiatry 2004; 61:587–595Crossref, Medline, Google Scholar
38 : Hippocampal volume and antidepressant response in geriatric depression. Int J Geriatr Psychiatry 2002; 17:519–525Crossref, Medline, Google Scholar
39 : Cerebral volume measurements and subcortical white matter lesions and short-term treatment response in late life depression. Int J Geriatr Psychiatry 2007; 22:468–474Crossref, Medline, Google Scholar
40 : Depression and the hippocampus: cause or effect? Biol Psychiatry 2011; 70:308–309Crossref, Medline, Google Scholar
41 : Neurogenesis and affective disorders. Eur J Neurosci 2011; 33:1152–1159Crossref, Medline, Google Scholar