A Molecular Signature of Depression in the Amygdala
Abstract
Objective: Major depressive disorder is a heterogeneous illness with a mostly uncharacterized pathology. Recent gene array attempts to identify the molecular underpinnings of the illness in human postmortem subjects have not yielded a consensus. The authors hypothesized that controlling several sources of clinical and technical variability and supporting their analysis with array results from a parallel study in the unpredictable chronic mild stress (UCMS) rodent model of depression would facilitate identification of the molecular pathology of major depression. Method: Large-scale gene expression was monitored in postmortem tissue from the anterior cingulate cortex and amygdala in paired male subjects with familial major depression and matched control subjects without major depression (N=14–16 pairs). Area dissections and analytical approaches were optimized. Results from the major depression group were compared with those from the UCMS study and confirmed by quantitative polymerase chain reaction and Western blot. Gene coexpression network analysis was performed on transcripts with conserved major depression-UCMS effects. Results: Significant and bidirectional predictions of altered gene expression were identified in amygdala between major depression and the UCMS model of depression. These effects were detected at the group level and also identified a subgroup of depressed subjects with a more homogeneous molecular pathology. This phylogenetically conserved “molecular signature” of major depression was reversed by antidepressants in mice, identified two distinct oligodendrocyte and neuronal phenotypes, and participated in highly cohesive and interactive gene coexpression networks. Conclusions: These studies demonstrate that the biological liability to major depression is reflected in a persistent molecular pathology that affects the amygdala, and support the hypothesis of maladaptive changes in this brain region as a putative primary pathology in major depression.
Although we know that dysregulated serotonergic and stress pathways are contributing factors in major depressive disorder, and despite the passage of more than 50 years since the discovery of clinically effective antidepressants, the biological mechanisms of major depression remain mostly uncharacterized (1) . Recent attempts to identify the molecular pathology of the illness based on large-scale gene arrays have implicated several biological systems but have not yielded a consensus, possibly because of differences in cohorts, brain areas investigated, and analytical approaches (2 – 6) as well as a substantial clinical heterogeneity. In fact, major depressive disorder may correspond to a family of disorders, which may be identified based on more narrow clinical and biological definitions (7) .
We sought to address these challenges in a gene expression profiling study of major depression designed 1) to reduce the clinical heterogeneity of the human cohort, 2) to focus on a relevant neural network, 3) to control for the variability in gene expression intrinsic to each brain region, 4) to maximize true discovery in gene array approaches, and 5) to use a parallel study in a more tractable animal model of depression and antidepressant reversal to support the analysis of the human results. The unpredictable chronic mild stress (UCMS) rodent model is informative for studying depression in animals, as it mimics in a naturalistic way the role of psychosocial environmental stressors in precipitating a depressive pathology and the time frame of antidepressant response (8 , 9) . The random application of several environmental and social mild stressors for several weeks results in a syndrome that is reminiscent of symptoms of depression, including physiological changes, increased fearfulness/anxiety-like behavior, and altered agonistic behavior (9) .
Our studies focused on the anterior cingulate cortex and the amygdala as critical components of a corticolimbic circuit of mood regulation (10) that is affected in major depression (11) . Evidence supporting dysfunctions of these areas in major depression include decreased anterior cingulate cortex volume and altered activity (12 – 15) , decreased glial density and reduced (16) or no change in neuronal size (17) in the anterior cingulate cortex, decreased glial density (18) and fewer oligodendrocytes (19) in the amygdala, and abnormal processing of emotional stimuli and sustained amygdala reactivity (20 – 22) . Accordingly, we tested the hypothesis that the biological liability to major depression would be reflected in a persistent molecular pathology affecting the amygdala and/or the anterior cingulate cortex.
Method
Subjects
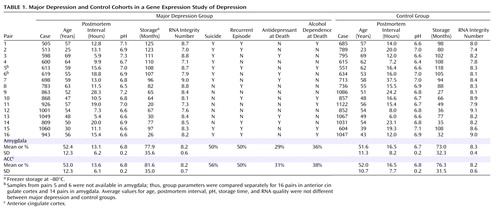
Brain samples were obtained during autopsies conducted at the Allegheny County Medical Examiner’s Office (Pittsburgh) after consent was provided by next of kin. Consensus DSM-IV diagnoses were made by an independent committee of experienced clinical research scientists using information from clinical records, toxicology results, and a standardized psychological autopsy. We analyzed 16 pairs (14 in the amygdala), consisting of white male subjects with familial major depressive disorder and control subjects without major depression matched for age, sex, and race ( Table 1 ). The increased disease severity was supported by a longer average duration of illness in the familial depression cohort compared to subjects with nonfamilial major depression from the same brain donation program (mean duration, 9 years [SD=7.0] compared with 3 years [SD=3.9], p=0.01). A symptom score was calculated based on the presence at time of death (1=unequivocal yes; 0.5=unsure or subthreshold; 0=unequivocal no) of nine symptoms of major depressive disorder: depressed mood, anhedonia, appetite disturbance, sleep disturbance, psychomotor change, anergia, self-recrimination, diminished ability to concentrate or make decisions, and suicidality. All procedures were approved by the University of Pittsburgh’s Institutional Review Board and Committee for Oversight of Research Involving the Dead. Detailed information is available in the data supplement that accompanies the online edition of this article.
Brain Samples
Rostral amygdala samples enriched in lateral, basolateral, and basomedian nuclei were delineated as described elsewhere (19) and dissected from frozen coronal blocks ∼2–3 cm caudal to the temporal pole. Samples of anterior cingulate cortex containing all six cortical layers were harvested from coronal sections in the subgenual anterior cingulate. A pilot study revealed rostrocaudal variations in transcript levels in both areas ( Figure 1 A,B). Selected white matter samples from anterior cingulate cortex (N=7) and amygdala (N=4) were obtained for analysis of cellular origin of transcripts (23) .

a In panel A, amygdala microdissected samples (bottom) from serial 20-μm sections 1 mm apart were processed on microarrays along the rostral-caudal axis for sections 1, 2, 4, 6, and 7. Markers for the middle and caudal amygdala were the dorsolateral subnuclei of the basolateral nucleus (arrow) and the appearance of the hippocampus (arrowhead). The lowest variability was observed between levels 1 and 2, as indicated by the average changes for detected genes (average log 2 ratio). In panel B, 20-μm serial sections through the rostral subgenual anterior cingulate cortex were initiated with the rostral tip of the subgenual anterior cingulate cortex. Asterisks indicate the boundary between anterior cingulate cortex and corpus callosum. Microarray samples were processed on the gray matter from five subdissected sections 1 μm apart (bottom). Although absolute values were generally higher than in amygdala, the lowest average variability in transcript levels was detected between levels 1 and 2 in rostral anterior cingulate cortex. Accordingly, sampling was performed for all subjects at the levels of sections 1 and 2 in amygdala and anterior cingulate cortex. In panel C, representative log 2 -based correlation graphs for all detected transcripts illustrate the effect of the pairing protocol on reducing non-disease-related effects. “R” stands for Pearson correlation factor. “Rep” indicates technical replicates. “Random” indicates nonpaired major depression and control samples. Below the graphs, p values are from exact Wilcoxon signed-ranks test performed on ∼26,000 gene transcripts with detectable levels. Panel D summarizes the experimental design. After 1) analyses of altered gene expression in major depression and UCMS, 2) the degree to which changes in one species predicted similar trends at the group level in the other species was assessed. Next, 3) UCMS predictions of gene changes in individual subjects with major depression were assessed. Then, 4) individual genes with conserved changes and antidepressant reversal were selected between UCMS and all major depression subjects (violet and yellow circles) or those with the subgroup of major depression subjects with positive UCMS correlation in amygdala (MDD UCMS subgroup, yellow circles), and 5) assessed for known cellular origin, function, and relationship. R indicates the directional Pearson correlation coefficient, including after antidepressant treatments (in red). Values not in parentheses in steps 2, 3, and 4 indicate genes with significant effects in step 1; values in parentheses indicate the numbers of identified mouse-human orthologs among significant genes that were used for cross-species analyses. AMY=amygdala; ACC=anterior cingulate cortex; CC=cingulate cortex; MDD=major depressive disorder; UCMS=unpredictable chronic mild stress rodent model; ADs=antidepressants.
Microarray Samples
Total RNA was extracted from frozen samples stored in TRIzol (Invitrogen, Carlsbad, Calif.) and processed for microarray analysis according to the microarray manufacturer’s protocol (Affymetrix, Santa Clara, Calif.). In brief, 2.5 μg of total RNA was reverse-transcribed and converted into double-stranded cDNA. A biotinylated cRNA was transcribed in vitro, using an RNA polymerase T7 promoter site introduced during the reverse-transcription step. Twenty micrograms of fragmented labeled cRNA sample were hybridized onto Human Genome U133Plus-2.0 arrays, assessing 54,675 probesets or gene transcript levels. To reduce the influence of technical variability, paired samples were processed together, but different pairs were randomly distributed at each experimental step. For samples, hybridization, and array quality control, probeset signals (i.e., transcript levels) were extracted with the Affymetrix GCOS software. For statistical analysis, log 2 -transformed probeset signal intensities were extracted and normalized with the robust multiarray average (GC-RMA) algorithm (24) . Probesets with GC-RMA data values below 12 displayed systematic coregulation patterns corresponding to the array normalization procedure and were considered background signal, leaving 25,859 probesets with detectable signal in the anterior cingulate cortex and/or the amygdala.
Microarray Quality Control
Individual scans were visually inspected for the presence of manufacturing defaults and hybridization artifacts. Quality control parameters were as follows: noise (RawQ, anterior cingulate, 1.47 [SD=0.34]; amygdala, 1.47 [SD=0.34]), background (anterior cingulate, 44 [SD=8]; amygdala, 43 [SD=5]), scale factor (anterior cingulate, 2.62 [SD=1.32]; amygdala, 4.41 [SD=0.97]), 3′/5′ actin ratio (anterior cingulate, 2.97 [SD=0.98]; amygdala, 2.98 [SD=0.93]), and 3′/5′ glyceraldehyde 3-phosphate dehydrogenase ratio (anterior cingulate, 1.23 [SD=0.217]; amygdala, 1.45 [SD=0.28]). Consistent numbers of genes were detected across arrays (anterior cingulate, 46.8% [SD=2.2]; amygdala, 48.2% [SD=3.3]), and consistent detection of BioB/C hybridization spiked controls. To further identify outlier samples, we used the “outlier detection” feature of the DNA-Chip Analyzer software (http://www.biostat.harvard.edu/complab/dchip), and analyzed correlation coefficients between array signals across all samples. Based on these results, 16 pairs were retained for analysis in anterior cingulate cortex and 14 pairs in amygdala.
Rodent UCMS Model
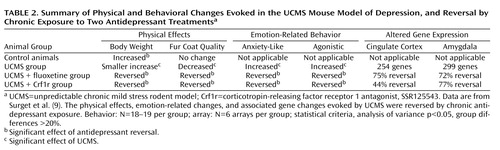
We previously described a behavioral and microarray study in the UCMS model of depression in mice (9) . Behavioral and array results from that study were used here to support the analysis of data in the homologous brain areas in human subjects. In brief, BALB/c mice were subjected to various stressors according to a pseudorandom schedule for 7 weeks. Drug (fluoxetine, 20 mg/kg/day, or a corticotropin-releasing-factor 1 [Crf1r] antagonist [SSR125543], 20 mg/kg/day) or vehicle treatments started on day 14 and continued until the end of UCMS, when microarray data (MOE430-2.0) were generated in cingulate cortex and amygdala (lateral/basolateral nuclei). Stressors included altered bedding (sawdust change, removal, or damp; substitution with water, rat, or cat feces); cage tilting or shaking; cage exchange (mice exposed to the empty cage of another male); induced defensive posture (repeated slight grips on the back); and altered light/dark cycle. Body weight and coat state were assessed weekly, as markers of the progression of the UCMS-evoked syndrome. The coat score combined results from different body parts (0=well-groomed, 1=unkempt). This index has been pharmacologically validated (25) . Emotion-related and agonistic behaviors were measured at the end of UCMS using the novelty suppressed feeding test and the resident/intruder test. The novelty suppressed feeding test consists of providing food-deprived mice with a food pellet in a novel, aversive environment (a brightly lit enclosure). The latency to start feeding correlates with fearfulness and decreases after acute treatment with anxiolytic drugs (26) or chronic antidepressant exposure (25) , suggesting that mechanisms underlying changes in the latency to feed involve anxiety-like and depression-like processes. For the resident/intruder test (27) , control and UCMS-treated mice were single-housed in new cages 2 days before testing. The opponent, a 6-month-old BALB/c intruder, was placed into the home cage of the test animal (resident). Latencies and number of attacks were recorded for 10 minutes. Detailed methods and results are described in (9) and summarized in Table 2 .
White Matter/Gray Matter Analysis
Ratios of transcript levels between white matter and gray matter samples were generated as described and used as estimates of relative gene transcript enrichment in glia (white matter/gray matter >1.5), neurons (white matter/gray matter <–1.5), or both cellular populations (–1.5 < white matter/gray matter < 1.5) (23) . (See the online data supplement for details.)
Array Data Statistical Analysis
Selection of significant genes
To maximize discovery, we opted for an analytical approach with initial low stringency, followed by a comparative analysis with UCMS array data. First we flagged any gene potentially affected in correlation with major depression, and then we focused on cross-species identification of similar changes for orthologous probesets. The assumption was that major-depression-related changes would manifest as weak effects but that the conservation of such changes across species would provide independent lines of validation and thus facilitate their identification from background variability or unrelated changes. We previously validated this approach in a study of gene expression correlates of aging between human and mouse brain (28) .
Statistical criteria
Changes in gene expression can take different nonexclusive forms in large data sets and are difficult to assess with any single test. Thus, for our inclusive first step, genes were tested by parametric paired t test, nonparametric paired Wilcoxon signed-ranks test, and analysis of variance (ANOVA), as well as taking into consideration several clinical covariate parameters. In ANOVA, the observed variance was partitioned into components explained by different explanatory variables (covariates). We applied the following ANOVA model for each gene:
Y gi = α g + β g * S i + τ g * R i + γ g * A i + δ g * AD i + ε gi ,
where 1 ≤ g ≤ G =26,199 genes, 1 ≤ i ≤ I pairs, and with clinical covariate values of 1 if the condition is true and 0 otherwise (S i , suicide; R i , recurrence; A i , comorbid alcohol dependence; AD i antidepressant). Since some of the covariates may not be statistically significant for each gene g, we applied a stepwise model selection by the Akaike information criterion (29) to find the final “best fit” model, and a corresponding adjusted p value was calculated for each gene. Genes were selected if any of the three statistical criteria were less than 0.05 and if group differences in transcript levels (paired and unpaired) were greater than 20% using mean or median averaged values, corresponding to a difference at the low limit of quantitative polymerase chain reaction (qPCR) confirmation. Genes were selected according to similar criteria in the UCMS data set (ANOVA, p<0.05; changes >20%) (9) . The significance of the cross-species concordance was assessed by bootstrap resampling (using the same analytical procedures), where sample groups were repeatedly shuffled in equal proportion (control and experimental), thus removing the major depression or UCMS component from the analysis. The procedure was repeated 1,000 times to generate a null distribution so that p values of the observed directional correlations could be assessed.
Directional correlations , r(D 1 , D 2 ), were calculated in a pair of cross-species or cross-brain region data sets D1 and D2. Ortholog probesets were identified using the Netaffx webtool (Affymetrix, Inc.) to link the human and mouse data sets. In contrast to traditional Pearson correlation, the directional correlation measures the fitness of significant genes in D1 to predict D2, and conversely of D2 to predict D1. For instance, the statistically significant genes in D1 were first selected and the Pearson correlation of the log-ratios of D1 and D2 in this restricted D1-significant gene set was calculated. Thus, directional correlations are not symmetric (r[D1, D2] ≠ r[D2, D1]).
Group variability in gene expression was assessed by two-group t test using individual gene transcript variances as continuous variables.
Real-Time qPCR
qPCR was performed as previously described (28) . Results were calculated as the geometric mean of relative intensities compared to three internal controls (actin, glyceraldehyde-3-phosphate dehydrogenase, and cyclophilin). (See the online data supplement for details.)
Western Blot Analysis
Proteins from paired samples were processed in quadruplicate using rabbit antiactin (Sigma #A2066) and mouse anticyclic nucleotide 3′ phosphodiesterase (CNP; SMI-91R, Covance) primary antibodies and IRDye 800 antirabbit and 680 antimouse (LI-COR Biosciences) secondary antibodies. Signals were simultaneously detected using the LI-COR Odyssey Infrared imaging system. CNP protein content was expressed relative to actin. (See the online data supplement for details.)
Gene Coexpression Networks
Gene coexpression networks were built through Pearson correlation of expression patterns and optimized using clustering coefficient analysis and jackknife correlation. (See the online data supplement for details.)
Results
Amygdala-Anterior Cingulate Cortex Altered Gene Expression in Human Major Depression
Large-scale gene expression profiles were generated from subdissected amygdala and anterior cingulate cortex ( Figure 1 A,B) in postmortem brains of male subjects with familial major depression and matched controls ( Table 1 ). Overall correlations of gene transcript levels were significantly higher in matched pairs compared to nonmatched major depression-control pairs ( Figure 1 C), thus validating the pairing protocol at controlling non-disease-related factors and reducing signal variability. Three hundred ninety-five genes in anterior cingulate cortex and 191 genes in amygdala were identified by paired statistics or ANOVA models as differentially expressed in major depression (Figure S1 and 1D). A qPCR survey on adjacent tissue sections yielded highly concordant results (array-qPCR Pearson correlation r=0.88, p<e –5 , N=16 genes; see Figure S1 in the online data supplement and Table 3 for selected genes), confirming the sampling and technical reliability of the array data. Nevertheless, as results are expected to contain false positives, we hypothesized that identifying relevant findings within this large pool of genes would benefit from a comparison with equivalent data obtained in an animal model that recapitulates behavioral and pharmacological aspects of depression.
Profiles of Altered Gene Transcripts Are Conserved Between Human Major Depression and the UCMS Mouse Model of Depression and Are Reversed by Antidepressant Treatments in Mice
We previously reported (9) that UCMS induces a depressive-like syndrome in mice, consisting of progressive deterioration in coat state, reduced weight gain, and increased agonistic and emotion-related behaviors and that both symptom dimensions were reversed by chronic administration of an effective (fluoxetine) or putative (Crf1r antagonist) antidepressant. UCMS also induced region-specific patterns of altered gene expression in cingulate cortex and in the lateral/basolateral nuclei of the amygdala, which were reversed by both drug treatments. These behavioral and molecular results are summarized in Table 2 , and the array results from that study were used here to support the analysis of the human data. Specifically, we hypothesized that if cellular mechanisms underlying mood regulation were conserved across species, then altered transcriptome in human major depression would predict similar changes in mice after UCMS, and that the effects of antidepressants in mice would help separate the effects of major depression from those of drug exposure in humans.
We investigated the degree of conservation of altered transcript levels for ortholog genes between major depression and UCMS by analysis of directional correlations. Confirming our hypothesis, highly significant, reciprocal, and consistent predictions of molecular changes were identified in amygdala (Figures 1D and 2A ). Specifically, of 191 genes with altered transcript levels in major depression, expression levels in mice were available for 105 ortholog probesets. Changes for these 105 mouse probesets were significantly correlated with human major depression-related changes (r=0.29, p<0.005). Conversely, of 299 genes with altered transcripts in amygdala of UCMS mice, the 213 identified human orthologs revealed a reciprocal mouse-to-human significant correlation of similar amplitude (r=0.29, p<0.00001). Analysis of 1,000 bootstrap resamplings demonstrated that the probability of obtaining the observed reciprocal concordance levels by chance was very low (p<0.001 for individual directional correlations, p<0.001 for concurrent positive findings in both directions). Markedly, the human-to-mouse correlations disappeared after successful antidepressant treatments in UCMS-exposed mice ( Figure 2 A). Thus, the pharmacological reversal of the major depression-UCMS correlation by two different antidepressants (i.e., targeting serotonergic or neuroendocrine stress pathways) demonstrated that the molecular changes supporting the major depression-UCMS correlations in amygdala were specific to the altered mood phenotype.
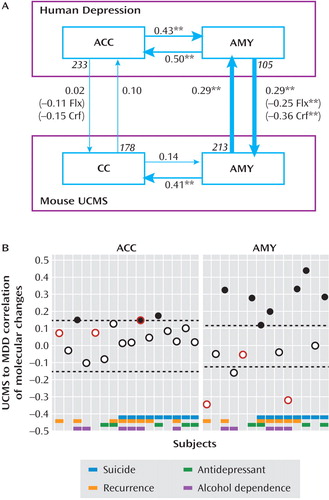
a In panel A, arrows indicate directional correlations between changes in transcript levels for genes identified in one area (origin of arrow) and changes for the same genes across areas within species, or within the same areas but across species (end of arrow). Numbers at the origin of the vertical arrows indicate the numbers of genes significantly affected in that species and for which data were available for orthologous genes in the other species. Averaged group values per gene transcript were used here when assessing major depression-UCMS correlation. Numbers in parentheses indicate levels of directional correlations between human major depression and UCMS-exposed mice chronically treated with two antidepressants (Flx=fluoxetine; Crf=Crf1r antagonist), and asterisks indicate significance (**p<0.001). In panel B, correlation between UCMS and individual major depression subjects confirmed the absence of conserved effect in anterior cingulate cortex and identified a subgroup of major depression subjects with significant and positive cross-species correlations of altered transcript levels in the amygdala. Subjectwise gene transcript changes were used here. Black dots indicate significant positive correlation. Red borders indicate subjects under partial or full remission at time of death. Dashed lines represent boundaries for significance of correlations. AMY=amygdala; ACC=anterior cingulate cortex; CC=cingulate cortex; MDD=major depressive disorder; UCMS=unpredictable chronic mild stress rodent model.
Toxicological screens identified the presence of antidepressants in five human subjects (four in the amygdala cohort), although these subjects were depressed at time of death, suggesting a lack of efficacy, suboptimal treatment, or treatment resistance. Similar correlations were observed between that patient subgroup and UCMS (r values ∼0.35), thus supporting the clinical evidence of a lack of antidepressant efficacy in these subjects, at least for genes underlying the UCMS-to-major depression correlation.
Conversely, UCMS-induced changes in mouse cingulate cortex did not predict corresponding changes in human anterior cingulate cortex (r=0.10), while human major-depression-related changes were also unrelated to changes in mouse cingulate cortex (r=0.02) ( Figure 2 A). These low and nonsignificant anterior cingulate cortex-cingulate cortex correlations could result from differential involvement of that brain area in major depression and UCMS, or reflect a low conservation of cingulate structure and function across species. To partly address this question, we took advantage of the robust differences in transcriptomes between anterior cingulate cortex and amygdala in human subjects (∼20% of genes; >2-fold change, p<0.01) and between mouse cingulate cortex and amygdala (∼10% of genes; >2-fold change, p<0.01) to estimate the degree of similarity in “molecular structure” between areas across species. We found highly significant and reciprocal correlations between human anterior cingulate cortex/amygdala and mouse cingulate cortex/amygdala differences (mouse-to-human, r=0.63, p<0.0001; human-to-mouse, r=0.55, p<0.0001). These values did not differ between major depression subjects, UCMS-treated mice, or control samples (r values ∼0.60, all comparisons, not shown). These results suggested that the lack of conserved depression-related findings in anterior cingulate cortex was not due to overall differences in “molecular structures” of the amygdala/anterior cingulate cortex network across species, thus also highlighting the amygdala specificity of the human-rodent correlation of the molecular impacts of major depression and UCMS.
Amygdala Cross-Species Correlations of Depression-Related Molecular Changes Identified a Subgroup of Human Major Depression Subjects
Absent or weak mouse-human correlations in cingulate cortices could also arise from variable or opposite effects in subgroups of human subjects, resulting in a null group effect. Indeed, despite our efforts to reduce the heterogeneity of the human cohort, major depressive disorder is by its clinical definition a heterogeneous disorder, and one may reasonably expect differences in molecular pathologies across subjects. Moreover, since the current analyses rely on large numbers of genes (178 in anterior cingulate cortex and 213 in amygdala), different gene sets may weigh differently across subjects; thus, correlation analyses in individual subjects may reveal features of cross-species predictions otherwise not available using combined group values. Here, using subjectwise changes in transcript levels for the identified genes ( Figure 1 D, step 3), we confirmed the lack of conserved major depression-UCMS effect in anterior cingulate cortex, as most individual human subjects displayed no cross-species correlation (Figures 1D and 2B , left panel). In amygdala, however, directional correlations revealed a large heterogeneity in cross-species predictions, with half of the subjects displaying positive correlations and the rest displaying either absent or negative correlations ( Figure 2 B, right panel). This difference from the anterior cingulate distribution was not explained by baseline changes, as the variability in gene expression of controls was comparable between anterior cingulate and amygdala (p>0.2). Rather, it was due to a selective increase in gene expression variability in the amygdala in subjects with major depression (amygdala: 50.3% higher gene transcript variance versus controls, p<0.01; anterior cingulate: 1% increase, p=0.97).
Notably, the subgroup of major depression subjects with positive UCMS correlation in amygdala (denoted here MDD UCMS ) did not differ in demographic parameters from controls or other subjects with major depression (all p values >0.05) and was not explained by differences in death by suicide, disease recurrence, antidepressant exposure, or alcohol dependence relative to other subjects with major depression ( Figure 2 B, bottom grid). The four major depression subjects with evidence of antidepressant exposure at time of death were all included in the MDD UCMS subgroup, confirming the presence of a depression-related molecular profile in these subjects (i.e., positive correlation with UCMS), consistent with their clinical profile. Overall, MDD UCMS subjects displayed a trend toward more depressive symptoms (7.4 versus 4.6 in the remaining major depression subjects, p=0.07). Interestingly, the two subjects with large negative correlations were among the only three major depression subjects who met requirements for remission or partial remission due to fewer depressive symptoms at time of death ( Figure 2 B, circles with red borders). Together, these findings suggest that the degree of correlation between UCMS and major depression molecular changes in amygdala may predict the severity of depression in human subjects. Indeed, a positive and significant correlation was observed between symptom numbers and UCMS-major depression correspondence (r=0.62, p=0.02; N=14 pairs), although this effect was partly driven by two remitted subjects (see Figure S2 in the online data supplement). Finally, restricting the analysis to MDD UCMS subjects ( Figure 1D , step 4), we identified a larger number of genes with altered transcript levels in amygdala (N≈2,100; 1,139 orthologs), suggesting a greater homogeneity in molecular profiles within this subgroup. In the absence of demographic identifiers, we interpreted these findings as evidence for a subgroup of major depression subjects (MDD UCMS ) with a consistent amygdala pathology, potentially reflecting a more severe form of the illness, and for which the UCMS rodent model provided significant predictability at the gene expression level.
Two Distinct Oligodendrocyte and Neuronal Depression-Related Phenotypes in Amygdala
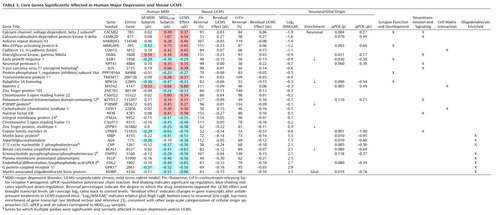
To characterize putative biological events underlying the cross-species correlations of changes and to address the presence of false positives in single data sets, we focused on genes with confirmed changes across species. Selected genes had to be significantly affected by UCMS and major depression and reversed by antidepressant treatments in the mouse model ( Figure 1 D, step 4), thus tracking the altered mood phenotype and controlling for drug effects. Of 299 gene transcripts affected by UCMS in amygdala, 61 were also significantly affected in major depression, mostly corresponding to changes in MDD UCMS subjects. Several of these transcript changes corresponded to the same genes and were combined, reducing the selection to 44 genes. Thirty-eight of the 44 genes displayed changes in the same direction in both species. Finally, antidepressant treatments reversed changes for 32 of these genes in rodents ( Table 3 ), together identifying a core set of genes, characterized by concordant major depression and UCMS effects and effective reversal by antidepressant treatments.
qPCR analysis on RNA extracted from adjacent tissue sections for 17 of these genes revealed a very high correlation with array results in the MDD UCMS group (r=0.95, p<0.00001; Table 3 ), even if individual statistical significances for some genes were only at the trend level (p=0.1). To determine whether this represented a quantitative limitation of the qPCR assay or a lack of biological effect, we assessed changes in protein levels for CNP, one of the three genes with trend-level significance by qPCR. Quantitative Western blot analysis revealed stable CNP protein levels over the postmortem interval covered in our study (PMI/protein, r=0.01; not shown), a high concordance with RNA levels (r=0.76 for all 14 pairs, p=0.002), and a significant down-regulation in MDD UCMS subjects (–21.5%, p=0.01; Figure 3 ). In concert with qPCR, these findings provided supporting evidence for the technical reliability and biological validity of the identified molecular profile described in Table 3 .
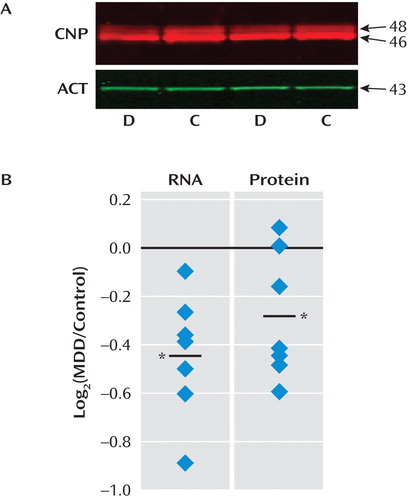
a Western blot analysis (panel A) revealed the expected bands for the two CNP protein isoforms. D and C indicate replicate major depression and control samples from the same matched pair of subjects. Panel B shows a quantitative plot denoting significant CNP down-regulation at the RNA (–29.2%, p<0.01; array results) and protein (–21.5%, p=0.01) levels in MDD UCMS subjects. Both protein isoforms were similarly affected.
Within the group of genes with suggested glial enrichment of transcripts, genes were almost exclusively related to oligodendrocyte structure and function and were all down-regulated ( Table 3 , bottom rows). This striking convergence of gene function and direction of biological effects strongly suggests the presence of a conserved phenotype negatively affecting oligodendrocytes in amygdala under major depression and UCMS conditions. Conversely, genes with suggested neuronal enrichment of transcripts were mostly up-regulated and related to cellular maturation and synaptic development, neurotransmission and signaling, and cell-cell and cell-matrix interactions ( Table 3 , upper rows), suggesting a putative increase in neuronal structure and function in amygdala of major depression subjects.
Genes With Conserved Major Depression- and UCMS-Related Changes Participate in a Highly Cohesive and Interactive Gene Coexpression Network
We next investigated whether the identified genes represented various unrelated molecular findings or if they participate in shared cellular and biological functions (known as functional modules). It is possible to test these hypotheses by simultaneously inferring the interactions, or “links,” between our identified genes. These links are based on synchronized fluctuations in gene expression across samples (i.e., “coexpression” link), which have been shown to correspond to shared biological functions (30) . Indeed, gene networks built on coexpression links typically cluster in functional modules that correspond to specific cellular activities (31 , 32) , and this organization persists across species (33) . Hence, biological networks built on coexpression links are a useful means of determining whether genes share common functions, and here they represent a bias-free and data-driven way to investigate putative unifying major-depression-related cellular processes shared by our identified genes.
Accordingly, we used Pearson correlations to determine pairwise coexpression links between the 32 identified genes, which were then used to build gene networks (see the online data supplement). To ensure that the coexpression links represented robust markers of biological gene interactions, we used clustering coefficient analysis and jackknife resampling methods to optimize our criteria for inclusion in the networks. Clustering coefficients estimate the density of local connections within functional modules and represent measures of network structure with wide applicability in brain networks (34) . Here, local modules were more connected than randomized networks (i.e., higher clustering coefficient; Figure 4 A), indicating that the identified genes participate in shared biological functions. Pearson correlation values resulting in networks with the largest differences in clustering coefficients compared to permutated networks provide the most biological information and were retained here as optimized cutoff points to build gene networks (dashed line in Figure 4 A) (35) . Additionally, we used a jackknife resampling approach to remove spurious links and maximize the biological reliability of the network. The obtained bimodal distributions clearly segregated links as robust (i.e., survive jackknife resampling; Figure 4 B, right bars) or spurious (i.e., do not survive jackknife; left bars) in both species. Thus, gene networks were built using 100 links from the most robust groups in the jackknife histograms ( Figure 4 C–D), corresponding to clustering coefficients within the suggested range of optimized values ( Figure 4 A; >0.65 in human; >0.75 in mouse).
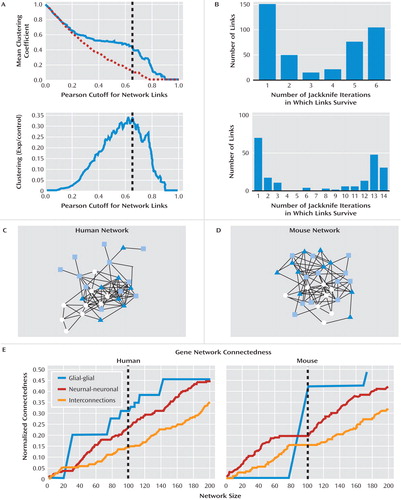
a Panels A and B show optimized parameters for building gene coexpression networks. In the top graph of panel A, the mean clustering coefficient for permutated degree-matched control networks decreases monotonically (dashed line). However, clustering in experimental networks showed a relative increase compared to permuted values at cutoff values in the region of 0.5–0.8 for both human (shown) and mouse (not shown) networks, indicating biologically relevant network structure (35). In the bottom graph, optimum Pearson correlation cutoffs for mean clustering coefficients (dashed line) were estimated by subtracting values of permutated degree-matched networks from actual values. Representative plots are from human control subjects. In panel B, the histograms of link robustness under jackknife correlation demonstrated the common bimodal distributions between robust (right bars) and spurious (left bars) links in human (bottom) and mouse (top) networks. Panels C and D shown an organic representation of the coexpression networks formed by genes supporting the molecular signature of depression in humans and mice, based on parameters optimized in panels A and B. White circles indicate glial-enriched gene transcripts; light to dark blue shapes indicate genes with increasing enrichment in neuronal origin of transcripts. Links between nodes represent coexpression links. Panel E shows plots of glial-glial, neuronal-neuronal, and neuronal-glial connectedness (i.e., number of connections within groups of genes divided by the total number of possible connections between those genes) as a function of network sizes (i.e., number of links). The visual segregation of glial-enriched and neuronal-enriched genes observed in panels C and D was reflected by increased numbers of connections within glial or neuronal groups compared to glial-neuronal connections (i.e., vertical distances for given network sizes). The sudden emergence of glial networks reflects the modularity of coexpression networks formed by fewer genes (and fewer samples in the mouse study) and is a strong indicator of unified function. The vertical dashed lines represent the chosen optimized cutoffs for network design using robust parameters from A to B and inclusion of representative glial-glial, neuronal-neuronal, and neuronal-glial connectedness.
The 32 identified genes formed a tightly clustered network ( Figure 4 C,D) with ∼7 times more connections than random networks of similar size (p<0.01). Moreover, the overall clustering coefficients for each network were on average 77% higher than degree-matched randomly selected reference networks (p<0.001). Results were highly similar for all conditions and in both species, thus strongly supporting the biological validity and reliability of the identified network. Although the organic representation of the networks showed some differences ( Figure 4 C,D), the internal topology was well conserved, with a ∼40% concordance of individual links across species, or ∼57% using correlation of “betweenness centrality,” a more general measure of network similarity (36) . Within this network, genes with suggested glial or neuronal enrichment of cellular origin of transcripts naturally segregated ( Figure 4 C,D), which was quantitatively reflected by higher intraconnections (glial-glial and neuronal-neuronal) than interconnections (glial-neuronal) ( Figure 4 E).
In summary, these results demonstrate that genes forming the identified molecular signature of depression belong to an existing and tightly connected gene network that is conserved across species and that reflects the interactive glial/neuronal cellular compartments of gray matter tissue, together suggesting an abnormal recruitment by the illness of existing cellular pathways.
Discussion
To identify the molecular pathology of major depression, a heterogeneous illness with multiple symptom dimensions, we focused on postmortem samples in a cohort with reduced clinical and demographic heterogeneity (familial major depression, male subjects) and on two brain regions (amygdala and anterior cingulate cortex) within a neural network putatively involved in altered mood regulation, a core symptom of the illness. After controlling several sources of technical variability ( Figure 1 ) and by relying on cross-species validation and antidepressant reversal of results, we identified reciprocal predictions of altered transcriptome between major depression and the UCMS rodent model of the disease ( Figure 2 A). These effects were detected at the group level and also identified a subgroup of the major depression group (MDD UCMS ; Figure 2 B) with a more homogeneous molecular pathology and for which UCMS provided a means to identify individual genes with conserved changes. Specifically, changes in transcript levels of ∼30 genes were similarly detected in human major depression and mouse UCMS and were reversed by antidepressant treatments in mice, hence corresponding to a pool of genes affected in correlation with mood states. These genes belonged to an existing cohesive network ( Figure 4 ) and suggested two distinct cellular phenotypes: decreased oligodendrocyte and up-regulated neuronal structure and function ( Table 3 ). Finally, the interconnections between the glial and neuronal components of the network suggested either a conserved cross-talk between the two phenotypes or a common upstream mechanism. Together, the present studies confirm that the biological liability to major depression is reflected in a persistent molecular pathology affecting the amygdala and support the hypothesis of maladaptive changes in the amygdala as a putative primary pathology in major depression.
A Phylogenetically Conserved Molecular Subtype of Depression in Amygdala
To address past difficulties, we assumed that evidence for mechanisms of mood dysregulation would manifest as weak but conserved signals between major depression and UCMS. Thus, critical analytical aspects were first to maintain a high discovery level and then to rely on cross-species validations of results, as previously described in a mouse-human comparative transcriptome study of brain aging (28) . The conserved changes observed here were confirmed by permutation analyses and were of a magnitude similar to age-related changes (Pearson directional correlations of ∼0.3–0.4). Thus, compared to the robust effects of aging, the molecular correlates of UCMS and major depression were surprisingly strong.
It is not known whether these conserved changes correspond to specific symptom dimensions (i.e., stress effects, or amygdala-mediated anxiety component) or to a core pathology in MDD UCMS subjects, as available parameters did not correlate with the subgroup ( Figure 2 ). Overall, MDD UCMS subjects displayed more depressive symptoms at time of death. The fact that major depression subjects who met requirements for remission or partial remission displayed no correlation or a negative correlation also suggested that opposite changes may participate in both depressive and remission phenotypes. We propose that this molecular signature may represent a novel approach to categorizing major depression, based on similarities of biological changes. This molecular view of disease heterogeneity is consistent with the notion that other subjects with major depression may present altered functions in different brain regions (exerting control over the amygdala, for instance), yielding similar clinical phenotypes but through pathogenic mechanisms remote from the amygdala.
In contrast, no UCMS-major depression correlations in gene expression were identified in cingulate cortices. The complex evolutionary changes and potential differences in connectivity of this brain area may explain the lack of conserved effects, despite similarities in molecular structures. The anterior cingulate cortex integrates input from cognitive and emotion-related sources, influences activities related to decision making, and modulates neuroendocrine, motor, and visceral responses (37) . Phylogenetic specializations of the human anterior cingulate include increased size, more functional subdivisions, dense prefrontal cortex connections, and cellular specializations (i.e., spindle cells) that allow distal connections with other brain regions (38 , 39) , together reflecting the human capacity for higher integration of complex emotion and cognitive functions compared to rodents (37) . Alternatively, some anterior cingulate findings may relate to the illness, but the UCMS model did not make their distinction from unrelated effects possible, as the model mimics only one of many putative pathogenic mechanisms in the illness. Hence, molecular data obtained in different models, based on cognitive- or reward-related symptoms, for instance, combined with investigations of additional brain regions, could provide additional insights on molecular dysfunctions in major depression, as different symptom dimensions likely correspond to dysfunctions in distinct neural networks (1 , 40) . Investigating selected brain areas in human subjects, in parallel with relevant animal models of symptom dimensions, may thus represent a fruitful approach to addressing the heterogeneity of the molecular pathology of major depression. In the absence of quantitative differences in clinical features or demographic identifiers, the present findings identified a subgroup of major depression subjects (MDD UCMS ) with a homogeneous molecular pathology and for which UCMS provided a significant predictability at the gene expression level.
Oligodendrocyte and Principal Pyramidal Neuronal Changes in Amygdala in Depression
The striking convergence of down-regulated glial-related gene transcripts in major depression and UCMS clearly suggests a conserved phenotype selectively affecting oligodendrocytes ( Table 3 ), consistent with reports of reduced numbers of oligodendrocytes in amygdala (19) and decreased oligodendrocyte-related gene expression in temporal cortex (4) , thus establishing amygdala oligodendrocyte alterations as a confirmed pathological finding in major depression. These changes appear more robust in amygdala, since they were not observed in anterior cingulate cortex/cingulate cortex or frontal cortex (2 , 3 , 5 , 6 ; see also reference 41 ).
The coexpression analyses revealed that the identified genes participate in a naturally occurring, tightly linked functional network that includes glial and neuronal components ( Figure 4 ), suggesting an abnormal recruitment of existing cellular pathways, although the identity and origin of the neuronal component is not known. What mechanisms might link these two phenotypes and be informative as to their cellular characterization? Results from the network analyses suggest that the two phenotypes may occur in concert, either through mutual interactions or downstream from a common perturbation. We speculate that the converging effects of increased amygdala recruitment (e.g., through excitatory glutamatergic neurotransmission originating from stress-related sensorimotor modalities) and elevated stress-induced glucocorticoid exposure, such as occurs in UCMS and has been suggested in major depression, may provide a common synergistic mechanism.
Both effects would be consistent with the observed glial phenotype, in view of the known vulnerability of oligodendrocytes to glutamatergic excitotoxicity (42) and inhibitory effect of glucocorticoids on oligodendrocyte proliferation (43 , 44) . Accordingly, decreased oligodendrocyte gene transcripts may represent early evidence of combined excitotoxic insults and glucocorticoid inhibition, leading over time to decreased oligodendrocyte numbers in major depression (19) .
On the other hand, this putative synergistic mechanism would suggest amygdala principal pyramidal cells as the likely source of the neuronal molecular pathology. Indeed, the convergence of increased ARHGAP6 (a RhoA inhibitor), CACNB2 (voltage-dependent calcium channel), and modulators of glutamatergic synaptic plasticity (CAMK2D, EGR1), coupled with increased components of cell-matrix remodeling (MATN2, CDH13, and CHSY1), suggest increased structural and functional dendritic/synaptic compartments. This interpretation is consistent with the reported increased dendritic branching in pyramidal neurons in the rat amygdala after chronic mild stress (45) and with the increased excitability of amygdala basolateral pyramidal neurons after glucocorticoid exposure (46) . Together with the absence of changes of interneuron markers, the known stimulatory effect of glucocorticoids on amygdala principal cells (46) , and an expected activity-driven dendritic structural up-regulation, the present results suggest an increased structure/function phenotype of amygdala principal pyramidal cells in UCMS and major depression. In humans, these proposed neuronal changes may correspond to cellular and molecular correlates of increased amygdala function in major depression (20 , 21 , 47) , although the causes may be complex and combine adaptive (or maladaptive) mechanisms and intrinsic genetic vulnerability (10 , 48) .
These results await replication in independent cohorts. The scarcity of well-characterized human postmortem brains of male subjects with familial major depression prevented the direct replication in our brain bank, and it is not known whether different demographic and clinical parameters (e.g., female subjects, nonfamilial depression) will affect the nature and/or robustness of the molecular findings. Another limitation concerns the presence of antidepressant treatments. In this study, antidepressant-treated subjects still met DSM-IV criteria for major depressive disorder, which suggests lack of efficacy, consistent with molecular profiles suggesting depressive-like states. Finally, numerous additional genes were identified, but the putative association of these genes with major depression could not be confirmed in the absence of independent cohorts or of animal models for alternative pathogenic mechanisms in the illness.
1. Belmaker RH, Agam G: Major depressive disorder. N Engl J Med 2008; 358:55–68Google Scholar
2. Sibille E, Arango V, Galfalvy HC, Pavlidis P, Erraji-BenChekroun L, Ellis SP, Mann JJ: Gene expression profiling of depression and suicide in human prefrontal cortex. Neuropsychopharmacology 2004; 29:351–361Google Scholar
3. Choudary PV, Molnar M, Evans SJ, Tomita H, Li JZ, Vawter MP, Myers RM, Bunney WE Jr, Akil H, Watson SJ, Jones EG: Altered cortical glutamatergic and GABAergic signal transmission with glial involvement in depression. Proc Natl Acad Sci USA 2005; 102:15653–15658Google Scholar
4. Aston C, Jiang L, Sokolov BP: Transcriptional profiling reveals evidence for signaling and oligodendroglial abnormalities in the temporal cortex from patients with major depressive disorder. Mol Psychiatry 2005; 10:309–322Google Scholar
5. Sequeira A, Gwadry FG, Ffrench-Mullen JM, Canetti L, Gingras Y, Casero RA Jr, Rouleau G, Benkelfat C, Turecki G: Implication of SSAT by gene expression and genetic variation in suicide and major depression. Arch Gen Psychiatry 2006; 63:35–48Google Scholar
6. Kang HJ, Adams DH, Simen A, Simen BB, Rajkowska G, Stockmeier CA, Overholser JC, Meltzer HY, Jurjus GJ, Konick LC, Newton SS, Duman RS: Gene expression profiling in postmortem prefrontal cortex of major depressive disorder. J Neurosci 2007; 27:13329–13340Google Scholar
7. Hasler G, Drevets WC, Manji HK, Charney DS: Discovering endophenotypes for major depression. Neuropsychopharmacology 2004; 29:1765–1781Google Scholar
8. Willner P: Chronic mild stress (CMS) revisited: consistency and behavioural-neurobiological concordance in the effects of CMS. Neuropsychobiology 2005; 52:90–110Google Scholar
9. Surget A, Wang Y, Leman S, Ibarguen-Vargas Y, Edgar N, Griebel G, Belzung C, Sibille E: Corticolimbic transcriptome changes are state-dependent and region-specific in a rodent model of depression and of antidepressant reversal. Neuropsychopharmacology 2009; 34:1363–1380Google Scholar
10. Pezawas L, Meyer-Lindenberg A, Drabant EM, Verchinski BA, Munoz KE, Kolachana BS, Egan MF, Mattay VS, Hariri AR, Weinberger DR: 5-HTTLPR polymorphism impacts human cingulate-amygdala interactions: a genetic susceptibility mechanism for depression. Nat Neurosci 2005; 8:828–834Google Scholar
11. Seminowicz DA, Mayberg HS, McIntosh AR, Goldapple K, Kennedy S, Segal Z, Rafi-Tari S: Limbic-frontal circuitry in major depression: a path modeling metanalysis. Neuroimage 2004; 22:409–418Google Scholar
12. Drevets WC, Price JL, Simpson JR Jr, Todd RD, Reich T, Vannier M, Raichle ME: Subgenual prefrontal cortex abnormalities in mood disorders. Nature 1997; 386:824–827Google Scholar
13. Botteron KN, Raichle ME, Drevets WC, Heath AC, Todd RD: Volumetric reduction in left subgenual prefrontal cortex in early onset depression. Biol Psychiatry 2002; 51:342–344Google Scholar
14. Mayberg HS, Liotti M, Brannan SK, McGinnis S, Mahurin RK, Jerabek PA, Silva JA, Tekell JL, Martin CC, Lancaster JL, Fox PT: Reciprocal limbic-cortical function and negative mood: converging PET findings in depression and normal sadness. Am J Psychiatry 1999; 156:675–682Google Scholar
15. Drevets WC, Bogers W, Raichle ME: Functional anatomical correlates of antidepressant drug treatment assessed using PET measures of regional glucose metabolism. Eur Neuropsychopharmacol 2002; 12:527–544Google Scholar
16. Cotter D, Mackay D, Landau S, Kerwin R, Everall I: Reduced glial cell density and neuronal size in the anterior cingulate cortex in major depressive disorder. Arch Gen Psychiatry 2001; 58:545–553Google Scholar
17. Ongur D, Drevets WC, Price JL: Glial reduction in the subgenual prefrontal cortex in mood disorders. Proc Natl Acad Sci USA 1998; 95:13290–13295Google Scholar
18. Bowley MP, Drevets WC, Ongur D, Price JL: Low glial numbers in the amygdala in major depressive disorder. Biol Psychiatry 2002; 52:404–412Google Scholar
19. Hamidi M, Drevets WC, Price JL: Glial reduction in amygdala in major depressive disorder is due to oligodendrocytes. Biol Psychiatry 2004; 55:563–569Google Scholar
20. Sheline YI, Barch DM, Donnelly JM, Ollinger JM, Snyder AZ, Mintun MA: Increased amygdala response to masked emotional faces in depressed subjects resolves with antidepressant treatment: an fMRI study. Biol Psychiatry 2001; 50:651–658Google Scholar
21. Siegle GJ, Steinhauer SR, Thase ME, Stenger VA, Carter CS: Can’t shake that feeling: event-related fMRI assessment of sustained amygdala activity in response to emotional information in depressed individuals. Biol Psychiatry 2002; 51:693–707Google Scholar
22. Roberson-Nay R, McClure EB, Monk CS, Nelson EE, Guyer AE, Fromm SJ, Charney DS, Leibenluft E, Blair J, Ernst M, Pine DS: Increased amygdala activity during successful memory encoding in adolescent major depressive disorder: an fMRI study. Biol Psychiatry 2006; 60:966–973Google Scholar
23. Sibille E, Arango V, Joeyen-Waldorf J, Wang Y, Leman S, Surget A, Belzung C, Mann JJ, Lewis DA: Large-scale estimates of cellular origins of mRNAs: enhancing the yield of transcriptome analyses. J Neurosci Methods 2008; 167:198–206Google Scholar
24. Irizarry RA, Bolstad BM, Collin F, Cope LM, Hobbs B, Speed TP: Summaries of Affymetrix GeneChip probe level data. Nucleic Acids Res 2003; 31:e15Google Scholar
25. Santarelli L, Saxe M, Gross C, Surget A, Battaglia F, Dulawa S, Weisstaub N, Lee J, Duman R, Arancio O, Belzung C, Hen R: Requirement of hippocampal neurogenesis for the behavioral effects of antidepressants. Science 2003; 301:805–809Google Scholar
26. Bodnoff SR, Suranyi-Cadotte B, Aitken DH, Quirion R, Meaney MJ: The effects of chronic antidepressant treatment in an animal model of anxiety. Psychopharmacology (Berl) 1988; 95:298–302Google Scholar
27. Mineur YS, Prasol DJ, Belzung C, Crusio WE: Agonistic behavior and unpredictable chronic mild stress in mice. Behav Genet 2003; 33:513–519Google Scholar
28. Sibille E, Su J, Leman S, Le Guisquet AM, Ibarguen-Vargas Y, Joeyen-Waldorf J, Glorioso C, Tseng GC, Pezzone M, Hen R, Belzung C: Lack of serotonin(1B) receptor expression leads to age-related motor dysfunction, early onset of brain molecular aging, and reduced longevity. Mol Psychiatry 2007; 12:1042–1056Google Scholar
29. Akaike H: A new look at the statistical model identification. IEEE Transact Automatic Control 1974; 19:716–723Google Scholar
30. Lee HK, Hsu AK, Sajdak J, Qin J, Pavlidis P: Coexpression analysis of human genes across many microarray data sets. Genome Res 2003; 14:1085–1094Google Scholar
31. Zhang B, Horvath S: A general framework for weighted gene co-expression network analysis. Stat Appl Genet Mol Biol 2005; 4(1)Google Scholar
32. Oldham MC, Konopka G, Iwamoto K, Langfelder P, Kato T, Horvath S, Geschwind DH: Functional organization of the transcriptome in human brain. Nat Neurosci 2008; 11:1271–1282Google Scholar
33. Bergmann S, Ihmels J, Barkai N: Similarities and differences in genome-wide expression data of six organisms. PLoS Biol 2004; 2:E9Google Scholar
34. Sporns O, Chialvo DR, Kaiser M, Hilgetag CC: Organization, development, and function of complex brain networks. Trends Cogn Sci 2004; 8:418–425Google Scholar
35. Elo LL, Jarvenpaa H, Oresic M, Lahesmaa R, Aittokallio T: Systematic construction of gene coexpression networks with applications to human T helper cell differentiation process. Bioinformatics 2007; 23:2096–2103Google Scholar
36. Girvan M, Newman ME: Community structure in social and biological networks. Proc Natl Acad Sci USA 2002; 99:7821–7826Google Scholar
37. Paus T: Primate anterior cingulate cortex: where motor control, drive, and cognition interface. Nat Rev Neurosci 2001; 2:417–424Google Scholar
38. Allman JM, Hakeem A, Erwin JM, Nimchinsky E, Hof P: The anterior cingulate cortex: the evolution of an interface between emotion and cognition. Ann NY Acad Sci 2001; 935:107–117Google Scholar
39. Allman J, Hakeem A, Watson K: Two phylogenetic specializations in the human brain. Neuroscientist 2002; 8:335–346Google Scholar
40. Nestler EJ, Barrot M, DiLeone RJ, Eisch AJ, Gold SJ, Monteggia LM: Neurobiology of depression. Neuron 2002; 34:13–25Google Scholar
41. Uranova NA, Vostrikov VM, Orlovskaya DD, Rachmanova VI: Oligodendroglial density in the prefrontal cortex in schizophrenia and mood disorders: a study from the Stanley Neuropathology Consortium. Schizophr Res 2004; 67:269–275Google Scholar
42. Rosin C, Bates TE, Skaper SD: Excitatory amino acid induced oligodendrocyte cell death in vitro: receptor-dependent and -independent mechanisms. J Neurochem 2004; 90:1173–1185Google Scholar
43. Banasr M, Valentine GW, Li XY, Gourley SL, Taylor JR, Duman RS: Chronic unpredictable stress decreases cell proliferation in the cerebral cortex of the adult rat. Biol Psychiatry 2007; 62:496–504Google Scholar
44. Wennstrom M, Hellsten J, Ekstrand J, Lindgren H, Tingstrom A: Corticosterone-induced inhibition of gliogenesis in rat hippocampus is counteracted by electroconvulsive seizures. Biol Psychiatry 2006; 59:178–186Google Scholar
45. Vyas A, Mitra R, Shankaranarayana Rao BS, Chattarji S: Chronic stress induces contrasting patterns of dendritic remodeling in hippocampal and amygdaloid neurons. J Neurosci 2002; 22:6810–6818Google Scholar
46. Duvarci S, Pare D: Glucocorticoids enhance the excitability of principal basolateral amygdala neurons. J Neurosci 2007; 27:4482–4491Google Scholar
47. Drevets WC: Prefrontal cortical-amygdalar metabolism in major depression. Ann NY Acad Sci 1999; 877:614–637Google Scholar
48. Hariri AR, Mattay VS, Tessitore A, Kolachana B, Fera F, Goldman D, Egan MF, Weinberger DR: Serotonin transporter genetic variation and the response of the human amygdala. Science 2002; 297:400–403Google Scholar