Spillover Effects on Treatment of Adult Depression in Primary Care After FDA Advisory on Risk of Pediatric Suicidality With SSRIs
Abstract
Objective: In 2003, the U.S. Food and Drug Administration (FDA) issued a public health advisory about the risk of suicidality in pediatric patients taking selective serotonin reuptake inhibitors (SSRIs) for depression, and in 2005, the agency mandated a black box warning and medication guide indicating that pediatric and adult patients may be at risk. The authors examine the effects of this pediatric policy on treatment of adult depression in the community. Method: An adult cohort with newly diagnosed episodes of depression was created from a large national integrated claims database of managed care plans from October 1998 to September 2005 (N=475,838 unique episodes). Time-series analyses were used to compare the post-FDA advisory trends to the trends during the 5 years preceding the advisory. Results: The rate of diagnosed depression was significantly lower after the advisory than would have been expected on the basis of the preadvisory historical trend. The average percentage of adults with new (versus recurrent) depressive episodes was 88.6% in the preadvisory period (declining at an annual rate of 1.69%), and it decreased significantly to 77.5% (declining more rapidly, at an annual rate of 7.70%). The percentage of adults with depression who did not receive an antidepressant increased from an average of 20% (declining at 0.45% annually) before the policy action to an average of 30% (increasing at an annual rate of 20.6%). The data did not show any compensatory increases in psychotherapy or prescription of atypical antipsychotics or anxiolytics. Conclusions: The FDA advisory had a significant spillover effect into community treatment for adults with depression, despite the focus of the policy on pediatric patients.
Depression ranks as one of the most burdensome and costly diseases worldwide (1 – 3) . The general medical sector sees the largest proportion of people seeking mental health care in the United States, more than double the proportion a decade earlier (4) . A leader in the field of depression treatment in primary care recently noted that, absent current practice guidelines, most primary care clinicians who diagnose depression in an adult initiate treatment with an antidepressant (5) . The U.S. Food and Drug Administration (FDA) changed health policy in 2005 by requiring that antidepressant manufacturers add a black box warning indicating that there may be a risk of suicidal ideation in depressed pediatric patients treated with antidepressants. The FDA provided the language for the accompanying medication guide, however, which was nonspecific and stated that youths and adults may be at risk. Thus, there is the potential that this policy action generated spillover effects to adult depression treatment, prior to FDA review and evaluation of adult data. (Later, in May 2007, the FDA extended the black box warning to include young adults, ages 19–24.)
We previously reported (6) on the FDA advisories’ effect on diagnosis and treatment of pediatric depression. The purpose of this study is to evaluate the impact of the FDA advisories on patterns of care for adults with depression. We measured and compared national postadvisory trends to the expected trends based on 5 years of preadvisory market measures using a national community-based cohort. We drew on a database with unique strengths for this purpose: an integrated file with comprehensive accounting for health care visits and prescriptions; a large number of patients, which permitted the creation of an analytic cohort of significant size; and a time span covering the 5-year period preceding the FDA policy action and a 2-year period afterward, allowing robust estimates of pre- and postadvisory trends in patterns of care. We used the same data source and methods in this study as we did in our pediatric study (6) , which makes direct comparison possible between pediatric and adult markets.
Method
Data
The data for this study, from the PharMetrics Patient-Centric Database, span the period of January 1997 to December 2005. The data universe includes medical, specialty, facility, and pharmacy paid claims from more than 85 managed care plans nationally, representing more than 47 million covered lives. The distributions of age, gender, and region in these national data are not statistically different from those in the 2000 U.S. Census data (7) .
Enrollment and claims data were extracted from the database for enrollees of all ages who met either of two criteria: they had a diagnosis of major depressive disorder or a related psychiatric disorder (ICD-9-CM codes 296.xx–300.xx or 311.xx) on a medical claim assigned by a clinician, or they had a paid claim for a filled prescription of any antidepressant drug (generic product identifier [GPI] code 58.xx). This process resulted in a base population of some 4.1 million patients. Because the data were unidentified and anonymous, an expedited review was obtained, and the study was approved by the Colorado Multiple Institutional Review Board.
The analytical file was built by creating a cohort of new cases of depression and then aggregating the data for time-series regressions. First, claims data were used to create a cohort of new episodes of depression. A new episode was defined using the following specifications of the National Committee for Quality Assurance’s Healthplan and Employer Data and Information Set (HEDIS): an ICD-9 code of 296.2, 296.3, 300.4, or 311 (i.e., major depressive disorder, single episode; major depressive disorder, recurrent episode; neurotic depression; and depression not otherwise specified, respectively); a period of 120 days before diagnosis during which no other depression-related diagnoses appeared in the claims history; and a period of 90 days before diagnosis during which no other antidepressant medication claims appeared in the history (8 , 9) . Continuous enrollment for 120 days before and after diagnosis was required. The HEDIS outpatient depression indicators were derived from expert consensus on treatment research and clinical care and have been used in published depression treatment and outcomes research (8 – 11) .
The time horizon for the study was anchored by the first clinical trial of the safety and efficacy of selective serotonin reuptake inhibitor (SSRI) antidepressants for youths (12) , to allow comparison of the results of this study with those of our pediatric study (6) . To account for seasonal trends, annual data were anchored on the same month. The resulting time horizon, which accounted for episode creation, follow-up, and seasonality, spanned October 1998 to September 2005. From the total cohort of 541,187 unique new episodes of depression, pediatric cases (age ≤18 years at diagnosis) were excluded, yielding an adult cohort (ages 19–89 years) of 400,111 unique adult patients with a total of 475,838 episodes of diagnosis of depression.
The second step for the analytic file was to create time series based on aggregated measures of the cohort. As new episodes of depression accrued within the cohort over time, relevant measures were aggregated into successive monthly values. Thus, each observation is an aggregate measure of health care services used by adults with new depressive episodes diagnosed nationally in that month. These data constituted the analytic file for time series of variables with aggregated national values spanning 60 months before and 24 months after the initial FDA advisory was issued in October 2003.
FDA Advisory
As suggested earlier, we selected the October 2003 FDA advisory as the policy action of interest in our analysis. This choice was determined empirically by the time point at which the FDA action was reflected in aggregated series, and it is consistent with other reports of market-level changes (13) . The October 2003 advisory was the first in a series of risk communications; a second public health advisory followed in October 2004, and the black box warning and language for a patient medication guide were implemented in February 2005. Sensitivity analyses were conducted on the timing of the shock (e.g., examining the second advisory in October 2004), and the results supported the choice of the 2003 advisory as the point of interest.
Measures
For each month in the 7-year period, process-of-care measures were calculated based on the cohort. National aggregate measures were calculated annually for the first measure described below, and monthly for the remaining seven measures, reflecting data sources. The measures that were specified as requiring longer follow-up periods (180 days, or 6 months) were excluded from the monthly cohorts for the last 5 months of 2005.
Rate of Depression Diagnosis in the Managed Care Population
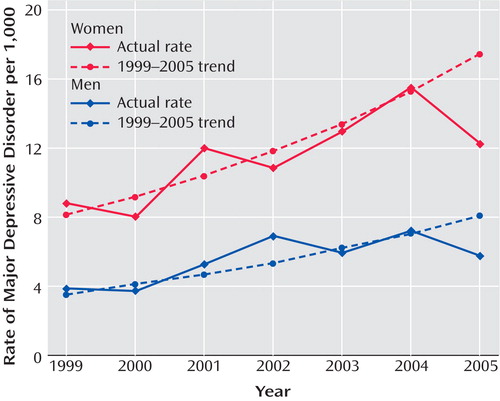
We computed the rate of depression diagnosis among adult managed care enrollees during calendar years 1999–2005, expressed as the number of diagnosed cases of depression per 1,000 enrollees per year.
Type of Depressive Episode Diagnosed
We computed the percentage of diagnosed adult depressive episodes that were classified as new episodes (ICD-9 codes 296.2, 300.4, or 311 with no previous episodes recorded) or recurrent episodes (ICD-9 code 296.3 or ICD-9-CM codes 296.2, 300.4, or 311 with one or more previous unique depressive episodes recorded).
Provider Types Who Diagnosed Depression
We computed the percentage of depressive episodes that were diagnosed by each of the following types of providers: primary care physician (primary care, internal medicine, or obstetrics-gynecology), psychiatrist, other mental health provider (psychologist, social worker, or therapist), other specialty (not already listed), or unknown specialty.
Antidepressant Drug Prescribing for Depression
We computed the percentage of depressive episodes for which the following types of prescription were filled within 30 days of the diagnosis date: SSRI, serotonin-norepinephrine reuptake inhibitor (SNRI), tricyclic antidepressant, other antidepressant, or multiple antidepressants (of any class, concurrently or consecutively); we also included the category “no antidepressants prescribed.” This measure required that cohorts have at least 30 days of follow-up.
Types of Providers Prescribing Antidepressants for Depression
We computed the percentage of antidepressant prescriptions filled within 30 days of the diagnosis date that were written by the following types of provider: primary care physician, psychiatrist, other mental health provider, other specialty (not already listed), or unknown specialty. This measure required that cohorts have at least 30 days of follow-up.
Timing of Initial Antidepressant Prescription
We computed the percentage of antidepressant prescriptions filled during the following time windows after the diagnosis date: within 30 days; between 31 and 180 days; and not at all within 180 days. This measure required at least 180 days of follow-up.
Use of Psychotherapy After Diagnosis of Depression
We computed the percentage of episodes of depression for which any patient visit was coded as psychotherapy within 180 days of the diagnosis date. This measure required at least 180 days of follow-up.
Use of Alternatives to Antidepressants After Diagnosis of Depression
We computed the percentage of episodes of depression for which a prescription for an atypical antipsychotic drug (GPI 590700, 591520, 591530, 591540, 591570, 592500, or 594000) or an anxiolytic drug (GPI 601000–609980) was filled within 30 days of diagnosis. This measure required at least 30 days of follow-up.
Statistical Analysis
The first analysis was conducted to determine rates of diagnosis of depression in the general managed care population. Total numbers of unique diagnoses of depression were determined from the physician visit file. Population sizes were provided by PharMetrics as single annual counts by age and gender bands for 7 calendar years (1999–2005). Because of the small number of data time points and the binomial distribution of the numerator and denominator data, a linear regression line was fit on a logit scale. This regression line was fit to years 1999–2004 and was used to estimate a predicted rate for 2005. A t test was used to compare this predicted rate with the observed rate for 2005.
The second set of analyses focused on the process-of-care measures among monthly cohorts of subjects diagnosed with depression. Segmented time-series regression analysis was used. This method is the most common for evaluating effects of an “interruption” that occurs at a specific point in a time series (14 – 16) —in this case, the October 2003 FDA advisory. The time series spanned 79–84 months, depending on follow-up restrictions, with 60 months before and up to 24 months after the FDA advisory was issued, which is well above the rule-of-thumb recommendations of 12 observations each before and after the interruption (15) .
Monthly measures were first plotted in order to examine patterns over the 7-year period. The timing of the interruption was selected by inspection of these plots and was varied to establish robust findings. Segmented time-series regression models were used to measure the effect of the October 2003 FDA advisory on each process-of-care measure; the linear regression models included variables to test for changes in level (mean) and rate (slope) after the FDA advisory compared with preadvisory estimations. Given the large sample sizes, normality was assumed and linear regression was deemed appropriate. Details on model specification can be found in our report on the pediatric investigation (6) .
Because measures were time dependent, errors were inspected for correlation (15) . Autocorrelation was investigated using correlograms (residuals versus time) and the Durbin-Watson test statistic produced by Stata (17 – 19) . First-order autocorrelation was detected for each process-of-care measure and was adjusted for by estimating the autocorrelation parameter and including it in each regression model (15) . Final models were implemented using autoregressive-moving average (ARMA) interrupted time-series models in Stata (17) .
Results
The final study population consisted of 475,838 episodes of depression in 400,111 adults. The patients’ mean age was 41.7 years (SD=12.9); 71.3% were female, and 8.7% were receiving Medicaid benefits at the time of diagnosis.
Figure 1 presents the annual rates of depression in the adult general managed care enrollee population (ages 19–89) by gender from 1999 to 2005. From 1999 to 2004, the rate of diagnosed episodes of depression increased steadily from approximately 6 to 11 per 1,000 enrollees, and in 2005 the rate decreased sharply. For both men and women, the observed 2005 rate was significantly lower than the rate predicted from the regression line (p<0.0001), which indicates that the observed rate in 2005 was significantly lower than would have been expected on the basis of the trend over the previous 6 years. For men, the observed rate of diagnosed new episodes in 2005 was 5.8 per 1,000 enrollees, whereas the trend predicted a rate of 8.0 (38% higher than observed). For women, the observed rate in 2005 was 12.4 per 1,000 enrollees, whereas the trend predicted a rate of 17.4 (40% higher).
In time-series regressions, measures were monthly aggregates of new episodes of adult depression comprising the cohort that accrued in each month, so each monthly observation is a national measure of new cases of depression in that period ( Table 1 ). Although statistical models were estimated using monthly aggregates, we report annualized results for ease of interpretation. The first two columns report the preadvisory mean level and trend (slope), followed by the postadvisory mean level and slope. The slope change from the pre- to the postadvisory period indicates the effect of the policy change. There were no statistically or clinically significant changes in mean levels, as is evident in the graphical representations of selected series. The 5-year preadvisory trend was used to forecast to September 2005, and a t test was used to compare the observed rate for September 2005 with this forecast estimate. The last column specifies the percentage of the projected value accounted for by the observed value.
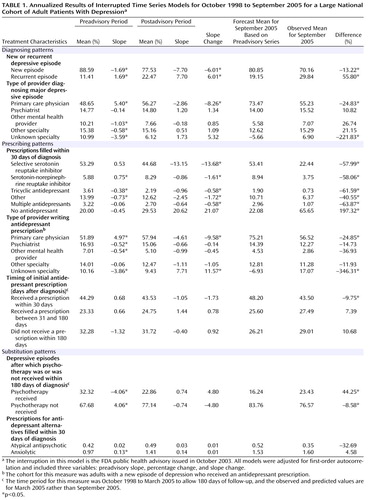
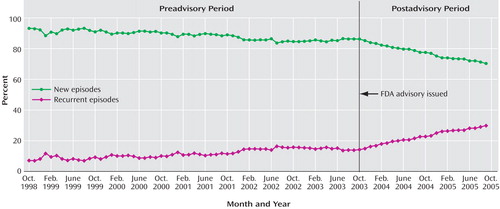
Table 1 presents diagnosed depressive episodes classified as either new or recurrent. In the preadvisory period, new cases averaged more than 88% and declined slightly (at a –1.69% annual rate); after the advisory was issued, new cases fell to 78% and declined faster (–7.70% annual rate). The observed percentage of new episodes in September 2005 was 70.16%, significantly lower than the proportion forecast on the basis of the preadvisory trend (80.85%). Figure 2 presents the time series of new and recurrent episodes among all depression diagnoses.
Diagnosing patterns were measured by the percentage of new adult depressive episodes that were diagnosed by each provider type for each national monthly cohort. These were mutually exclusive categories that summed to 100%. Prior to the advisory, nearly half of adult depressive episodes were diagnosed by primary care physicians, and the proportion was increasing at an annual rate of 5.40%; psychiatrists and other mental health providers diagnosed about a quarter of episodes, with a slightly declining trend. After the advisory, there were no abrupt shifts, but the rate of diagnosing new adult depressive episodes reversed significantly (p<0.01) for primary care physicians (–2.86% annual rate). The diagnosis rates among psychiatrists and other mental health providers did not significantly change after the advisory, indicating that there was little if any shifting of diagnosis patterns to specialty mental health providers. Consistent with these results, the forecast values for September 2005 were significantly lower than observed values for all but primary care physicians.
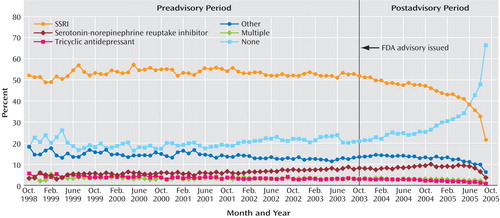
Table 1 also reports on antidepressant prescription fills within 30 days after the initial diagnosis. Before the advisory, the percentage of episodes of depression in which the patient filled a prescription for an SSRI averaged 53%, with the rate slightly increasing over time; after the advisory, there was a significant change, and the rate began to decline at an annual rate of –13.15%. The percentage forecast for September 2005 was 53.41%, more than twice the observed percentage (22.44%). Other classes of antidepressants saw similar, though more modest, prescription declines after the advisory. The preadvisory growth in SNRI prescriptions (0.75% annual rate) reversed and declined after the advisory (0.86% annual rate); a small preadvisory decline in tricyclic antidepressant prescriptions (–0.38% annual rate) accelerated slightly (–0.9% annual rate). Before the advisory, the proportion of adult depressive episodes with no antidepressant prescription within 30 days averaged 20% and was essentially unchanged from 1998 to 2003; after the advisory, however, the proportion increased to an average of 30% (with an annual growth rate of 20.62%). Figure 3 displays these times series.
Primary care physicians were writing a growing share of initial antidepressant prescriptions before the advisory was issued (4.97% annual rate); after the advisory was issued, the rate reversed significantly (–4.61% annual rate). This reversal is reflected in the significant difference between the forecast percentage (75.21%) and the observed percentage (56.52%) in September 2005. The shares of prescription fills written by psychiatrists and other mental health providers were slowly declining (–0.52% and –0.54% annual rates, respectively); after the advisory, rates decreased, although not significantly, for psychiatrists (–0.66% annual rate) and other mental health providers (–0.99% annual rate). The time series of prescribing patterns by provider type are presented in Figure 4 .
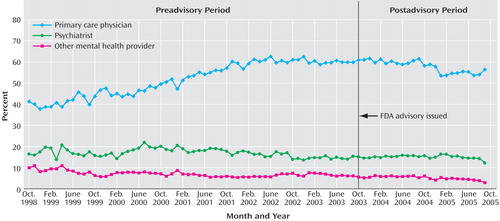
Table 1 also reports pre- and postadvisory trends in the timing of initial antidepressant prescriptions filled after the diagnosis. There were no significant changes in either the level or trend in the percentage of prescriptions filled in these time windows. Thus, no shift was apparent from earlier toward later antidepressant prescribing for adults diagnosed with depression after the 2003 advisory was issued.
Lastly, Table 1 presents models of change in prescriptions for possible alternatives to antidepressants. Before the advisory, the trend in receiving at least one visit for psychotherapy was declining at a significant rate of 4.06% annually, and there was no statistically significant change after the advisory. Before the advisory, the percentages of depressive episodes for which prescriptions for atypical antipsychotics or anxiolytics were filled within 30 days of diagnosis were low, at mean levels of 0.42% and 0.97%, respectively, and here too, there was no statistically significant change after the advisory.
Discussion
Time-series analyses of patterns of treatment of adult depression in the community showed statistically and clinically significant spillover effects associated with the 2003 FDA public health advisory and related warnings about a risk of suicidality in pediatric patients treated with antidepressants. After these pediatric warnings were issued, diagnoses of adult depression declined, and among adults diagnosed with depression, antidepressant use declined, with no other treatment modalities increasing to compensate.
At the managed care population level, the observed decreases in rates of diagnosis of adult depression among both women and men were statistically and clinically significant. Rates of diagnosis of new episodes declined sharply after the FDA advisory was issued, with a corresponding increase in recurrent episodes. It may be that the decline in new cases of depression occurred because clinicians became less likely to diagnose depression or because patients became less likely to disclose problems that may lead to a diagnosis of depression, or both. The motivation for avoiding diagnosis may come from ambivalence about making a decision about the use of antidepressants given the controversy and popular press coverage surrounding the FDA hearings. This study cannot shed light on these issues but rather documents significant reductions in new diagnoses of depression and for those patients, significant reductions in prescriptions of antidepressants. The observed rates of recurrent depression may suggest a simple mathematical relationship—total cases of depression as well as new cases are declining, so the recurrent cases are increasing on balance. Another interpretation is that because recurrent cases are not also decreasing, clinicians and patients currently being treated, or having had depression treatment before, are more comfortable continuing this course due to their own experience. Other possible explanations for the observed decrease in diagnosis of new cases include decreased coverage or increased restrictions on managed mental health care visits or prescribing of antidepressants, patients leaving managed health care plans, or other unmeasured factors that were coincident with the 2003 advisory.
The observed decline in primary care physicians’ diagnoses of adult depression was not offset by significantly increased diagnoses by psychiatrists, leaving a variety of specialty providers to shoulder a greater diagnostic load for this condition. This raises concerns about the ability of these specialists to manage cases and monitor patients, especially in light of national efforts to increase recognition and enhance evidence-based treatments of depression in primary care. Among patients with new episodes of depression, rates of prescriptions for antidepressant drugs of all classes decreased significantly after the October 2003 FDA advisory, and the drop was particularly dramatic for the SSRIs. A clear shift was observed toward decreased use of antidepressants, even among patients with a diagnosis of depression, for whom clinical guidelines recommend antidepressants as first-line treatment.
The use of potential substitute therapies—psychotherapy and pharmacotherapeutic alternatives to antidepressants (i.e., atypical antipsychotics and anxiolytics)—did not significantly change from the pre- to the postadvisory period. Thus, there was no support for a substitution effect at the aggregate level.
We identified the same trends in diagnosis and treatment of depression in children and adolescents (6) , which may have been expected outcomes given the pediatric focus of the 2003 FDA advisory, whereas these findings for adults may have been unexpected. Our results suggest that the FDA’s October 2003 warnings were associated with changes in the patterns of care for depression among both pediatric and adult managed care enrollees. Subsequent analyses of the effect of the warnings on suicide rates and other patient outcomes are important future studies.
Limitations to this study are those associated with measurement error in claims records, such as inaccuracies and underreporting due to intentional or unintentional bias (20 – 23) . Likewise, depression care obtained outside the managed care plan would not be captured. Nevertheless, these data populated a national cohort of new adult depression episodes, allowing us to measure effects of a major policy change on community care.
This study showed significant changes in community treatment of depression. The FDA’s drug safety policy has moved toward broader and more proactive communication of new safety warnings for marketed drugs (24) , and efforts are being made to improve timely identification of potential risks and hazards of new treatments (25) . The present findings underscore the need for careful consideration of unintended consequences of warnings about drug safety concerns by regulatory agencies and pose challenges for protecting patients while offering efficacious treatments.
1. Demyttenaere K, Bruffaerts R, Posada-Villa J, Gasquet I, Kovess V, Lepine JP, Angermeyer MC, Bernert S, de Girolamo G, Morosini P, Polidori G, Kikkawa T, Kawakami N, Ono Y, Takeshima T, Uda H, Karam EG, Fayyad JA, Karam AN, Mneimneh ZN, Medina-Mora ME, Borges G, Lara C, de Graaf R, Ormel J, Gureje O, Shen Y, Huang Y, Zhang M, Alonso J, Haro JM, Vilagut G, Bromet EJ, Gluzman S, Webb C, Kessler RC, Merikangas KR, Anthony JC, Von Korff MR, Wang PS, Brugha TS, Aguilar-Gaxiola S, Lee S, Heeringa S, Pennell BE, Zaslavsky AM, Ustun TB, Chatterji S; WHO World Mental Health Survey Consortium: Prevalence, severity, and unmet need for treatment of mental disorders in the World Health Organization World Mental Health Surveys. JAMA 2004; 291:2581–2590Google Scholar
2. Wells KB, Stewart A, Hays RD, Burnam MA, Rogers W, Daniels M, Berry S, Greenfield S, Ware J: The functioning and well-being of depressed patients: results from a medical outcome study. JAMA 1989; 262:914–919Google Scholar
3. Wang PS, Patrick A, Avorn J, Azocar F, Ludman E, McCullough J, Simon G, Kessler RC: The costs and benefits of enhanced depression care to employers. Arch Gen Psychiatry 2006; 63:1345–1353Google Scholar
4. Wang PS, Demler O, Olfson M, Pincus HA, Wells KB, Kessler RC: Changing profiles of service sectors used for mental health care in the United States. Am J Psychiatry 2006; 163:1187–1198Google Scholar
5. deGruy FV III: A note on the partnership between psychiatry and primary care (editorial). Am J Psychiatry 2006; 163:1487–1489Google Scholar
6. Libby AM, Brent DA, Morrato EH, Orton HD, Allen R, Valuck RJ: Decline in Treatment of Pediatric Depression After FDA Advisory on Risk of Suicidality With SSRIs. Am J Psychiatry 2007; 164:884–891Google Scholar
7. PharMetrics Inc: PharMetrics Database User Manual. Watertown, Mass, PharMetrics, 2002Google Scholar
8. National Committee for Quality Assurance: HEDIS Volume 2: Technical Specifications. Washington, DC, National Committee for Quality Assurance, 2004Google Scholar
9. Scholle SH: NCQA behavioral health measurement efforts. J Manag Care Pharm 2005; 11(3 suppl):S9–S11Google Scholar
10. Rost K, Dickinson LM, Fortney J, Westfall J, Hermann RC: Clinical improvement associated with conformance to HEDIS-based depression care. Ment Health Serv Res 2005; 7:103–112Google Scholar
11. National Committee for Quality Assurance: The State of Health Care Quality 2005. Washington, DC, National Committee for Quality Assurance, 2005Google Scholar
12. Emslie G, Rush A, Weinberg W, Kowatch R, Hughes C, Carmody T, Rintelmann J: A double-blind, randomized, placebo-controlled trial of fluoxetine in children and adolescents with depression. Arch Gen Psychiatry 1997; 54:1031–1037Google Scholar
13. Rosack J: New data show declines in antidepressant prescribing. Psychiatr News 2005; 40:1Google Scholar
14. Cook TD, Campbell DT: Quasi Experimentation: Design and Analysis Issues for Field Settings. Chicago, Rand McNally, 1979Google Scholar
15. Wagner AK, Sourmerai SB, Zhang F, Ross-Degnan D: Segmented regression analysis of interrupted time series studies in medication use research. J Clin Pharm Ther 2002; 27:299–309Google Scholar
16. Catalano R, Libby A, Snowden L, Cuellar AE: The effect of capitated financing on mental health services for children and youth: the Colorado experience. Am J Public Health 2000; 90:1861–1865Google Scholar
17. Stata: Intercooled Stata for Windows. College Station, Tex, Stata Corporation, 2006Google Scholar
18. Durbin J, Watson G: Testing for serial correlation in least squares regression. Biometrika 1951; 37:409–428Google Scholar
19. Ostrom C: Time series analysis, in Sage Publications University Papers Series on Quantitative Applications in the Social Sciences, vol 07-009. Thousand Oaks, Calif, Sage Publications, 1990Google Scholar
20. Spettell C, Wall T, Allison J, Calhoun J, Kobylinski R, Fargason R, Kiefe C: Identifying physician-recognized depression from administrative data: consequences for quality measurement. Health Serv Res 2003; 38:1081–1102Google Scholar
21. Rost K, Smith R, Matthews D, Guise B: The deliberate misdiagnosis of major depression in primary care. Arch Fam Med 1994; 3:333–337Google Scholar
22. Hirschfeld RM, Keller MB, Panico S, Arons BS, Barlow D, Davidoff F, Endicott J, Froom J, Goldstein M, Gorman JM, Marek RG, Maurer TA, Meyer R, Phillips K, Ross J, Schwenk TL, Sharfstein SS, Thase ME, Wyatt RJ: The National Depressive and Manic-Depressive Association consensus statement on the undertreatment of depression. JAMA 1997; 277:333–340Google Scholar
23. Lemelin J, Hotz S, Swensen R, Elmslie T: Depression in primary care: why do we miss the diagnosis? Can Family Physician 1994; 40:104–108Google Scholar
24. Food and Drug Administration: FDA’s New Drug Safety Initiative. May 5, 2005. http://www.fda.gov/cder/drugsafety.htmGoogle Scholar
25. Food and Drug Administration: Draft Guidance for Industry on the Food and Drug Administration’s “Drug Watch” for Emerging Drug Safety Information. Washington, DC, Food and Drug Administration, May 10, 2005Google Scholar