Functional Neuroimaging Evidence for Hyperarousal in Insomnia
Abstract
OBJECTIVE: The authors investigated the neurobiological basis of poor sleep and daytime fatigue in insomnia. METHOD: [18F]Fluorodeoxyglucose positron emission tomography was used to assess regional cerebral glucose metabolism of seven patients with insomnia and 20 healthy subjects. RESULTS: Compared with healthy subjects, patients with insomnia showed greater global cerebral glucose metabolism during sleep and while awake, a smaller decline in relative metabolism from waking to sleep states in wake-promoting regions, and reduced relative metabolism in the prefrontal cortex while awake. CONCLUSIONS: Subjectively disturbed sleep in patients with insomnia is associated with greater brain metabolism. The inability to fall asleep may be related to a failure of arousal mechanisms to decline in activity from waking to sleep states. Further, daytime fatigue may reflect decreased activity in the prefrontal cortex resulting from inefficient sleep.
Despite the suffering caused by an inability to sleep at night, as well as relationships between insomnia and mental disorders (1), the brain mechanisms of “hyperarousal” (2, 3) in insomnia are not known. Preclinical studies (4) show that the ascending reticular activating system, hypothalamus, and basal forebrain promote wakefulness. Electroencephalographic (EEG) sleep studies have limited ability to discriminate insomnia (5) and do not provide information on function in these deep brain structures. Functional neuroimaging studies, however, have shown that brain activity declines from waking to sleep states in the brainstem and thalamus as well as in the prefrontal cortex (6). Following sleep deprivation, there are metabolic reductions in the thalamus, frontal cortex, and parietal cortex (7) that correlate with impaired cognition and greater fatigue.
We used the [18F]fluorodeoxyglucose (FDG) positron emission tomography (PET) method to assess cerebral glucose metabolism in patients with insomnia and healthy subjects while awake and during non-REM sleep. We hypothesized that patients with insomnia would have higher whole brain metabolism while awake and during sleep; that the sleep difficulties of patients with insomnia may be the result of a failure of wake-promoting brain structures to decline in metabolism from waking to sleep states; and that the daytime fatigue of patients with insomnia may be explained by reductions in waking metabolism in thalamocortical networks, especially the prefrontal cortex, given that such changes have been seen following sleep deprivation (7).
Method
Four women and three men with primary insomnia and 13 healthy women and seven healthy men were studied. The mean age of the patients with insomnia was 34.2 years (SD=8.9); the mean age of the healthy subjects was 32.6 (SD=8.4). After complete description of the study to the subjects, written informed consent was obtained from all participants. To ensure a representative clinical group of patients with insomnia, we based our inclusion criteria entirely on subjective reports assessed in a standardized interview (8). Insomnia subjects were required to meet DSM-IV criteria for primary insomnia as indicated by 1) a complaint of difficulty falling asleep, staying asleep, or nonrestorative sleep, 2) duration of ≥1 month, 3) the sleep disturbance causes clinically significant distress or impairment, 4) insomnia does not occur exclusively during the course of a mental disorder, and 5) insomnia is not due to another medical or sleep disorder or effects of medications/substance abuse. Nightly urine drug screens were obtained during the sleep study to ensure abstinence from substances of abuse. Any subject—patient or comparison subject—who was using any medications that might affect sleep or regional cerebral metabolism was excluded from the study. Therefore, all subjects were studied in an unmedicated state.
Patients and comparison subjects who had irregular sleep schedules associated with shift work, frequent travel, or personal preference (as indicated by weekly variation of >3 hours in bedtime or wake time, or time in bed duration <5.5 or >10 hours per night) were excluded from the study. Patients and comparison subjects who had excessive use of caffeine (>300 mg or three cups of coffee per day) were also excluded, as were patients who met criteria for a major depressive disorder or other mental disorder on the basis of a Structured Clinical Interview for DSM-IV (6, 9).
Sleep quality and daytime mood and function were assessed by using the Pittsburgh Sleep Quality Index (10) and the Profile of Mood States (POMS) (11). Patients with insomnia were required to have Pittsburgh Sleep Quality Index scores >7, indicating poor sleep quality; Pittsburgh Sleep Quality Index scores >5 are reliably associated with sleep disorders in young adults.
EEG sleep was monitored on nights 1, 2, and 3 according to standard methods. Night 1 was used as an adaptation night and for screening other sleep disorders such as sleep apnea and periodic limb movement disorder. Night 2 records were scored visually for sleep staging (12). All non-REM episodes from this night were subjected to automated analyses for determination of EEG spectral power (13).
Regional cerebral glucose metabolism was assessed during both waking and non-REM sleep states by using the FDG PET method (6, 9). The non-REM PET scan reflected brain activity over a 20-minute period beginning 20 minutes after sleep onset on the third night of sleep, and the waking PET scan reflected brain activity over a 20-minute period on the morning following the second night of sleep. Image analysis included statistical parametric mapping and magnetic resonance-guided whole brain region-of-interest analyses (6). A modified simplified kinetic method was used as an indirect measure of absolute glucose metabolism (6).
We used t tests to assess differences between patients and comparison subjects. A repeated-measures analysis of variance (ANOVA) (groups=comparison subjects and patients with insomnia; repeated measures=waking and non-REM sleep states) was used to test for group and state effects and group-by-state interactions in glucose metabolism. Differences in relative regional metabolism between waking and non-REM sleep states for each group, as well as group-by-state interactions were tested by using a statistical parametric mapping program (SPM 99) (14). Waking and non-REM sleep PET images of patients with insomnia and comparison subjects were entered into an analysis of covariance that used global metabolism and age (15) as covariates. Statistical maxima were identified by their Talairach-Tournoux atlas (x, y, z) coordinates (16).
Results
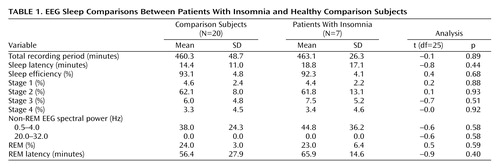
Healthy subjects reported better sleep quality (Pittsburgh Sleep Quality Index mean score=2.1, SD=1.6) than insomnia subjects (Pittsburgh Sleep Quality Index mean score=11.9, SD=3.4) (t=–9.6, df=21, p<0.001). Patients with insomnia scored worse on POMS measures of daytime concentration (healthy subjects’ mean score=3.1, SD=1.3; insomnia patients’ mean score=4.7, SD=2.2) (t=–2.4, df=25, p=0.02) and fatigue (healthy subjects’ mean score=2.5, SD=2.5; insomnia patients’ mean score=8.7, SD=6.2) (t=–3.8, df=25, p=0.001). The two groups did not differ on any visually scored or automated measure of sleep (Table 1). The two groups did not differ in terms of meals preceding PET scans or in terms of body mass index (healthy subjects’ mean body mass index=23.9, SD=3.8; insomnia patients’ mean body mass index=24.8, SD=2.0) (t=–0.58, df=25, p=0.57).
A repeated-measures ANOVA was performed on the indirect measure of whole brain metabolism, glucose metabolism (repeated measure=glucose metabolism across the state of waking and the state of non-REM sleep; groups=insomnia patients and healthy subjects). Significant group effects (insomnia patients > healthy subjects) (F=6.79, p=0.017), as well as state effects (waking > non-REM sleep) (F=31.5, p<0.001) were noted, but no group-by-state interaction was found.
After controlling for any differences in whole brain metabolism, we performed a repeated-measures ANOVA on a regional voxel-by-voxel basis across the entire brain using SPM 99. Healthy subjects showed reductions in relative metabolism from waking to non-REM sleep states in bilateral frontal, anterior cingulate, and medial prefrontal cortices (left x=–18, y=52, z=16, maximum t=5.7, 2935 voxels, and right x=34, y=54, z=8, maximum t=5.3, 2912 voxels), left occipitoparietal cortex and posterior cingulate cortices (x=8, y=–78, z=32, maximum t=4.9, 2882 voxels), and right temporoparietal cortex (x=56, y=–56, z=16, maximum t=4.3, 2301 voxels), and in the thalamus (x=–2, y=–20, z=8, maximum t=3.4, 180 voxels). (Note: all clusters reported are significant at p<0.05, corrected; coordinates refer to local cluster maxima and maximum t to the corresponding t value.)
In patients with insomnia, a similar decline in relative metabolism from waking to non-REM sleep states was observed in the bilateral frontal cortex (left x=–29, y=52, z=0, maximum t=6.1, 2425 voxels, and right x=24, y=34, z=–16, maximum t=5.2, 2311 voxels), right occipitoparietal cortex (x=–2, y=–70, z=28, maximum t=4.9, 3213 voxels), and a smaller region of the left temporoparietal cortex (x=–44, y=–54, z=36, maximum t=3.86, 619 voxels). However, no significant differences were seen in the thalamus, anterior cingulate cortex, or medial prefrontal cortex.
A group-by-state interaction analysis (Figure 1) confirmed that patients with insomnia showed a smaller decrease than did healthy subjects in relative metabolism from waking to non-REM sleep states in the ascending reticular activating system, hypothalamus, thalamus, insular cortex, amygdala, and hippocampus (x=28, y=–44, z=–20, maximum t=5.61, 3403 voxels) and in the anterior cingulate and medial prefrontal cortices (x=6, y=–10, z=40, maximum t=4.00, 1194 voxels).
While awake (Figure 1), patients with insomnia showed hypometabolism in relation to healthy subjects in a broad region of the frontal cortex bilaterally, in the left hemisphere superior temporal, parietal, and occipital cortices, and in the thalamus, hypothalamus, and brainstem reticular formation.
Discussion
These findings demonstrate a brain basis for the sleep disturbances and daytime fatigue reported by patients with insomnia. The pattern of whole brain hypermetabolism across waking and sleep states and the failure of wake-promoting structures to decline in metabolism from waking to sleep states suggest that the higher cerebral metabolism in non-REM sleep in patients with insomnia may be due to a lack of a reduction in activity in these subcortical structures in the transition from waking to sleep. The reduced relative waking metabolism in the prefrontal cortex in patients with insomnia suggests that these patients are chronically sleep deprived, perhaps from inefficient sleep (7). Our findings are provocative given the absence of traditional polysomnographic differences in the insomnia group.
These findings suggest interacting neural networks in the neurobiology of insomnia, including a general arousal system (ascending reticular formation and hypothalamus), an emotion-regulating system (hippocampus, amygdala, and anterior cingulate cortex), and a cognitive system (prefrontal cortex). Future studies are needed to determine how mental-disorder-specific alterations in the function of components of these networks affect overall function in the entire network in producing the different sleep complaints observed in patients with mental disorders. Future work is also needed to determine the impact of interventions on altering function in these networks to alleviate the sleep complaints of patients with mental disorders, alter the clinical course of the mental disorder itself, and potentially reduce future risk for the development of mental disorders.
 |
Received Nov. 26, 2003; revision received Jan. 9, 2004; accepted Jan. 20, 2004. From the Department of Psychiatry, University of Pittsburgh School of Medicine. Address reprint requests to Dr. Nofzinger, Western Psychiatric Institute and Clinic, Sleep Neuroimaging Research Program, Department of Psychiatry, University of Pittsburgh School of Medicine, 3811 O’Hara St., Pittsburgh, PA 15213–2593; [email protected] (e-mail). Supported in part by NIMH grants MH-61566, MH-66227, MH-01414, MH-30915, RR-00056, and MH-24652.

Figure 1. Brain Structures That Did Not Show Decreased Metabolic Rate From Waking to Sleep States in Patients With Insomnia (A) and Brain Structures Where Relative Metabolism While Awake Was Higher in Healthy Subjects Than in Patients With Insomnia (B)a
aDifferences in all regions shown reached statistical significance at the p<0.05, corrected, level.
1. Ohayon MM: Epidemiology of insomnia: what we know and what we still need to learn. Sleep Med Rev 2002; 6:97–111Crossref, Medline, Google Scholar
2. Bonnet MH, Arand DL: Hyperarousal and insomnia. Sleep Med Rev 1997; 1:97–108Crossref, Medline, Google Scholar
3. Spielman AJ, Caruso LS, Glovinsky PB: A behavioral perspective on insomnia treatment. Psychiatr Clin North Am 1987; 10:541–553Crossref, Medline, Google Scholar
4. Steriade M: The corticothalamic system in sleep. Front Biosci 2003; 1:D878-D899Google Scholar
5. Rosa RR, Bonnet MH: Reported chronic insomnia is independent of poor sleep as measured by electroencephalography. Psychosom Med 2000; 62:474–482Crossref, Medline, Google Scholar
6. Nofzinger EA, Buysse DJ, Miewald JM, Meltzer CC, Price JC, Sembrat RC, Ombao H, Reynolds CF, Monk TH, Hall M, Kupfer DJ, Moore RY: Human regional cerebral glucose metabolism during non-rapid eye movement sleep in relation to waking. Brain 2002; 125(part 5):1105–1115Google Scholar
7. Thomas M, Sing H, Belenky G, Holcomb H, Mayberg H, Dannals R, Wagner H, Thorne D, Popp K, Rowland L, Welsh A, Balwinski S, Redmond D: Neural basis of alertness and cognitive performance impairments during sleepiness, I: effects of 24 h of sleep deprivation on waking human regional brain activity. J Sleep Res 2000; 9:335–352Crossref, Medline, Google Scholar
8. Schramm E, Hohagen F, Grasshoff U, Riemann D, Hajak G, Weess HG, Berger M: Test-retest reliability and validity of a Structured Interview for Sleep Disorders According to DSM-III-R. Am J Psychiatry 1993; 150:867–872Link, Google Scholar
9. Nofzinger EA, Buysse DJ, Germain A, Carter CS, Luna B, Price JC, Meltzer CC, Miewald JM, Reynolds CF III, Kupfer DJ: Increased activation of anterior paralimbic and executive cortex from waking to rapid eye movement sleep in depression. Arch Gen Psychiatry 2004; 61:695–702Crossref, Medline, Google Scholar
10. Buysse DJ, Reynolds CF III, Monk TH, Berman SR, Kupfer DJ: The Pittsburgh Sleep Quality Index: a new instrument for psychiatric practice and research. Psychiatry Res 1989; 28:193–213Crossref, Medline, Google Scholar
11. McNair DM, Lorr M, Droppleman LF: Manual for the Profile of Mood States. San Diego, Educational and Industrial Testing Service, 1971Google Scholar
12. Rechtschaffen A, Kales A (eds): A Manual of Standardized Terminology, Techniques and Scoring System for Sleep Stages of Human Subjects: NIH Publication 204. Bethesda, Md, Public Health Service, National Institutes of Health, 1968Google Scholar
13. Vasko RC, Brunner DP, Monahan JP, Doman J, Boston JR, El-Jaroudi A, Miewald J, Buysse DJ, Reynolds CF, Kupfer DJ: Power spectral analysis of EEG in a multiple-bedroom, multiple-polygraph sleep laboratory. Int J Med Inform 1997; 46:175–184Crossref, Medline, Google Scholar
14. Friston KJ, Frith CD, Liddle PF, Frackowiak RS: Comparing functional (PET) images: the assessment of significant change. J Cereb Blood Flow Metab 1991; 11:690–699Crossref, Medline, Google Scholar
15. Willis MW, Ketter TA, Kimbrell TA, George MS, Herscovitch P, Danielson AL, Benson BE, Post RM: Age, sex and laterality effects on cerebral glucose metabolism in healthy adults. Psychiatry Res 2002; 114:23–37Crossref, Medline, Google Scholar
16. Talairach J, Tournoux P: Co-Planar Stereotaxic Atlas of the Human Brain: Three-Dimensional Proportional System. New York, Thieme Medical, 1988Google Scholar