Quality Indicators and Monitoring of Mental Health Services: What Do Frontline Providers Think?
Abstract
OBJECTIVE: Many health care organizations are giving feedback to mental health care providers about their performance on quality indicators. Mental health care providers may be more likely to respond to this feedback if they believe the indicators are meaningful and within their “sphere of influence.” The authors surveyed frontline mental health care providers to elicit their perceptions of widely used indicators for quality monitoring in mental health services. METHOD: The survey was distributed to a stratified, random sample of 1,094 eligible mental health care providers at 52 Department of Veterans Affairs facilities; 684 (63%) returned the survey. The survey elicited perceptions of 21 widely used indicators in five quality domains (access, utilization, satisfaction, process, and outcomes). The data were analyzed with descriptive and multivariate methods. RESULTS: Most mental health care providers (65%) felt that feedback about these widely used indicators would be valuable in efforts to improve care; however, only 38% felt able to influence performance related to these monitors and just 13% were willing to accept incentives/risk for their performance. Providers were most positive about satisfaction monitors and preferentially included satisfaction, access, and process monitors in performance sets to measure overall quality. Despite providers’ relatively positive views of monitors, 41% felt that monitoring programs did not assist them in improving care. Providers cited numerous barriers to improving care processes. CONCLUSIONS: Mental health care providers may be more receptive to monitoring efforts if satisfaction, access, and process monitors are emphasized. However, providers’ views of monitoring programs appear to be less affected by concerns about specific monitors than by concerns about the accuracy of quality measurement and barriers to changing care processes.
For many years, managed care organizations have attempted to influence providers’ behavior and control costs by giving them feedback about their resource utilization (1). In response to public concerns about service quality, many managed care organizations are now giving feedback to providers about their performance on quantitative, rate-based measures of quality—often called quality indicators or monitors (2). Several task forces have called for the increased use of such indicators for mental health services (3).
Quality indicators have been developed that tap a variety of the domains thought to underlie high-quality care. Commonly used monitors for mental health services include measures of access (e.g., time to first appointment after hospital discharge), utilization (e.g., average length of inpatient stays), care processes (e.g., adequate trials of antidepressants for patients with major depression), and outcomes (e.g., changes in scores on standardized psychiatric rating scales). Quality monitors are becoming more widely used with the dissemination of clinical guidelines and the popularization of industrial quality management techniques (4). Health care organizations that adopt guidelines often use these quantitative measures to determine if the guidelines are being followed (5).
Unfortunately, the process of collecting data and constructing monitors is costly (6), and feedback about monitor performance may or may not improve care. Study findings have been conflicting about whether providers make meaningful changes in their practices in response to audit and feedback (1, 7–9), with some studies reporting changes in practices, particularly if feedback is ongoing and coupled with incentives, and others reporting no or only minimal practice changes (7). A meta-analysis of 12 studies found that feedback resulted in statistically significant but clinically minimal changes in the use of recommended care processes (10).
Providers may fail to respond to feedback for a variety of reasons. They may not perceive particular indicators to be meaningfully related to the quality of care (11, 12), or they may feel that inaccurate data were used in constructing the indicators (13). Providers may also feel they have insufficient time or resources to change indicator performance (12), or they may be concerned about the uses of collected data.
To increase providers’ response to quality feedback, developers might select monitors that providers value and feel they can influence. Unfortunately, little is known about frontline mental health care providers’ views of quality indicators and monitoring.
The goal of this study was to elicit mental health care providers’ perceptions of widely used indicators for quality monitoring in mental health services. We conducted focus groups and surveyed a large sample of frontline mental health care providers to determine if there were differences in the perceived value of widely used indicators in five quality domains. We also examined providers’ views of quality monitoring processes and patient, provider, and organizational factors that might be associated with more positive views. We believe this is the first large-scale effort to elicit the views of frontline mental health care providers. Such information may be useful in efforts to increase the relevance and effectiveness of quality improvement activities in mental health organizations.
Method
The study was approved by the Department of Veterans Affairs (VA) Ann Arbor Healthcare System Institutional Review Board.
Survey Development
We developed a preliminary survey instrument after reviewing the literature on physicians’ attitudes toward guidelines and quality monitoring (12, 14, 15) and the indicator performance sets maintained or implemented by the Department of Veterans Affairs (16), APA (17), the Joint Commission for the Accreditation of Healthcare Organizations (the National Library of Healthcare Indicators) (18), the Agency for Healthcare Research and Quality (19), the National Committee on Quality Assurance (the Health Plan Employer Data and Information Set) (20), the Foundation for Accountability (21), the American Managed Behavioral Healthcare Association (Performance Based Measures for Managed Behavioral Healthcare Organizations) (22), and the Mental Health Statistics Improvement Program Consumer-Oriented Mental Health Report Card (23).
The preliminary instrument included indicators from five quality domains (access, utilization, satisfaction, process, and outcomes) and indicators for three common mental disorders (depression, schizophrenia, and substance abuse). To ensure that survey items were understandable and pertinent, more than 130 frontline clinicians were involved in development of the survey instrument.
Ten mental health managers and clinicians reviewed the first survey draft. Five focus groups were then conducted to refine survey content and enrich our understanding of providers’ concerns (24). Each focus group consisted of 10 to 13 frontline mental health care providers from a variety of disciplines (total N=58). An experienced outside facilitator conducted the groups at three hospitals, and each group lasted approximately 90 minutes.
The facilitator asked participants about their perceptions of quality in mental health services, their familiarity with indicators and feedback, how quality monitoring had affected their work, their influence over and priorities for monitors, and their attitudes toward performance incentives. Participants spontaneously introduced discussion about barriers to effective monitoring.
Focus group sessions were audiotaped and transcribed. Six reviewers from different professional backgrounds reviewed two to five transcripts and independently identified and coded group themes. Reviewers then met and discussed all themes identified by two or more reviewers and reached a consensus regarding the most important and salient themes.
After reviewing the focus group data, we revised the survey instrument. Questions were added about barriers to effective monitoring and preferred “sets” of indicators. Subsequent survey drafts were pretested with three groups of mental health care providers (total N=75) at two hospitals. After each pretest, the instrument was revised and shortened on the basis of comments from participating clinicians.
Survey Content
The final self-administered survey contained 132 items. In addition to responding to the items outlined in the previous section, providers were asked to rate 21 general and disease-specific indicators on 5-point scales measuring how valuable they thought monitoring and feedback about the indicators would be in efforts to improve the care provided by their work group (scale anchors of 1, “very valuable,” and 5, “not at all valuable”), how much they could influence the indicators by changing care practices (scale anchors of 1, “can easily influence,” and 5, “absolutely cannot influence”), and how willing they were to accept financial incentives coupled with risk for indicator performance (scale anchors of 1, “very willing to accept,” and 5, “absolutely not willing to accept”). Other items asked about the providers’ demographic characteristics and practice characteristics. (The study survey is available upon request.)
Survey Sample
We selected a random sample of 52 facilities from a list of all VA facilities that provide mental health services. The sample was stratified by geographic region and by a VA classification system that incorporated information about facility size, teaching activity, and primary mission (general medical or neuropsychiatric). Mental health care providers within each facility were identified through a centralized personnel database, and site administrators were contacted to confirm that providers worked at the facility and were likely to meet the eligibility criteria (providing ≥8 hours of direct patient care each week and making independent treatment decisions). Within each facility, we randomly selected 67% of all eligible providers, stratified by discipline and gender, to ensure an adequate sample size.
Survey Distribution
We used a modified version of the Dillman method for mailed surveys (25). Providers received a letter notifying them about the study, followed by a survey mailing on May 4, 2000, and a reminder/thank-you card 1 week later. Depending on their response, providers received up to two additional survey mailings, occurring 3 and 7 weeks after the initial mailing. Cover letters specified that the study was conducted by a research team rather than an administrative arm of the VA and assured respondents of confidentiality.
Study Measures
Composite scales were constructed for providers’ perceptions of indicators in the five quality domains. We also constructed subscales for providers’ perceptions of value, ability to influence, and willingness to take financial incentives for each domain. Scale scores were computed if providers completed ≥50% of the scale items; the score was the mean of the items. Cronbach’s alpha for the five domain scales ranged from 0.76 to 0.90, and Cronbach’s alpha for the 15 subscales ranged from 0.63 to 0.94. We investigated whether scales assessed different constructs by examining disattenuated correlations among the scales; all dissattenuated correlations were significantly less than 1.0, indicating discriminant validity.
For several analyses, we included provider-level or facility-level variables. Providers were categorized by discipline and by whether they were “generalists” or spent ≥50% of their time treating patients with a specific diagnosis. Providers’ relative workload was calculated from items that asked about “hours spent in patient care per week” and “numbers of patients seen in an average patient care day.” Facilities were categorized as urban versus rural on the basis of Metropolitan Statistical Area designations (26), and facility size was categorized by tertiles on the basis of the total number of patients admitted to the facility in fiscal year 1999. The rating of facilities’ degree of academic affiliation was based on information collected by the Association of American Medical Colleges as part of the 1999–2000 Liaison Committee on Medical Education Annual Medical School Questionnaire; a major affiliation indicated that the institution was a major site for clinical clerkships, a limited affiliation indicated that the institution had brief or unique rotations of students, and a graduate affiliation indicated that the institution had only graduate training. The intensity of quality improvement activities at each site was determined from responses of facility quality managers to a modified version of the 1997 American Hospital Association’s survey on quality improvement activities (27).
Data Analysis
We calculated descriptive statistics for all survey items, using frequencies and means. To simplify the reporting of frequencies, providers were said to have “endorsed” an item if they circled 1 or 2 on the 5-point rating scale.
We examined differences in mean ratings for the five quality domains using a mixed linear model analysis with “provider” as the random factor. (This approach is analogous to repeated measures analysis of variance.) Bonferroni correction was used for multiple comparisons. The same procedure was used to examine differences in the ratings of clinical value and degree of provider influence across the domains. When differences in providers’ willingness to take incentives were examined, responses were rank-transformed to reduce the skewness of the distribution.
Multivariable regression models were used to analyze the relationship between overall receptivity to quality monitoring and providers’ perceptions of 1) the clinical value of indicators, 2) their ability to affect indicator performance, and 3) barriers to measurement of performance and changing performance.
Finally, we used multilevel, mixed models to investigate the association between provider-level and institutional-level predictors and two dependent variables: 1) providers’ ratings of the value of the set of 21 indicators and 2) providers’ global ratings of the value of monitoring programs. Provider-level predictors included gender, professional discipline, workload, and reported diagnostic mix of patients; facility-level predictors included facility size, urban or rural setting, degree of academic affiliation, and the intensity of quality improvement activities at the site.
All analyses were completed by using SAS software, version 8.1 (SAS, Inc., Cary, N.C.).
Results
Response Rate
The survey was mailed to 1,189 mental health care providers; 71 mental health care providers contacted us because they failed to meet eligibility criteria. Of the remaining 1,118 providers, 708 (63%) returned the survey. After reviewing survey items, 24 respondents were excluded because of ineligibility; most did not provide ≥8 hours of patient care each week. The final sample consisted of 684 providers.
Differences Between Respondents and Nonrespondents
Psychiatrists were less likely to return the survey than psychologists, nurses, and social workers. Providers at small teaching hospitals were more likely and those at large teaching hospitals were less likely to return the survey, compared with providers at other hospitals. There were no differences between respondents and nonrespondents in gender, individual facility, or region of the country.
Providers’ Demographic Characteristics and Work Settings
Most providers (69%) were between age 35 and 55 years, and 59% were men. Providers spent 70% of their professional time in patient care. Ninety-two percent identified a primary work group. Thirty-nine percent worked in outpatient mental health clinics, 12% in outpatient substance abuse clinics, 7% in posttraumatic stress disorder clinics, 7% in outreach clinics or assertive community treatment programs, 15% in inpatient settings, and 20% in both inpatient and outpatient settings or in other settings such as day hospitals and primary care liaison clinics.
Physicians, psychologists, and social workers each constituted about a quarter of the sample, and advanced practice nurses and master’s-level therapists constituted the remainder. Most providers (91%) had had exposure to quality monitoring; 72% had received feedback about inpatient use; 63% about access, 73% about patient satisfaction; 26% about care processes; and 32% about patient outcomes.
Influence and Autonomy
The large majority of providers (76%) reported having a great deal of autonomy in treatment decisions, and 48% reported having a great deal of influence within their work group. Providers’ perceived influence within their work group did not differ by discipline (χ2=10.8, df=8, p=0.22) or length of tenure in the VA (χ2=9.3, df=14, p=0.81), but men were more likely to perceive themselves as having influence than women (χ2=9.2, df=2, p<0.01). Physicians, psychologists, and advanced practice nurses reported more autonomy in treatment decisions than did social workers and other therapists (χ2=18.5, df=8, p<0.02).
Attitudes Toward Monitors and Domains
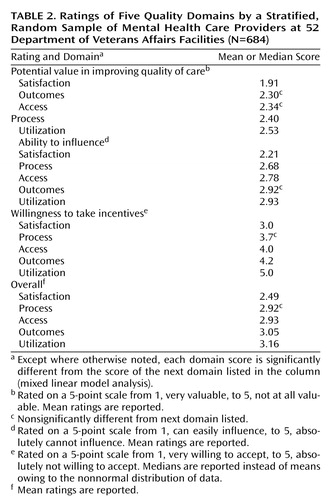
Table 1 lists the frequency with which providers endorsed the 21 individual indicators and five domains of indicators on the potential value of feedback, their ability to influence indicator performance, and their willingness to accept financial incentives/risk for performance.
Providers were more positive about the clinical value of indicators than about their ability to influence indicator performance. Sixty-five percent believed that feedback about the set of 21 indicators might be valuable in efforts to improve care, but only 38% felt able to influence performance, and just 13% were willing to accept incentives coupled with risk.
Preferred Domains of Indicators
Providers also varied significantly in their perceptions of the domains of indicators. They were most positive about indicators in the satisfaction domain; 79% felt these indicators might be helpful in efforts to improve care, 70% felt able to influence these indicators, and 34% were willing to take incentives/risk for performance. The other domains of indicators had more mixed reviews, and there were smaller differences among them. However, providers rated process and access domains more favorably than utilization and outcome domains. (Table 2 lists the ratings of domains along the three dimensions.) Although clinicians rated the potential clinical value of outcome monitors favorably, they felt less able to influence outcome monitors than to influence most other monitors.
When asked to select up to five indicators they felt would make the “best” performance set for measuring quality, providers picked indicators from an average of three different domains. The most common combination included indicators from the satisfaction, process, and access domains.
Overall View of Quality Monitoring
Although providers were relatively positive about the value of specific indicators, they were divided on whether current monitoring processes were helpful. Thirty-one percent reported that quality monitoring was valuable in their individual or work group’s efforts to improve care, 28% were neutral, and 41% reported that the process had little or no value.
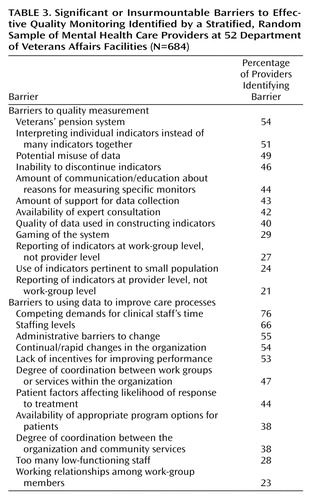
Providers reported many barriers to effective monitoring, including barriers both to having accurate quality measurement and to using data to improve care (Table 3). More than 50% identified as measurement problems factors such as the veterans’ compensation system and the use of few indicators rather than several indicators together. Fifty-five percent expressed doubt about the adequacy of case-mix adjustment. Providers also cited continuing barriers to improving care even if measurement issues were resolved. These barriers included competing time demands, inadequate staffing, administrative barriers, and lack of incentives for improving performance.
Predictors of Positive Views of Monitoring
Not surprisingly, in a regression analysis, providers who reported more positive views of monitoring processes were also those who thought indicators were potentially valuable (p<0.001), perceived a greater ability to influence monitors (p=0.02), and perceived fewer barriers to improving care (p<0.001). Providers who believed they had greater influence in their work groups also rated monitoring programs more favorably (p<0.001).
In multilevel or mixed-model analyses, provider demographics, discipline, and workload did not predict global attitudes toward monitoring. Only a few facility-level characteristics, including a nonurban location and limited rather than major medical education programs, were associated with more positive views.
Discussion
Although changing providers’ practices and improving mental health care are difficult, quality monitoring programs that carefully consider the views of frontline mental health care providers are more likely to be effective. The study reported here is, to our knowledge, the first large-scale effort to elicit frontline mental health care providers’ perceptions of widely used indicators and quality monitoring.
Despite many researchers’ and administrators’ concerns about providers’ openness to feedback (11, 12), we found that the majority of mental health care providers believed feedback about widely used indicators would be potentially valuable in efforts to improve care. However, mental health care providers expressed greater ambivalence about their ability to influence indicators and about the value of current monitoring processes.
Views of Quality Indicators/Domains
Of all domains of indicators, providers viewed satisfaction monitors most positively—perhaps because of the emphasis placed on the therapist-patient relationship in mental health treatment. Research supports a strong relationship between the therapeutic alliance and patient outcomes (28), and mental health care providers are encouraged to pay close attention to their patient relationships from the beginning of training. In addition, patients who complete satisfaction surveys often give favorable ratings to their providers (29).
Although some researchers have questioned the value of satisfaction measures because of consistently high ratings, these measures have been successful in differentiating among programs and providers, particularly if they tap multiple dimensions of care and disaggregate the components of satisfaction (30). A few studies have also found a relationship between satisfaction ratings and care processes. Meredith et al. (31) reported higher satisfaction ratings among depressed patients receiving high-quality treatment with antidepressants and/or counseling, and Druss et al. (32) found a relationship between satisfaction during inpatient psychiatric stays and administrative measures of quality.
Although providers viewed process and access indicators more favorably than outcome or utilization monitors, there were smaller differences in provider ratings among these domains. Congruent with the recent emphasis on outcomes management (33), providers gave high ratings for the value of outcome monitors, but they reported they had only a limited ability to influence these measures. Many researchers have noted that outcome monitors might be problematic despite their face validity because of poor controllability, the problem of confounding, and the need for careful case-mix adjustment (6, 34). In this study, providers expressed skepticism about the adequacy of case-mix adjustment in monitoring programs. Despite widespread use, providers perceived indicators in the utilization domain to be least valuable, perhaps because of a perceived focus on costs rather than quality.
Focus group and survey data indicated that providers were concerned about adequate breadth in quality measurement. Focus group participants emphasized the importance of taking a multidimensional view of quality, and 51% of survey respondents reported that interpreting individual indicators rather than several indicators together was a problem in quality measurement. Providers selected indicators from a variety of domains when constructing preferred performance sets, most often choosing satisfaction, process, and access indicators. Organizations may find that providers are more responsive to performance sets that have adequate breadth and emphasize these domains.
Despite several studies indicating that financial incentives are effective in changing provider behavior (1), survey respondents were reluctant to accept incentives for indicator performance. Focus group participants felt that linking incentives to indicator performance was unlikely to be constructive and that providers might be tempted to “game the system” rather than make useful changes in care (e.g., providers might refer difficult patients if held accountable for their outcomes).
Views of Current Quality Monitoring Processes
Despite favorable views about the potential value of indicators, providers were less enthusiastic about the value of current monitoring processes. Their lack of enthusiasm may have stemmed from their concerns about being able to influence monitors or the many perceived barriers to improving care. Consistent with recent developments in quality improvement, such as the continuous quality improvement movement, focus group participants emphasized the importance of embedding quality monitoring and feedback in a collegial, supervisory structure and asserted that even well-constructed indicators would not be helpful if health systems did not support meaningful change (34).
Predictors of Responsiveness to Quality Monitoring
In this study, few objective provider-level or facility-level characteristics predicted positive attitudes toward monitoring. Instead, providers who were most positive were those who reported the greatest degree of influence in their work group. This personal provider-level characteristic does not lend itself to easily identifying subgroups for whom monitoring might be implemented. However, such individuals may be opinion leaders who could champion monitoring efforts.
Design Considerations and Limitations
When interpreting study results, the study design and several potential limitations should be considered. First, selective survey response may have biased the study results; providers who were more interested in monitoring may have been more likely to respond to the survey and more or less sensitive to the shortcomings of monitoring efforts. However, our response rate (63%) was commensurate or slightly higher than that obtained by most surveys targeting physicians (35) and likely provides informative, if not perfect, results.
Second, this study reports the views of mental health care providers working within the Department of Veterans Affairs. Although we sampled providers from a large number of facilities located in diverse geographic areas, all VA providers work in a larger organization that has a commitment to quality improvement and monitoring. VA providers treat many chronically ill and disadvantaged patients, work cooperatively in teams or work groups, frequently work in teaching settings, and are salaried. Most have also been exposed to quality monitoring. Thus, the views of VA providers may not generalize to mental health care providers working in other settings.
Third, our study does not capture all barriers to effective monitoring. Our goal was to describe clinicians’ perceptions of indicators and monitoring processes. Clinicians frequently cited system-level barriers to monitoring; however, clinician factors, such as personal beliefs, behaviors, knowledge, and skill sets, may also play a role in whether monitoring programs are effective. Fourth, providers in this study were asked about their willingness to take financial incentives for performance only when coupled with risk. Providers may be more willing to accept incentives when there is no accompanying risk—although undesirable consequences such as “gaming” might still result.
Fifth, we examined differences among the disciplines in their perceived ability to influence the set of monitors rather than each individual monitor. Providers in some disciplines may have felt more or less able to influence specific monitors—for example, physicians may have felt more able to affect medication use than social workers. However, our study emphasized work groups’ collective efforts to improve care, and we found no differences among the disciplines in providers’ perceived ability to influence the set of monitors or in their perceived influence within the work group. In mental health care, work-group leaders may emerge from any discipline.
Finally, we note that our quality domain scores reflect the mean rating of the indicators within the domain and do not reflect variation in providers’ responses for individual indicators. Although quality domains provide a useful framework and our scales had adequate reliability, organizations may wish to note the endorsement of individual indicators in addition to domain scores.
Conclusions
Data from this large-scale study indicate that most frontline mental health care providers believe that feedback about widely used indicators would be valuable in improving care. However, providers are less sure of their ability to influence quality monitors and are unwilling to take incentives or assume risk for indicator performance. Providers view satisfaction monitors most favorably, and they may be most responsive to performance sets that have adequate breadth and emphasize satisfaction, process, and access monitors.
However, providers’ views of monitoring programs appear less affected by their concerns about specific monitors than their concerns about the accuracy of quality measurement and barriers to changing care processes. Even if ideal indicators are constructed, organizational support and health care milieu remain critical to translating quality data and monitoring into improvements in mental health care (34).
 |
 |
 |
Received May 29, 2002; revisions received Sept. 10 and Nov. 22, 2002; accepted March 17, 2003. From the Department of Veterans Affairs, Serious Mental Illness Treatment, Research, and Evaluation Center, Ann Arbor, Mich.; the Department of Psychiatry, University of Michigan Medical School, Ann Arbor; the School of Nursing, University of Michigan, Ann Arbor; the Department of Health Management and Policy, University of Michigan School of Public Health, Ann Arbor; and the Office of Quality and Performance, Department of Veterans Affairs, Washington, D.C. Address reprint requests to Dr. Valenstein, SMITREC (11H), Health Services Research and Development, VA Ann Arbor Healthcare System, P.O. Box 130170, Ann Arbor, MI 48113-0170; [email protected] (e-mail). Supported by grants IIR 98-102 and RCD 98-350 from the Health Services Research and Development Service, Veterans Health Administration, Department of Veterans Affairs. The views expressed in this article are those of the authors and do not necessarily represent the views of the Department of Veterans Affairs. The authors thank the many VA clinicians and administrators who assisted or participated in this project.
1. Armour BS, Pitts MM, Maclean R, Cangialose C, Kishel M, Imai H, Etchason J: The effect of explicit financial incentives on physician behavior. Arch Intern Med 2001; 161:1261–1266Crossref, Medline, Google Scholar
2. Hofer TP, Bernstein SJ, Hayward RA, DeMonner S: Validating quality indicators for hospital care. Jt Comm J Qual Improv 1997; 23:455–467Medline, Google Scholar
3. Hermann RC, Leff HS, Palmer RH, Yang D, Teller T, Provost S, Jakubiak C, Chan J: Quality measures for mental health care: results from a national inventory. Med Care Res Rev 2000; 57(suppl 2):136–154Google Scholar
4. Laffel G, Blumenthal D: The case for using industrial quality management science in health care organizations. JAMA 1989; 262:2869–2873Crossref, Medline, Google Scholar
5. Joint Commission on the Accreditation of Healthcare Organizations Primer on Indicator Development and Application: Measuring Quality in Health Care. Oakbrook Terrace, Ill, JCAHO, 1990Google Scholar
6. Eddy DM: Performance measurement: problems and solutions. Health Aff (Millwood) 1998; 17(4):7–25Crossref, Medline, Google Scholar
7. Thomson O’Brien MA, Oxman AD, Davis DA, Haynes RB, Freemantle N, Harvey EL: Audit and feedback: effects on professional practice and health care outcomes. Cochrane Database Syst Rev 2000; 2:CD000259 (update 2003; 3:CD000259)Google Scholar
8. Davis DA, Thomson MA, Oxman AD, Haynes RB: Changing physician performance: a systematic review of the effect of continuing medical education strategies. JAMA 1995; 274:700–705Crossref, Medline, Google Scholar
9. Kiefe CI, Allison JJ, Williams OD, Person SD, Weaver MT, Weissman NW: Improving quality improvement using achievable benchmarks for physician feedback: a randomized controlled trial. JAMA 2001; 285:2871–2879Crossref, Medline, Google Scholar
10. Balas EA, Boren SA, Brown GD, Ewigman BG, Mitchell JA, Perkoff GT: Effect of physician profiling on utilization: meta-analysis of randomized clinical trials. J Gen Intern Med 1996; 11:584–590Crossref, Medline, Google Scholar
11. Turpin RS, Darcy LA, Koss R, McMahill C, Meyne K, Morton D, Rodriguez J, Schmaltz S, Schyve P, Smith P: A model to assess the usefulness of performance indicators. Int J Qual Health Care 1996; 8:321–329Medline, Google Scholar
12. Zyzanski SJ, Stange KC, Kelly R, Flocke S, Shank JC, Chao J, Jaen CR, Smith CK: Family physicians’ disagreements with the US Preventive Services Task Force recommendations. J Fam Pract 1994; 39:140–147Medline, Google Scholar
13. O’Leary DS: Beyond generic occurrence screening. JAMA 1991; 265:1993–1994Crossref, Medline, Google Scholar
14. Hayward RS, Guyatt GH, Moore K-A, McKibbon KA, Carter AO: Canadian physicians’ attitudes about and preferences regarding clinical practice guidelines. Can Med Assoc J 1997; 156:1715–1723Google Scholar
15. Siriwardena AN: Clinical guidelines in primary care: a survey of general practitioners’ attitudes and behaviour. Br J Gen Pract 1995; 45:643–647Medline, Google Scholar
16. Department of Veterans Affairs, Office of Quality and Performance:1999 Network Directors’ Performance Measures: Definitions, Data Collection Strategies. Washington, DC, Department of Veterans Affairs, 1999Google Scholar
17. American Psychiatric Association: Report of the APA Task Force on Quality Indicators. Washington, DC, American Psychiatric Association, 1999Google Scholar
18. Joint Commission on the Accreditation of Healthcare Organizations: National Library of Healthcare Indicators, Health Plan and Network Ed. Oakbrook Terrace, Ill, JCAHO, 1997Google Scholar
19. Palmer H, Lawthers A: Computerized Needs-Oriented Quality Measurement Evaluation System (CONQUEST), 1.1 ed. Washington, DC, Harvard College/Agency for Health Care Policy and Research, 1996Google Scholar
20. Health Plan Employer Data and Information Set (HEDIS 3.0/1998). Annapolis Junction, Md, National Committee for Quality Assurance Publications Center, 1998Google Scholar
21. FACCT Quality Measures. Portland, Ore, Foundation for Accountability, 1996 (http://www.facct.org/facct/site/facct/facct/Measures)Google Scholar
22. Performance Measures for Managed Behavioral Healthcare Programs (PERMS 2.0). Washington, DC, Committee on Quality Improvement and Clinical Services, American Managed Behavioral Healthcare Association, 1998Google Scholar
23. Five State Feasibility Study on State Mental Health Agency Performance Measures. Final Report. Alexandria, Va, National Association of State Mental Health Program Directors Research Institute, 1998Google Scholar
24. Powell RA, Single HM, Lloyd KR: Focus groups in mental health research: enhancing the validity of user and provider questionnaires. Int J Soc Psychiatry 1996; 42:193–206Crossref, Medline, Google Scholar
25. Dillman DA: The design and administration of mail surveys. Annu Rev Sociol 1991; 17:225–249Crossref, Google Scholar
26. Department of Health and Human Services, Health Resources and Services Administration, Bureau of Health Professions: Area Resource File. Rockville, Md, National Center for Health Workforce Analysis, 2000Google Scholar
27. National Hospital Quality Improvement Survey, in Knowledge Leadership Series, Issue 3. Chicago, Arthur Andersen and American Hospital Association, 1999Google Scholar
28. Krupnick JL, Sotsky SM, Simmens S, Moyer J, Elkin I, Watkins J, Pilkonis PA: The role of the therapeutic alliance in psychotherapy and pharmacotherapy outcome: findings in the National Institute of Mental Health Treatment of Depression Collaborative Research Program. J Consult Clin Psychol 1996; 64:532–539Crossref, Medline, Google Scholar
29. Lebow JL: Research assessing consumer satisfaction with mental health treatment: a review of findings. Eval Program Plann 1983; 6:211–236Crossref, Medline, Google Scholar
30. Kravitz R: Patient satisfaction with health care: critical outcome or trivial pursuit? J Gen Intern Med 1998; 13:280–282Crossref, Medline, Google Scholar
31. Meredith LS, Orlando M, Humphrey N, Camp P, Sherbourne CD: Are better ratings of the patient-provider relationship associated with higher quality care for depression? Med Care 2001; 39:349–360Crossref, Medline, Google Scholar
32. Druss BG, Rosenheck RA, Stolar M: Patient satisfaction and administrative measures as indicators of the quality of mental health care. Psychiatr Serv 1999; 50:1053–1058Link, Google Scholar
33. Sederer L, Dickey B (eds): Outcomes Assessment in Clinical Practice. Baltimore, Williams & Wilkins, 1996Google Scholar
34. Dickey B, Sederer LI (eds): Improving Mental Health: Commitment to Quality. Washington, DC, American Psychiatric Publishing, 2001Google Scholar
35. Asch DA, Jedrziewski MK, Christakis NA: Response rates to mail surveys published in medical journals. J Clin Epidemiol 1997; 50:1129–1136Crossref, Medline, Google Scholar