Association of Depression Duration With Reduction of Global Cerebral Gray Matter Volume in Female Patients With Recurrent Major Depressive Disorder
Abstract
OBJECTIVE: The authors investigated the relationship between depression duration and cerebral gray matter volume in female patients with recurrent major depressive disorder. METHOD: Magnetic resonance imaging was used to measure intracranial and total brain volumes as well as gray matter and white matter volumes of the cerebrum; frontal, temporal, parietal, and occipital lobes; cerebellum; and the lateral and third ventricles in 23 female patients with DSM-IV major depression. RESULTS: Correlation and regression analyses showed a significant relationship between total illness duration and cerebral gray matter (including cortical lobe) volume after correction for intracranial volume and age. CONCLUSIONS: Depressive states may lead to changes in global cerebral gray matter volume.
Only a few studies have investigated the effects of recurrent depressive states on brain morphology. Glucocorticoid-induced neurotoxicity due to recurrent depressive episodes is hypothesized to be involved in structural damage to the hippocampus (1). Indeed, an association between decreased hippocampal volume and total lifetime duration of depression was found in women with recurrent major depressive disorder (2). However, hippocampal findings in depression have not been consistent (3), and postmortem and neuroimaging studies have shown abnormalities in other brain regions as well, such as the frontal cortex, basal ganglia, and cerebellum (1, 4, 5). On the basis of these findings, we investigated a possible association between depression duration and quantitative volume changes in cerebral gray matter in patients with recurrent depression.
Method
Twenty-three female outpatients with a lifetime DSM-IV diagnosis of major depressive disorder participated after written informed consent was obtained. Diagnoses were established with the Mini-International Neuropsychiatric Interview (6). Subjects were screened with a self-report health questionnaire that reviewed demographic data and medical history. Included were patients whose onset of major depressive disorder occurred before the age of 45. Exclusion criteria were comorbid psychiatric disorders, a history of central nervous system disease, cerebrovascular disease, dementia, and substance dependence.
Depression duration (months) was assessed in an interview by using life-chart methodology. Depression severity at the time of the scan was measured with the Montgomery-Åsberg Depression Rating Scale (7). Global cognitive functioning was assessed with the Mini-Mental State Examination (MMSE) (8). At the time of the scan, 22 patients were receiving medication: antidepressants (N=11), lithium (N=4), benzodiazepines (N=1), or a combination of antidepressants with neuroleptics (N=3), lithium (N=2), or both (N=1).
Magnetic resonance imaging (MRI) scans were acquired on a Philips 1.5-T scanner: three-dimensional fast-field echo scans (TE=4.6 msec, TR=30 msec, field of view=256×256 mm2) with 1.2-mm contiguous coronal slices, and T2-weighted dual echo-turbo spin echo scans (TE1=14 msec, TE2=80 msec, TR=6350 msec, field of view=256×256 mm2) with 1.6-mm contiguous coronal slices of the whole head. Quantitative assessments of intracranial and total brain volumes as well as gray matter and white matter volumes of the cerebrum (total brain excluding cerebellum and stem); frontal, temporal, parietal, and occipital regions; cerebellum; and the lateral and third ventricles were performed automatically with methodology previously validated (9)
Analysis of linearity showed a significant linear component in the relationship between depression duration and MRI data. Pearson’s partial correlation coefficients with two-tailed significance, correcting for intracranial volume, were calculated to study the association between depression duration and MRI volumes. In a linear regression analysis, the contribution of both age and intracranial volume to the MRI volumes was studied. On four scans, gray and white matter could not be segmented because of movement artifacts. Analysis of these four cases showed no significant differences between groups for age, depression duration, level of education, or scores on the Montgomery-Åsberg Depression Rating Scale or the MMSE.
Results
The mean age of the patients was 62.8 years (SD=11.3, range=46–82). The mean level of education was 11.3 years (SD=4.1). The median Montgomery-Åsberg Depression Rating Scale score was 12 (range=1–50). The mean MMSE score was 28.1 (SD=1.6). Twenty-two patients were right-handed. The mean age at onset of the first depressive episode was 33.4 years (SD=9.1); the median cumulative duration of the depressive episodes was 75 months (range=8–354).
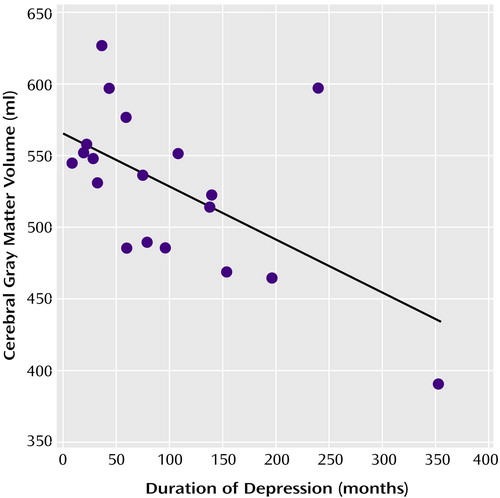
We found significant negative correlations, after correction for intracranial volume, between depression duration and volumes of total cerebral gray matter (r=–0.66, df=16, p=0.003), frontal gray matter (r=–0.63, df=16, p=0.005), temporal gray matter (r=–0.71, df=16, p=0.001), and parietal gray matter (r=–0.64, df=16, p=0.004). When taking the gray matter/total brain volume ratios into account, the findings did not change. See Figure 1 for a scatterplot of total cerebral gray matter data. Excluding the two right outliers did not change results (r=–0.71, df=14, p=0.002). No correlation with depression duration was found for any of the other MRI data. Depression duration was not significantly correlated with increasing age (r=0.26, df=17, p<0.24). The effects of depression duration remained significant, after adding age and intracranial volume to the regression analysis, for volumes of cerebral gray matter (regression coefficient [β]=–0.24, SE=0.09; t=–2.62, df=18, p<0.02), frontal gray matter (β=–0.08, SE=0.03; t=–2.32, df=18, p<0.04), temporal gray matter (β=–0.07, SE=0.02; t=–3.39, df=18, p=0.004), and parietal gray matter (β=–0.05, SE=0.02; t=–2.35, df=18, p<0.04).
Discussion
In female patients with recurrent early-onset major depressive disorder, total depression duration was significantly and negatively associated with cerebral gray matter volume, independent of age. To our knowledge, this is the first structural neuroimaging study to report a direct relationship between depression duration and global cerebral gray matter volume. The findings suggest that gray matter changes are related to depression duration in the brains of depressed patients in addition to previously reported changes in the hippocampus (2).
Decrease in cerebral gray matter volume in depression may reflect findings of reduced neuron cell density and size and reduced glial densities in specific cortical layers of prefrontal areas in postmortem studies (1, 10, 11). It is of interest that depression duration was correlated with increased expression of the astrocytic cytoskeletal marker glial fibrillary acidic protein in astrocytes, indicative of astrocyte reaction to neuronal injury (12). Inhibition of cortical astrocyte proliferation has been related to the activity of glucocorticoid receptor pathways (13). Alternatively, glial reduction has been associated with a genetic vulnerability according to findings of studies in familial major depressive disorder (5, 11).
An advantage of our study is the homogeneous group of women with recurrent major depressive disorder and age at onset before 45 years to minimize the effect of possible confounders like gender, age, and cardiovascular disease. This homogeneity may point to a specific vulnerability of this group and may explain the difference with previous studies that found changes in other brain regions. Limitations to this study are the absence of a control group and the lack of lifetime medication information. However, in postmortem studies, there was no evidence that medication influenced cell size or density (10). We did not obtain information about glucocorticoid function. To draw more definite conclusions, replication of our findings is needed in larger studies.
Received June 5, 2002; revision received May 27, 2003; accepted May 29, 2003. From the Rudolph Magnus Institute of Neuroscience, Department of Psychiatry, University Medical Center Utrecht. Address reprint requests to Dr. Lampe, Department of Psychiatry, HP A.01.126, University Medical Center Utrecht, P.O. Box 85500, 3508 GA, Utrecht, the Netherlands; [email protected] (e-mail).

Figure 1. Association Between Depression Duration and Cerebral Gray Matter Volume in 19 Female Patients With Recurrent Major Depressive Disordera
ar=–0.66, df=16, p=0.003.
1. Rajkowska G: Postmortem studies in mood disorders indicate altered numbers of neurons and glial cells. Biol Psychiatry 2000; 48:766–777Crossref, Medline, Google Scholar
2. Sheline YI, Sanghavi M, Mintun MA, Gado MH: Depression duration but not age predicts hippocampal volume loss in medically healthy women with recurrent major depression. J Neurosci 1999; 19:5034–5043Crossref, Medline, Google Scholar
3. Sheline YI: 3D MRI studies of neuroanatomic changes in unipolar major depression: the role of stress and medical comorbidity. Biol Psychiatry 2000; 48:791–800Crossref, Medline, Google Scholar
4. Soares JC, Mann JJ: The anatomy of mood disorders—review of structural neuroimaging studies. Biol Psychiatry 1997; 41:86–106Crossref, Medline, Google Scholar
5. Drevets WC, Price JL, Simpson JR Jr, Todd RD, Reich T, Vannier M, Raichle ME: Subgenual prefrontal cortex abnormalities in mood disorders. Nature 1997; 386:824–827Crossref, Medline, Google Scholar
6. Sheehan DV, Lecrubier Y, Sheehan KH, Amorim P, Janavs J, Weiller E, Hergueta T, Baker R, Dunbar GC: The Mini-International Neuropsychiatric Interview (MINI): the development and validation of a structured diagnostic psychiatric interview for DSM-IV and ICD-10. J Clin Psychiatry 1998; 59(suppl 20):22–33Google Scholar
7. Montgomery SA, Åsberg M: A new depression scale designed to be sensitive to change. Br J Psychiatry 1979; 134:382–389Crossref, Medline, Google Scholar
8. Folstein MF, Folstein SE, McHugh PR: “Mini-Mental State”: a practical method for grading the cognitive state of patients for the clinician. J Psychiatr Res 1975; 12:189–198Crossref, Medline, Google Scholar
9. Hulshoff Pol HE, Schnack HG, Bertens MGBC, van Haren NEM, van der Tweel I, Staal WG, Baaré WFC, Kahn RS: Volume changes in gray matter in patients with schizophrenia. Am J Psychiatry 2002; 159:244–250Link, Google Scholar
10. Cotter D, Mackay D, Landau S, Kerwin R, Everall I: Reduced glial cell density and neuronal size in the anterior cingulate cortex in major depressive disorder. Arch Gen Psychiatry 2001; 58:545–553Crossref, Medline, Google Scholar
11. Ongur D, Drevets WC, Price JL: Glial reduction in the subgenual prefrontal cortex in mood disorders. Proc Natl Acad Sci USA 1998; 95:13290–13295Crossref, Medline, Google Scholar
12. Miguel-Hidalgo JJ, Baucom C, Dilley G, Overholser JC, Meltzer HY, Stockmeier CA, Rajkowska G: Glial fibrillary acidic protein immunoreactivity in the prefrontal cortex distinguishes younger from older adults in major depressive disorder. Biol Psychiatry 2000; 48:861–873Crossref, Medline, Google Scholar
13. Crossin KL, Tai MH, Krushel LA, Mauro VP, Edelman GM: Glucocorticoid receptor pathways are involved in the inhibition of astrocyte proliferation. Proc Natl Acad Sci USA 1997; 94:2687–2692Crossref, Medline, Google Scholar


