Anterior Cingulate Activity as a Predictor of Degree of Treatment Response in Major Depression: Evidence From Brain Electrical Tomography Analysis
Abstract
OBJECTIVE: The anterior cingulate cortex has been implicated in depression. Results are best interpreted by considering anatomic and cytoarchitectonic subdivisions. Evidence suggests depression is characterized by hypoactivity in the dorsal anterior cingulate, whereas hyperactivity in the rostral anterior cingulate is associated with good response to treatment. The authors tested the hypothesis that activity in the rostral anterior cingulate during the depressed state has prognostic value for the degree of eventual response to treatment. Whereas prior studies used hemodynamic imaging, this investigation used EEG. METHOD: The authors recorded 28-channel EEG data for 18 unmedicated patients with major depression and 18 matched comparison subjects. Clinical outcome was assessed after nortriptyline treatment. Of the 18 depressed patients, 16 were considered responders 4–6 months after initial assessment. A median split was used to classify response, and the pretreatment EEG data of patients showing better (N=9) and worse (N=9) responses were analyzed with low-resolution electromagnetic tomography, a new method to compute three-dimensional cortical current density for given EEG frequency bands according to a Talairach brain atlas. RESULTS: The patients with better responses showed hyperactivity (higher theta activity) in the rostral anterior cingulate (Brodmann’s area 24/32). Follow-up analyses demonstrated the specificity of this finding, which was not confounded by age or pretreatment depression severity. CONCLUSIONS: These results, based on electrophysiological imaging, not only support hemodynamic findings implicating activation of the anterior cingulate as a predictor of response in depression, but they also suggest that differential activity in the rostral anterior cingulate is associated with gradations of response.
The anterior cingulate cortex has been the subject of increasing attention in neuroimaging research on depression. Complementing reports of lower than normal activity in the dorsolateral and dorsomedial prefrontal cortex and parietal regions (for reviews, see references 1–3), several studies have shown low glucose metabolism and regional cerebral blood flow in the anterior cingulate cortex (4–8; for review, see reference 9). On the basis of these data, recent neurobiological models of depression have stressed the importance of this region in the pathogenesis of depression and in the manifestation of its symptoms (2, 10).
In apparent contradistinction to the finding of anterior cingulate hypoactivity in depression, a number of treatment studies have indicated a relationship between higher anterior cingulate activity before treatment and eventual clinical outcome. Mayberg and colleagues (11) found that patients with unipolar depression who responded to treatment after 6 weeks showed higher pretreatment glucose metabolism in a rostral region of the anterior cingulate cortex (Brodmann’s area 24a/b) than nonresponders and nonpsychiatric comparison subjects. These results replicated previous findings drawn from rather small patient groups (12, 13). Adding to their original subjects, Wu et al. (14) confirmed this pattern in 36 patients with unipolar depression. These data suggest the intriguing possibility that the level of activity in the rostral anterior cingulate cortex may be a prognostic indicator of response to treatment.
The apparent contradiction of anterior cingulate hypoactivity in depression and anterior cingulate hyperactivity in patients who later respond to treatment might be understood in the context of the well-established anatomical and cytoarchitectonic evidence for subdividing the anterior cingulate cortex (15, 16). Whereas anterior cingulate hypoactivity in depression generally involves the dorsal anterior cingulate (dorsal region of area 32; areas 24′, 32′; see reference 16), the region showing hyperactivity in responders is more ventral and rostral, including pregenual areas 24 and 32.
In the present study we attempted to extend prior findings by testing whether differential rostral anterior cingulate activity predicts degree of response to treatment, an important question in light of the substantial variability in response among depressed patients (17). Higher activity in the rostral anterior cingulate was hypothesized to be associated with better response. Unlike the subjects in prior studies (11–14), most of the depressed participants investigated here were responders. Another distinguishing feature of this study was that it showcased a novel method for extracting localized sources from surface brain electrical activity recordings. The technique begins with EEG data, which are then analyzed with a new tomographic analysis procedure (18–20) that computes the three-dimensional intracerebral distributions of current density for specified EEG frequency bands without assumptions about any predefined numbers of generating sources. On the basis of EEG and magnetoencephalographic studies (21–23) implicating the anterior cingulate cortex as a likely neuronal generator for theta activity in the human brain, theta was hypothesized to be the only one of the seven conventional frequency bands analyzed to show this effect. In particular, despite prior literature implicating alpha activity in depression (1, 3), an association between alpha activity and response to treatment was not expected because of no known relation between alpha activity and the anterior cingulate cortex (24, 25).
Method
Participants
Depressed and comparison participants were recruited by using advertisements in local media. Respondents were screened by telephone and invited for a diagnostic interview if deemed likely to meet the study criteria. All depressed participants met the DSM-IV criteria for major depressive disorder, as assessed with the patient edition of the Structured Clinical Interview for DSM-III-R (SCID) (26), which was modified to make DSM-IV diagnoses. They had no current symptoms or history of mania, psychosis, or other axis I disorders, with the exception of social phobia secondary to depression and specific phobias. Depressed subjects with a family history of mania or psychosis were excluded. Although double depression was allowed, people meeting the criteria for dysthymia but not major depressive disorder were excluded. In keeping with the requirements of the nonpatient edition of the SCID, the comparison participants had no current or past personal or family history of any axis I disorders. Diagnostic reliability was evaluated through independent rating of the audiotaped SCID interviews. Of the 10 randomly chosen interviews, only one participant was classified differently (kappa=0.80). All participants were right-handed (27) and free of antidepressant medication for at least 4 weeks before testing.
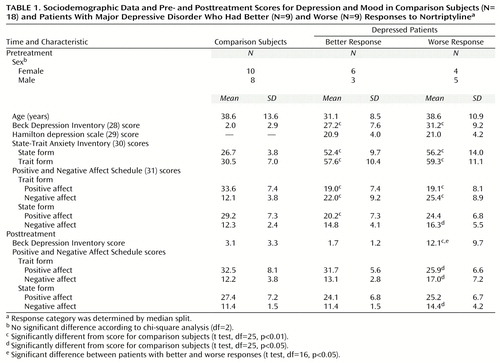
All subjects with sufficient artifact-free pretreatment EEGs as well as pre- and posttreatment clinical assessments—18 depressed and 18 comparison subjects, 10 women in each group—were included in the analyses. Depression severity was measured with the Beck Depression Inventory (28) and the 17-item version of the Hamilton Depression Rating Scale (29). To assess response to treatment, the percentage change in Beck Depression Inventory score was calculated for each depressed subject as follows: ([pretreatment score – posttreatment score] ÷ pretreatment score) × 100. The data for the Hamilton depression scale were incomplete, precluding the possibility of their inclusion in the analyses of response to treatment. The second clinical assessment occurred 4–6 months after the EEG recording and followed pharmacological treatment with nortriptyline. The nortriptyline doses were titrated to achieve therapeutic blood levels (50–150 ng/ml). Only two subjects were clinical nonresponders, with changes in their scores of –4.8% and 13.2%, respectively (posttreatment Beck Depression Inventory scores of 22 and 33). Conversely, all other depressed subjects showed an improvement of at least 63% (posttreatment Beck scores ranged from 0 to 13). To assess the relationship between degree of response and brain electrical activity, the subjects who responded better (85.7%–100.0% change) and worse (–4.8% to 82.6% change) were dichotomized by using a median split approach.
The patients with better responses had pretreatment Beck scores of 16–37 and Hamilton depression scores of 14–27. Those with worse responses had pretreatment Beck scores of 17–47 and Hamilton depression scores of 13–27. Neither of these subgroups differed significantly from the comparison subjects in age or sex distribution (Table 1). The two depression groups were indistinguishable on all measures of affect administered before treatment, whereas they both showed more depression, anxiety, and negative affect and less positive affect than the comparison group. After treatment, the patients with worse response continued to differ from the comparison group on the self-report measures of affect (posttreatment Beck score range=4–33), whereas the patients with better response (posttreatment Beck score range=0–3) did not.
After complete description of the study to the subjects, written informed consent was obtained. The study was approved by the university human subject committee.
Apparatus and Physiological Recording
An electrode cap with tin electrodes was used to record EEG from 28 scalp sites of the 10/10 system (32) (FP1/2, F3/4, F7/8, FC3/4, FC7/8, C3/4, CP3/4, CP5/6, T3/4, T5/6, P3/4, PO3/4, FPz, Fz, Cz, Pz) referenced to the left ear (A1). The horizontal electro-oculogram (EOG) was recorded from the external canthus of each eye, and the vertical EOG was recorded from the supra- to suborbit of one eye. Electrode impedances were under 5 KΩ for EEG (homologous sites within 2 KΩ) and under 20 KΩ for EOG. Physiological signals were amplified (1–300-Hz band pass with a 60-Hz notch filter) and low-pass filtered at 100 Hz. Analog signals were digitized online at 250 Hz.
Procedure
As part of a full day of testing, EEGs were recorded between 11:00 a.m. and 1:30 p.m. Since EEG data were collected concurrently with [18F]fluorodeoxyglucose (FDG) positron emission tomography (PET), the participants fasted for 5 hours before arrival at the University of Wisconsin PET Imaging Center. After electrode application, preparations for the PET procedure were made; they included the insertion of two intravenous lines in the right arm and left hand. Data from the PET study have been published elsewhere (24, 25, 33) and are not reported here. Unfortunately, correlations between the PET and EEG data for this group could not be determined because only six subjects had artifact-free PET and EEG data.
EEG data collection began at the time of the FDG injection and involved 10 contiguous 3-minute trials to cover the entire 30 minutes needed for radiotracer uptake. Oral instructions to open or close eyes were given before the start of each trial, with an alternating order counterbalanced across participants. A technician and laboratory assistant were seated to the left of the participant in order to draw blood samples from the left hand and record the exact time of each draw needed for PET analysis. After completion of the 10 trials, the electrodes and intravenous lines were removed.
Data Reduction and Analysis
After off-line artifact rejection, nonoverlapping 2048-msec EEG epochs were extracted. A total of 5,262 artifact-free epochs (mean=299 seconds/subject, SD=174) were available, distributed similarly among the comparison subjects (mean=310 seconds, SD=204), patients with better responses (mean=286 seconds, SD=186), and patients with worse responses (mean=289 seconds, SD=93). After the data were re-referenced to an average reference, all eyes-closed EEG epochs were analyzed with low-resolution electromagnetic tomography (LORETA) (18–20). From scalp-recorded electrical potential distribution, LORETA computes the three-dimensional intracerebral distributions of current density for specified EEG frequency bands. In simulations comparing five source localization techniques using linear solutions for the EEG inverse problem, only LORETA reliably localized sources in three-dimensional space (18). One important difference between the LORETA algorithm and previously published source localization methods, e.g., brain electric source analysis (BESA) (34), is that LORETA does not require the assumption of a specific number of sources to solve the inverse problem. The only assumption implemented is that neighbor neuronal sources are likely to be similarly active (i.e., have similar orientations and strengths). This assumption is well supported by animal single-unit recordings (see, for instance, reference 35). Mathematically, the assumption of simultaneous and synchronous activation of neighboring neurons is implemented by computing the “smoothest” of all possible activity distributions. The physiological validity of the algorithm has been demonstrated in studies investigating basic visual and auditory processes (20), epileptic discharges (36), and cognitive tasks tapping specific brain regions (37–38) as assessed independently in functional hemodynamic imaging studies. A recent study (36) provided direct cross-modality validation by showing that LORETA generators of ictal discharge were remarkably close to the locations of MRI-identified epileptic foci.
The LORETA version used in the present study (18, 19, 37) included a three-shell spherical head model registered to the Talairach brain atlas (39), as well as EEG electrode coordinates derived from cross-registrations between spherical and realistic head geometry (40). Computations were restricted to cortical gray matter and the hippocampus by using the digitized Talairach and probability atlases of the Brain Imaging Centre, Montreal Neurologic Institute. If a voxel’s probability of being gray matter was higher than 33% and higher than the probability of being white matter or cerebrospinal fluid, that voxel was labeled as gray matter. The solution space contained 2,394 voxels, and the spatial resolution was 7 mm.
The LORETA analyses consisted of three steps. First, for every subject, all available artifact-free 2048-msec EEG epochs were subjected to cross-spectrum analysis for the following EEG bands: delta (1.5–6.0 Hz), theta (6.5–8.0 Hz), alpha1 (8.5–10.0 Hz), alpha2 (10.5–12.0 Hz), beta1 (12.5–18.0 Hz), beta2 (18.5–21.0 Hz), and beta3 (21.5–30.0 Hz). Second, LORETA computed current density as the linear, weighted sum of the scalp electrical potentials and then squared this value for each voxel to yield power of current density. Finally, for every subject and every band, the LORETA solution was normalized to a total power of 1 and log-transformed. LORETA units are proportional to square amperes per square meter.
Statistical Analysis
To estimate the false positive rate under the null hypothesis of no voxel-wise differences between two given subject groups, we implemented a randomization procedure using the tmax approach as previously proposed for neuroimaging data (41, 42). At every iteration, two randomly selected groups, each containing one-half of the subjects under investigation, were tested at each of the 2,394 voxels. At every iteration, the largest absolute t value (from a two-tailed test) was stored in a histogram. After 5,000 iterations, for each frequency band the t value cutting off the most extreme 5% of the distribution was identified (i.e., two-tailed p<0.05). The highest t value across the frequency bands was selected to threshold the data, i.e., to accept or reject the null hypothesis. This threshold was t=3.09 (df=16, p<0.007) when the data of the nine patients with worse responses and nine patients with better responses were considered, t=3.17 (df=16, p<0.006) when the patients with better responses and nine randomly selected comparison subjects were considered, and t=3.22 (df=16, p<0.006) when the patients with worse responses and nine randomly selected comparison subjects were considered. Consequently, a two-tailed alpha level of 0.005 was adopted for thresholding the statistical maps that consisted of voxel-by-voxel t tests comparing the patients with better and worse responses (t=3.25, df=16) and each of the depression groups versus the comparison subjects (t=3.08, df=25). Because of our a priori hypothesis that theta activity in the anterior cingulate cortex would be greater in the patients with better responses than in those with worse responses, a one-tailed test was used for the theta band (p<0.01).
The structure-probability maps atlas (43) was used to assess which brain regions were involved in group differences. Brodmann areas and brain regions closest to the observed locations identified by the Talairach coordinates are reported, as well as the number of voxels exceeding the statistical threshold.
Results
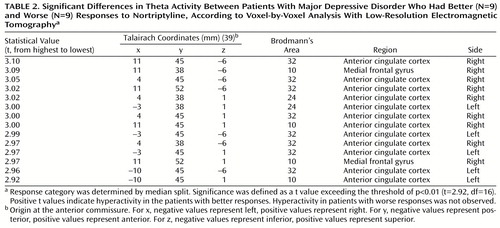
In the comparisons of depressed subjects with better and worse responses to treatment, the only result in any frequency band to survive the statistical threshold was theta activity (6.5–8.0 Hz). (To test whether significant results emerged only from the theta band because of the lower threshold, p<0.01 versus p<0.005, analyses were repeated for the other bands at a two-tailed p<0.01, but again no significant results were observed.) The significant result for theta activity was found in the rostral anterior cingulate cortex (area 24), which extended rostrally to mesial regions of area 32 and to some voxels in the medial frontal gyrus (area 10; Figure 1). As shown in Figure 2, LORETA theta activity was higher in the patients with better responses (mean=–3.35, SD=0.06) than in the patients with worse responses (mean=–3.43, SD=0.06) (t=3.10, df=16, p<0.008). The difference between the patients with better responses and the comparison subjects (mean=–3.43, SD=0.08) did not pass the statistical threshold (t=2.65, df=25, p<0.02), whereas the patients with worse responses and the comparison subjects showed virtually identical pretreatment levels of anterior cingulate activity. Significant differences between the patients with better and worse responses were grouped in an uninterrupted cluster (volume=4.8 cm3) involving 14 voxels (nine in the right and five in the left hemisphere) (Table 2).
Follow-up analyses showed that these results were not driven by the two depressed patients who were classified as clinical nonresponders. The Pearson correlation between the percentage change in Beck Depression Inventory score and the theta activity in the entire cluster was 0.48 (df=16, p<0.05) with the two nonresponders and 0.56 (df=14, p<0.03) without them. The higher the LORETA theta activity in these rostral regions of the anterior cingulate cortex, the better the response to treatment (Figure 3).
To test whether the association with the degree of response was specific to the rostral anterior cingulate cortex, we computed Pearson correlations between the percentage change in Beck depression score and the LORETA theta activity in the entire brain volume without the two nonresponders. In this analysis, only two regions showed significant correlations (p<0.05, uncorrected for multiple comparisons). As shown in Figure 4, theta activity within a medial frontal region extending caudally to areas 24 and 32 of the anterior cingulate cortex (33 voxels; 27 in the right and six in the left hemisphere) was positively correlated (r=0.54, df=14, p<0.05) with percentage change in the Beck depression score, whereas theta activity within a much smaller region involving the left precuneus (five voxels) was negatively correlated (r=–0.62, df=14, p<0.03) with percentage change in Beck depression score.
Because the depressed patients with better responses were slightly (but not significantly) younger than those with worse responses and because anterior cingulate activity shows remarkable functional decrease with age (44), a hierarchical regression analysis predicting theta activity within the cluster emerging from the correlational analysis was conducted by entering age as the first predictor and then entering percentage change in Beck depression score. Age was not related to theta activity in the anterior cingulate cortex (beta=–0.09, t=–0.32, df=14, p>0.75). Percentage change in Beck depression score remained a significant predictor of theta activity in the anterior cingulate cortex even after removal of the variance associated with age (beta=0.64; R2 change=0.32, F=6.20, df=1, 13, p<0.03). Similar information was obtained from calculating the partial correlation between percentage change in Beck depression score and theta with age partialed out (r=0.57, df=13, p<0.03).
Discussion
In a group of individuals treated for major depression, baseline theta activity within a rostral region of the anterior cingulate cortex involving areas 24 and 32 predicted degree of response 4–6 months later. Depressed subjects showing a better response had higher theta activity than those responding less well, and they also tended to have higher activity than comparison subjects; this finding replicates that of Mayberg et al. (11). In addition, theta activity in the left precuneus was inversely related to response after treatment. However, this unexpected effect involved a very small region (five voxels) and emerged only in the correlational analysis with less stringent statistical criteria.
Prior research suggests that higher theta activity within the anterior cingulate cortex is best interpreted as an electrophysiological manifestation of higher activation within this region. This interpretation relies on observations of increased theta activity during stimulus expectancy and focused attention (45), higher working memory load (22), successful encoding of new information (46), and concentrated task performance (47).
The present findings add to the emerging story of anterior cingulate involvement in depression. Dorsal anterior cingulate activity is low in depression (4–8), and remission has been associated with increased activity in the same region (48–50). Similarly, the high level of activity in the rostral anterior cingulate cortex (area 24a) and mesial regions of area 32 associated with response to treatment (11–14, 49) has been shown to normalize (i.e., decrease) in patients who respond to sleep deprivation (14, 51). The fact that rostral anterior cingulate activation predicted the magnitude of response in the current study and did not simply differentiate between responders and nonresponders underscores the robustness of this effect and extends previous findings (11–14, 49) by demonstrating that the magnitude of anterior cingulate activation accounts for gradations of response (even for the analyses that excluded clinical nonresponders). (We previously reported a preliminary analysis of the PET data involving nine depressed subjects [52]. In that analysis, patients with better and worse responses differed in a clearly more dorsal region of the anterior cingulate: x=–4, y=–14, z=46; areas 23, 24, 31. The fact that only six of these subjects had artifact-free EEG data and therefore could be included in our group of 18 depressed subjects may account for the discrepancy between the EEG and PET results.) The region involved is remarkably close to the ones reported previously in studies of response to treatment that used PET (11, 14) and single photon emission computed tomography (SPECT) (12). Taken together, these results suggest that hyperactivation of the rostral anterior cingulate cortex may represent an adaptive, compensatory reaction to the state of being depressed that increases the likelihood of remission and then normalizes after recovery.
In a model of depression that integrates some of these data, Mayberg and colleagues (10, 50) considered distinctions between different areas of the anterior cingulate cortex to account for the formation and maintenance of depressive symptoms. They described a dorsal compartment that modulates attentional and cognitive symptoms (e.g., apathy, attentional and executive deficits) and that includes the dorsolateral prefrontal cortex, the dorsolateral anterior cingulate (area 24b), the inferior parietal lobe, and the striatum. A ventral compartment, on the other hand, is postulated to be involved in vegetative and somatic symptoms (e.g., sleep disturbance, loss of appetite and libido) and includes the hypothalamic-pituitary-adrenal axis, insula, subgenual cingulate (area 25), and brainstem. Their model posits that the rostral anterior cingulate (area 24a) plays a key role in response to treatment because of its putative regulatory role in integrating information of the dorsal and ventral compartments. While not furnishing direct empirical evidence for this formulation, the present results and those gathered from previous studies (11–14, 49) are consistent with it.
In order to advance possible mechanisms relating rostral anterior cingulate activity and response to treatment, the functions of the various anterior cingulate subdivisions already noted need to be considered. Devinsky et al. (15) argued for distinguishing between an “affect subdivision” encompassing rostral and ventral areas of the anterior cingulate cortex (areas 25, 32, 33, and rostral area 24) and a dorsal “cognitive subdivision” of the anterior cingulate (caudal area 24′ and 32′, cingulate motor area). The affect subdivision has extensive connections with limbic and paralimbic structures (amygdala, nucleus accumbens, orbitofrontal cortex, periaqueductal gray, and autonomic brainstem motor nuclei) and is involved in regulating visceral and autonomic responses to stressful behavioral and emotional events, emotional expression, and social behavior. On the other hand, the cognitive subdivision of the anterior cingulate cortex has important connections with the spinal cord and the parietal cortex, and it is involved in response selection and processing of cognitively demanding information. Functional neuroimaging studies have provided compelling evidence distinguishing the two anterior cingulate subdivisions (Figure 5) (for reviews, see references 53 and 59). Whereas several theories include the proposition that the anterior cingulate in general acts as a bridge between attention and emotion (9, 15, 16), we agree with Mayberg that the rostral anterior cingulate in particular may serve this purpose (see also reference 62). Functionally, the rostral anterior cingulate may integrate salient affective and cognitive information, such as that derived from environmental stimuli or task demands, and subsequently modulate attentional processes within the cognitive subdivision accordingly. With regard to good response to treatment, hyperactivation of the rostral anterior cingulate in depression might reflect an amplification of the disposition to perform these functions that in turn regulate the dysfunctional cognitive and affective patterns associated with depression. Of anatomical relevance, dorsal anterior and posterior cingulate pathways devoted to attentional processes and amygdalar pathways devoted to affective processing converge within area 24 (62), further pointing to the utility of distinguishing between the rostral and ventral areas that Devinsky et al. (15) aggregated into the affect subdivision.
Other research further implicates the rostral anterior cingulate in monitoring and evaluating the significance of environmental stimuli. First, area 24 receives dense dopaminergic innervations from the ventral tegmental area (15), and dopamine has been shown to be important in the encoding of information with respect to the prediction, evaluation, and occurrence of reward (63). Consistent with this view is a recent report by Volkow et al. (44) of an in vivo demonstration of a strong relationship between dopamine D2 receptors and anterior cingulate metabolism in humans. Second, lesions of the anterior cingulate cortex (although not consistently restricted to the rostral area) have been associated with inadequate estimation of punishment versus reward cues, abnormal autonomic reactions to emotionally loaded information, low behavioral reactivity, apathy, loss of motivation, blunted emotional responses, and severe deficits in social behavior (15, 64), all of which closely mirror depressive symptoms. These two lines of evidence suggest that activation of the rostral anterior cingulate cortex may favor response to treatment by fostering an individual’s capacity to monitor present or future behavior with respect to reward or punishment. This interpretation is in agreement with Drevets’s model of depression (2), which postulates a relationship between activity in the subgenual anterior cingulate cortex and evaluative aspects of behavior in terms of reward and punishment. Of further relevance, Drevets also contended that core symptoms of depression, such as apathy and anhedonia, arise from a failure of the subgenual anterior cingulate to maintain tonic dopaminergic-dependent, reward-related activity.
Consistent with EEG and magnetoencephalographic evidence that the anterior cingulate cortex may be a possible neuronal generator for theta activity in the human brain (21–23) is the fact that the differences involving response in our study were observed exclusively in the theta band. Of particular note, alpha activity was not associated with response in the anterior cingulate cortex or any other region. Therefore, the relevance of alpha to depression that has been shown in numerous studies (1, 3) does not appear to extend to response to treatment.
A limitation of the present study is the relatively low spatial resolution of the method used, which potentially could cast doubt on the specificity of the findings for the rostral anterior cingulate cortex. However, confidence in the localization capability of LORETA for the present study rests on two arguments. First, the results are highly consistent with prior PET and SPECT findings. Second, although EEG source localization techniques have been shown to be less accurate in detecting activity arising from deep brain structures, the depth of the solution for LORETA is slightly underestimated rather than overestimated (18). A related issue is the evidence that the rostral anterior cingulate effect is lateralized to the right hemisphere, which again replicates the finding of Mayberg et al. (11). However, caution in interpreting this finding is warranted because of the medial location of the anterior cingulate cortex and the relatively low resolution of LORETA.
In the present study, depressed individuals with higher baseline EEG theta activity within a region of rostral anterior cingulate cortex showed better response to treatment 4–6 months later. The region associated with degree of response to treatment was remarkably close to regions previously indicated in hemodynamic imaging studies of depression (11–14). This similarity is noteworthy because the present study used multichannel EEG, an electrophysiological imaging technology that is fundamentally different from PET and SPECT, the primary methods reported in this literature to date. In addition to lending further support for the prior observations that anterior cingulate activation predicts response to treatment in major depression, the present study showed that even among clinical responders, differential anterior cingulate activity was associated with how well they responded to treatment.
 |
 |
Received May 23, 2000; revision received Sept. 8, 2000; accepted Sept. 13, 2000. From the Departments of Psychology and Psychiatry, University of Wisconsin-Madison; and the KEY Institute for Brain-Mind Research, University Hospital of Psychiatry, Zurich, Switzerland. Address reprint requests to Dr. Davidson, Laboratory for Affective Neuroscience, Department of Psychology, University of Wisconsin-Madison, 1202 West Johnson St., Madison, WI 53706; [email protected] (e-mail). Supported by NIMH grants MH-40747, MH-52354, MH-43454; by NIMH Research Scientist Award MH-00875 to Dr. Davidson; by NIMH Training Program in Emotion Research grant MH-18931 to Dr. Nitschke; by Predoctoral National Research Service Award Fellowship MH-12085 to Ms. Larson; and by Swiss National Research Foundation grant 81ZH-52864 and a grant from the “Holderbank”-Stiftung zur Förderung der wissenschaftlichen Fortbildung to Dr. Pizzagalli. The authors thank William Irwin for statistical advice and Rachel Jacobs and Andrew Hendrick for their assistance.

Figure 1. Images Showing Differences in Pretreatment Theta Activity Between Patients With Major Depressive Disorder Who Had Better (N=9) and Worse (N=9) Responses to Nortriptyline, According to Voxel-by-Voxel Analysis With Low-Resolution Electromagnetic Tomographya
aBetter and worse responses were determined by median split. Part A contains axial (left), sagittal (middle), and coronal (right) images at the level of maximal differences between the two depression groups; x, y, and z Talairach coordinates are 11, 45, and –6, respectively, t=3.10. The axial image is the head seen from above, nose up. L=left, R=right. A=anterior, P=posterior. The black triangles show the locations of extreme t values. Part B contains 17 axial brain slices at 7-mm intervals from the most inferior level (z=–41) to the most superior level (z=71). Coordinates are given in millimeters (39), and the origin is at the anterior commissure. For x, negative values represent left, positive values represent right. For y, negative values represent posterior, positive values represent anterior. For z, negative values represent inferior, positive values represent superior.

Figure 2. Individual Pretreatment Theta Activity in the Anterior Cingulate Cortex Cluster, Measured With Low-Resolution Electromagnetic Tomography (LORETA), in Patients With Major Depressive Disorder Who Had Better (N=9) and Worse (N=9) Responses to Nortriptyline and in Comparison Subjects (N=18)a
aResponse category was determined by median split. Horizontal lines represent mean values. The values are negative because they were log-transformed for statistical purposes; less negative values indicate higher theta activity.

Figure 3. Correlation Between Percentage Change in Beck Depression Inventory Score After Nortriptyline Treatment and Pretreatment Theta Activity in the Anterior Cingulate Cortex Cluster, Measured With Low-Resolution Electromagnetic Tomography (LORETA), in 18 Patients With Major Depressive Disordera
aThe theta activity values are negative because they were log-transformed for statistical purposes; less negative values indicate higher theta activity. The curved blue lines indicate the 95% confidence intervals. The straight blue line is the best fit regression line.

Figure 4. Correlation Between Percentage Change in Beck Depression Inventory Score After Nortriptyline Treatment and Pretreatment Theta Activity in the Entire Brain, Measured With Low-Resolution Electromagnetic Tomography (LORETA), in 16 Patients With Major Depressive Disordera
aThe images are axial brain slices at 7-mm intervals from the most inferior level (z=–41) to the most superior level (z=71). Coordinates are given in millimeters (39), and the origin is at the anterior commissure. For x, negative values represent left, positive values represent right. For y, negative values represent posterior, positive values represent anterior. For z, negative values represent inferior, positive values represent superior. Significant positive correlations (p<0.05, uncorrected for multiple comparisons) are shown in red, significant negative correlations are shown in blue (see calibration). The highest positive correlation (r=0.57, df=14, p<0.05) was for the theta activity at x=4, y=61, z=1 (Brodmann’s area 10, medial frontal gyrus; see red arrow), and the highest negative correlation (r=–0.62, df=14, p<0.03) was for the activity at x=–10, y=–74, z=50 (Brodmann’s area 7, precuneus; see blue arrow).

Figure 5. Summary of Functional Brain Imaging Studies of Anterior Cingulate Cortex Activation by Cognitive and Affective Tasks and/or Manipulations for Which Data Registered to a Common Stereotaxic Brain Atlas Were Reporteda
aFindings were reported in terms of Talairach coordinates (39). The large red area and the black triangles show the location of the cluster emerging from the present analysis based on categorization of response according to median split. The numbers represent reports listed in the reference list. ↑A=hyperactivity; ↓A=hypoactivity. The studies of depressed subjects showed pretreatment hyperactivity among patients who responded to treatment (present study and references 11, 14, 49); posttreatment decreased activity in responders (14, 51); increased activity with remission of depression (50); decreased activity with remission of depression (50); and hypoactivity in depressed subjects (4, 7), in patients with a refractory familial form of depression (5), and in depressed subjects performing the Stroop task (6). The studies that involved emotional tasks showed increased activity in response to the emotional Stroop task (53), increased activity during transient sadness in nonpsychiatric subjects (50, 54), decreased activity during transient sadness in nonpsychiatric subjects (50), increased activity during attention to emotional experiences (55), activity correlated with individual differences in emotional awareness (56), and increased activity during the processing of happy facial expressions (57). The studies of cognitive tasks showed increased activity during the anticipation of cognitive challenges (58), the counting Stroop task (59), target detection (60), and the evaluation of response conflict (61).
1. Davidson RJ, Abercrombie H, Nitschke JB, Putnam K: Regional brain function, emotion and disorders of emotion. Curr Opin Neurobiol 1999; 9:228–234Crossref, Medline, Google Scholar
2. Drevets WC: Prefrontal cortical-amygdalar metabolism in major depression. Ann NY Acad Sci 1999; 877:614–637Crossref, Medline, Google Scholar
3. Heller W, Nitschke JB: Regional brain activity in emotion: a framework for understanding cognition in depression. Cognition and Emotion 1997; 11:637–661Crossref, Google Scholar
4. Bench CJ, Friston KJ, Brown RG, Scott LC, Frackowiak RSJ, Dolan RJ: The anatomy of melancholia: focal brain abnormalities of cerebral blood flow in major depression. Psychol Med 1992; 22:607–615Crossref, Medline, Google Scholar
5. Drevets WC, Price JL, Simpson JR Jr, Todd RD, Reich T, Vannler M, Raichle ME: Subgenual prefrontal cortex abnormalities in mood disorders. Nature 1997; 386:824–827Crossref, Medline, Google Scholar
6. George MS, Ketter TA, Parekh PI, Rosinsky N, Ring HA, Pazzaglia PJ, Marangell LB, Callahan AM, Post RM: Blunted left cingulate activation in mood disorder subjects during a response interference task (the Stroop). J Neuropsychiatry Clin Neurosci 1997; 9:55–63Crossref, Medline, Google Scholar
7. Ito H, Kawashima R, Awata S, Ono S, Sato K, Goto R, Koyama M, Sato M, Fukuda H: Hypoperfusion in the limbic system and prefrontal cortex in depression: SPECT with anatomic standardization technique. J Nucl Med 1996; 37:410–414Medline, Google Scholar
8. Mayberg HS, Lewis PJ, Regenold W, Wagner HN: Paralimbic hypoperfusion in unipolar depression. J Nucl Med 1994; 35:929–934Medline, Google Scholar
9. Ebert D, Ebmeier KP: The role of the cingulate gyrus in depression: from functional anatomy to neurochemistry. Biol Psychiatry 1996; 39:1044–1050Google Scholar
10. Mayberg HS: Limbic-cortical dysregulation: a proposed model of depression. J Neuropsychiatry Clin Neurosci 1997; 9:471–481Crossref, Medline, Google Scholar
11. Mayberg HS, Brannan SK, Mahurin RK, Jerabek PA, Brickman JS, Tekell JL, Silva JA, McGinnis S, Glass TG, Martin CC, Fox PT: Cingulate function in depression: a potential predictor of treatment response. Neuroreport 1997; 8:1057–1061Google Scholar
12. Ebert D, Feistel H, Barocka A: Effects of sleep deprivation on the limbic system and the frontal lobes in affective disorders: a study with Tc-99m-HMPAO SPECT. Psychiatry Res Neuroimaging 1991; 40:247–251Crossref, Medline, Google Scholar
13. Wu JC, Gillin JC, Buchsbaum MS, Hershey T, Johnson JC, Bunney WE Jr: Effect of sleep deprivation on brain metabolism of depressed patients. Am J Psychiatry 1992; 149:538–543Link, Google Scholar
14. Wu J, Buchsbaum MS, Gillin JC, Tang C, Cadwell S, Keator D, Fallon JH, Wiegand M, Najafi A, Klein E, Hazen K, Bunney WE Jr: Prediction of antidepressant effects of sleep deprivation by metabolic rates in the ventral anterior cingulate and medial prefrontal cortex. Am J Psychiatry 1999; 156:1149–1158; correction, 156:1666Google Scholar
15. Devinsky O, Morrell MJ, Vogt BA: Contributions of anterior cingulate cortex to behaviour. Brain 1995; 118:279–306Crossref, Medline, Google Scholar
16. Vogt BA, Nimchinsky EA, Vogt LJ, Hof PR: Human cingulate cortex: surface features, flat maps, and cytoarchitecture. J Comp Neurol 1995; 359:490–506Crossref, Medline, Google Scholar
17. Coryell W, Endicott J, Keller M: Outcome of patients with chronic affective disorder: a five-year follow-up. Am J Psychiatry 1990; 147:1627–1633Google Scholar
18. Pascual-Marqui RD: Review of methods for solving the EEG inverse problem. Int J Bioelectromagnetism 1999; 1:75–86Google Scholar
19. Pascual-Marqui RD, Lehmann D, Koenig T, Kochi K, Merlo MCG, Hell D, Koukkou M: Low resolution brain electromagnetic tomography (LORETA) functional imaging in acute, neuroleptic-naive, first-break, productive schizophrenics. Psychiatry Res Neuroimaging 1999; 90:169–179Crossref, Medline, Google Scholar
20. Pascual-Marqui RD, Michel CM, Lehmann D: Low resolution electromagnetic tomography: a new method for localizing electrical activity in the brain. Int J Psychophysiol 1994; 18:49–65Crossref, Medline, Google Scholar
21. Asada H, Fukuda Y, Tsunoda S, Yamaguchi M, Tonoike M: Frontal midline theta rhythms reflect alternative activation of prefrontal cortex and anterior cingulate cortex in humans. Neurosci Lett 1999; 274:29–32Crossref, Medline, Google Scholar
22. Gevins A, Smith ME, McEvoy L, Yu D: High-resolution EEG mapping of cortical activation related to working memory: effects of task difficulty, type of processing, and practice. Cereb Cortex 1997; 7:374–385Crossref, Medline, Google Scholar
23. Ishii R, Shinosaki K, Ukai S, Inouye T, Ishihara T, Yoshimine T, Hirabuki N, Asada H, Kihara T, Robinson SE, Takeda M: Medial prefrontal cortex generates frontal midline theta rhythm. Neuroreport 1999; 10:675–679Crossref, Medline, Google Scholar
24. Larson CL, Davidson RJ, Abercrombie HC, Ward RT, Schaefer SM, Jackson DC, Holden JE, Perlman SB: Relations between PET-derived measures of thalamic glucose metabolism and EEG alpha power. Psychophysiology 1998; 35:162–169Crossref, Medline, Google Scholar
25. Lindgren KA, Larson CL, Schaefer SM, Abercrombie HC, Ward RT, Oakes TR, Holden JE, Perlman SB, Benca RM, Davidson RJ: Thalamic metabolic rate predicts EEG alpha power in healthy control subjects but not in depressed patients. Biol Psychiatry 1999; 45:943–952Crossref, Medline, Google Scholar
26. Spitzer RL, Williams JBW, Gibbon M, First MB: Structured Clinical Interview for DSM-III-R (SCID). Washington, DC, American Psychiatric Press, 1992Google Scholar
27. Chapman LJ, Chapman JP: The measurement of handedness. Brain Cogn 1987; 6:175–183Crossref, Medline, Google Scholar
28. Beck AT, Ward CH, Mendelson M, Mock J, Erbaugh J: An inventory for measuring depression. Arch Gen Psychiatry 1961; 4:561–571Crossref, Medline, Google Scholar
29. Hamilton M: A rating scale for depression. J Neurol Neurosurg Psychiatry 1960; 23:56–62Crossref, Medline, Google Scholar
30. Spielberger CD, Gorsuch RL, Lushene RD: STAI Manual. Palo Alto, Calif, Consulting Psychologists Press, 1970Google Scholar
31. Watson D, Clark LA, Tellegen A: Development and validation of brief measures of positive and negative affect: the PANAS scales. J Pers Soc Psychol 1988; 54:1063–1070Google Scholar
32. American Electroencephalographic Society guidelines for standard electrode position nomenclature. J Clin Neurophysiol 1991; 8:200–202Crossref, Medline, Google Scholar
33. Abercrombie HC, Schaefer SM, Larson CL, Oakes TR, Lindgren KA, Holden JE, Perlman SB, Turski PA, Krahn DD, Benca RM, Davidson RJ: Metabolic rate in the right amygdala predicts negative affect in depressed patients. Neuroreport 1998; 9:3301–3307Google Scholar
34. Scherg M, Von Cramon D: Evoked dipole source potentials of the human auditory cortex. Electroencephalogr Clin Neurophysiol 1986; 65:344–360Crossref, Medline, Google Scholar
35. Llinas RR: The intrinsic electrophysiological properties of mammalian neurons: insights into central nervous system function. Science 1988; 242:1654–1664Google Scholar
36. Worrell GA, Lagerlund TD, Sharbrough FW, Brinkmann BH, Busacker NE, Cicora KM, O’Brien TJ: Localization of the epileptic focus by low-resolution electromagnetic tomography in patients with a lesion demonstrated by MRI. Brain Topogr 2000; 12:273–282Crossref, Medline, Google Scholar
37. Pizzagalli D, Lehmann D, Koenig T, Regard M, Pascual-Marqui RD: Face-elicited ERPs and affective attitude: brain electric microstate and tomography analyses. Clin Neurophysiol 2000; 111:521–531Crossref, Medline, Google Scholar
38. Strik WK, Fallgatter AJ, Brandeis D, Pascual-Marqui RD: Three-dimensional tomography of event-related potentials during response inhibition: evidence for phasic frontal lobe activation. Electroencephalogr Clin Neurophysiol 1998; 108:406–413Crossref, Medline, Google Scholar
39. Talairach J, Tournoux P: Co-Planar Stereotaxic Atlas of the Human Brain: Three-Dimensional Proportional System. Stuttgart, Germany, Georg Thieme, 1988Google Scholar
40. Towle VL, Bolanos J, Suarez D, Tan K, Grzeszczuk R, Levin DN, Cakmur R, Frank SA, Spire J-P: The spatial location of EEG electrodes: locating the best-fitting sphere relative to cortical anatomy. Electroencephalogr Clin Neurophysiol 1993; 86:1–6Crossref, Medline, Google Scholar
41. Arndt S, Cizadlo T, Andreasen NC, Heckel D, Gold S, O’Leary DS: Tests for comparing images based on randomization and permutation methods. J Cereb Blood Flow 1996; 16:1271–1279Google Scholar
42. Holmes AP, Blair RC, Watson JDG, Ford I: Non-parametric analysis of statistic images from functional mapping experiments. J Cereb Blood Flow Metab 1996; 16:7–22Crossref, Medline, Google Scholar
43. Lancaster JL, Rainey LH, Summerlin JL, Freitas CS, Fox PT, Evans AC, Toga AW, Mazziotta JC: Automated labeling of the human brain—a preliminary report on the development and evaluation of a forward-transform method. Hum Brain Mapp 1997; 5:238–242Crossref, Medline, Google Scholar
44. Volkow ND, Logan J, Fowler JS, Wang G-J, Gur RC, Wong C, Felder C, Gatley SJ, Ding Y-S, Hitzemann R, Pappas N: Association between age-related decline in brain dopamine activity and impairment in frontal and cingulate metabolism. Am J Psychiatry 2000; 157:75–80Link, Google Scholar
45. Basar-Eroglu C, Basar E, Demiralp T, Schurmann M: P300-response: possible psychophysiological correlates in delta and theta frequency channels: a review. Int J Psychophysiol 1992; 13:161–179Crossref, Medline, Google Scholar
46. Klimesch W: EEG alpha and theta oscillations reflect cognitive and memory performance: a review and analysis. Brain Res Brain Res Rev 1999; 29:169–195Crossref, Medline, Google Scholar
47. Sasaki K, Nambu A, Tsujimoto T, Matsuzaki R, Kyuhou S, Gemba H: Studies on integrative functions of the human frontal association cortex with MEG. Brain Res Cogn Brain Res 1996; 5:165–174Crossref, Medline, Google Scholar
48. Bench CJ, Frackowiak RS, Dolan RJ: Changes in regional cerebral blood flow on recovery from depression. Psychol Med 1995; 25:247–261Crossref, Medline, Google Scholar
49. Buchsbaum MS, Wu J, Siegel BV, Hackett E, Trenary M, Abel L, Reynolds C: Effect of sertraline on regional metabolic rate in patients with affective disorder. Biol Psychiatry 1997; 41:15–22Crossref, Medline, Google Scholar
50. Mayberg HS, Liotti M, Brannan SK, McGinnis S, Mahurin RK, Jerabek PA, Silva JA, Tekell JL, Martin CC, Lancaster JL, Fox PT: Reciprocal limbic-cortical function and negative mood: converging PET findings in depression and normal sadness. Am J Psychiatry 1999; 156:675–682Abstract, Google Scholar
51. Smith GS, Reynolds CF III, Pollock B, Derbyshire S, Nofzinger E, Dew MA, Houck PR, Milko D, Meltzer CC, Kupfer DJ: Cerebral glucose metabolic response to combined total sleep deprivation and antidepressant treatment in geriatric depression. Am J Psychiatry 1999; 156:683–689Abstract, Google Scholar
52. Abercrombie HC, Schaefer SM, Larson CL, Oakes TR, Holden JE, Perlman SB, Benca RM, Krahn DD, Davidson RJ: Further evidence for cingulate function as a predictor of treatment response in depression (abstract). Neuroimage 1999; 9:S367Google Scholar
53. Whalen PJ, Bush G, McNally RJ, Wilhelm S, McInerney SC, Jenike MA, Rauch SL: The emotional Stroop paradigm: a functional magnetic resonance imaging probe of the anterior cingulate affective division. Biol Psychiatry 1998; 44:1219–1228Google Scholar
54. George MS, Ketter TA, Parekh PI, Horwitz B, Herscovitch P, Post RM: Brain activity during transient sadness and happiness in healthy women. Am J Psychiatry 1995; 152:341–351Link, Google Scholar
55. Lane RD, Fink GR, Chau PM, Dolan RJ: Neural activation during selective attention to subjective emotional responses. Neuroreport 1997; 8:3969–3972Google Scholar
56. Lane RD, Reiman EM, Axelrod B, Yun LS, Holmes A, Schwartz GE: Neural correlates of levels of emotional awareness: evidence of an interaction between emotion and attention in the anterior cingulate cortex. J Cogn Neurosci 1998; 10:525–535Crossref, Medline, Google Scholar
57. Phillips ML, Bullmore ET, Howard R, Woodruff PW, Wright IC, Williams SC, Simmons A, Andrew C, Brammer M, David AS: Investigation of facial recognition memory and happy and sad facial expression perception: an fMRI study. Psychiatry Res Neuroimaging 1998; 83:127–138Crossref, Medline, Google Scholar
58. Murtha S, Chertkow H, Beauregard M, Dixon R, Evans A: Anticipation causes increased blood flow to the anterior cingulate cortex. Hum Brain Mapp 1996; 4:103–112Crossref, Medline, Google Scholar
59. Bush G, Whalen PJ, Rosen BR, Jenike MA, McInerney SC, Rauch S: The counting Stroop: an interference task specialized for functional neuroimaging—validation study with functional MRI. Hum Brain Mapp 1998; 6:270–282Crossref, Medline, Google Scholar
60. Woldorff MG, Matzke M, Zamarripa F, Fox PT: Hemodynamic and electrophysiological study of the role of the anterior cingulate in target-related processing and selection for action. Hum Brain Mapp 1999; 8:121–127Crossref, Medline, Google Scholar
61. Carter CS, Macdonald AM, Botvinick M, Ross LL, Stenger VA, Noll D, Cohen JD: Parsing executive processes: strategic vs evaluative functions of the anterior cingulate cortex. Proc Natl Acad Sci USA 2000; 97:1944–1948Google Scholar
62. Mega MS, Cummings JL, Salloway S, Malloy P: The limbic system: an anatomic, phylogenetic, and clinical perspective. J Neuropsychiatry Clin Neurosci 1997; 9:315–330Crossref, Medline, Google Scholar
63. Schultz W: Predictive reward signal of dopamine neurons. J Neurophysiol 1998; 80:1–27Crossref, Medline, Google Scholar
64. Damasio AR, Van Hoesen GW: Emotional disturbances associated with focal lesions of the limbic frontal lobe, in Neuropsychology of Human Emotion. Edited by Heilman KM, Satz P. New York, Guilford Press, 1983, pp 85–110Google Scholar