Hypnotic Visual Illusion Alters Color Processing in the Brain
Abstract
OBJECTIVE: This study was designed to determine whether hypnosis can modulate color perception. Such evidence would provide insight into the nature of hypnosis and its underlying mechanisms. METHOD: Eight highly hypnotizable subjects were asked to see a color pattern in color, a similar gray-scale pattern in color, the color pattern as gray scale, and the gray-scale pattern as gray scale during positron emission tomography scanning by means of [15O]CO2. The classic color area in the fusiform or lingual region of the brain was first identified by analyzing the results when subjects were asked to perceive color as color versus when they were asked to perceive gray scale as gray scale. RESULTS: When subjects were hypnotized, color areas of the left and right hemispheres were activated when they were asked to perceive color, whether they were actually shown the color or the gray-scale stimulus. These brain regions had decreased activation when subjects were told to see gray scale, whether they were actually shown the color or gray-scale stimuli. These results were obtained only during hypnosis in the left hemisphere, whereas blood flow changes reflected instructions to perceive color versus gray scale in the right hemisphere, whether or not subjects had been hypnotized. CONCLUSIONS: Among highly hypnotizable subjects, observed changes in subjective experience achieved during hypnosis were reflected by changes in brain function similar to those that occur in perception. These findings support the claim that hypnosis is a psychological state with distinct neural correlates and is not just the result of adopting a role.
Hypnosis has a long and checkered history; at times it has been accepted as a genuine psychological state with unique consequences, and at other times it has been treated as nothing more than stage-show gimmickry. In contemporary psychology and psychiatry, these two views have crystallized in a debate. On one side are those who claim that hypnosis is a distinct psychological state of focused attention that allows one to dissociate sensations, to attend very precisely and intently to thoughts or events, and to marshal one’s resources in unusual ways (1–4). On the other side are those who equate hypnosis with acting, claiming that it is simply a role that people can adopt in which they cooperate with the wishes of the hypnotist (5, 6).
One way to distinguish between the two views of hypnosis is to show that it selectively alters neural mechanisms that should underlie a hypnotically induced experience (compare with reference 7). According to this logic, people cannot voluntarily alter the workings of the neural mechanisms that underlie a specific experience—for example, those involved in perception—unless they have the experience. The initial studies that adopted this approach relied primarily on event-related potentials and did in fact find that hypnotic sensory alteration is associated with changes in those potentials (8–11). However, this technique does not allow one to localize activity in the brain precisely, and one could argue that it is possible that the effort of “adopting a role” affects event-related potentials. For example, Jasiukaitis et al. (11) asked subjects to view obstructions on the left or right side of the visual field and showed that some components of event-related potentials to signals on the obstructed side were diminished and that these effects were different from simple inattention. However, one could argue that the subjects simply did not look as carefully on these sides, defocused their eyes, or even averted their gaze. Although the absence of latency differences makes this explanation unlikely, a paradigm that requires consistent attention to the stimulus and provides better brain localization of effects is necessary to clarify the relationship between hypnotic experience and brain function.
The more recent imaging techniques provide excellent brain localization, but comparatively little use of such techniques has been made in studying hypnosis (12–16), and the results have been inconsistent. There is some evidence that hypnotic analgesia, which involves somatosensory imagery, is associated with increased blood flow in the somatosensory cortex as well as the orbitofrontal cortex (17). However, a more recent positron emission tomography (PET) study has indicated that hypnotic reduction of the perceived unpleasantness of a stimulus is associated with significant changes in pain-evoked activity within the anterior cingulate but not in the somatosensory cortex (18). In addition, Szechtman et al. (19) measured regional cerebral blood flow (rCBF) by means of PET while highly hypnotizable subjects were hypnotized and asked to produce vivid auditory hallucinations. Subjects who could produce the hallucinations (eight of the 14 tested) had increased rCBF in the right anterior cingulate gyrus, and the externality and clarity of the hallucinations were highly correlated with blood flow in this region. By contrast, those who could not hallucinate had activation in the auditory association cortex (Brodmann’s area 22) but not in the anterior cingulate. Moreover, during the actual hearing of sounds, the hallucinators showed greater activation in the temporal lobe auditory regions than did those who could not hallucinate, which may suggest that hallucinatory abilities can also be mobilized to amplify ordinary perception. However, because all of the subjects in this important study were formally hypnotized, it is more informative about the neurophysiology of hallucination than about the effects of being hypnotized per se.
Earlier research on hypnotic hallucination and color vision did not resolve this debate because it confirmed the subjective but not the objective reality of perceptual distortion by examining behavioral consequences, such as Stroop task performance (20), the ability to discriminate color (21), and the effect of a hypnotically induced color filter on detecting faint visual targets (22). These studies concluded that further understanding must come from more direct examination of brain processes underlying hypnotic perceptual alteration (21).
In the present study we used PET to examine the neural basis of hypnosis because PET is silent and affords good localization within the brain. We asked eight highly hypnotizable subjects to view color patterns and the same patterns drained of hue. Subjects either were to see the patterns as they appeared or to add color to the gray-scale pattern or to drain it from the color pattern. Half of the time the subjects were hypnotized, and half of the time they were not. We examined color perception because brain areas sensitive to hue have been isolated (e.g., references 23–25), and we reasoned that no amount of peripheral activity or acting could induce activation in those areas when subjects were told to see color although no color was in fact present.
Method
Eight subjects (six women and two men) participated as paid volunteers recruited through advertisements posted at Harvard University. The research was approved by the Harvard University Faculty of Arts and Sciences Committee on the Use of Human Subjects and by the Massachusetts General Hospital Human Research Committee. Subjects had a mean age of 24 years (range=20–35). Scores on the Hypnotic Induction Profile (4) and the Stanford Hypnotic Susceptibility Scale: Form C (26) were obtained from a total of 125 subjects. Possible scores on the Hypnotic Induction Profile ranged from 0 to 10, and scores on the Standard Hypnotic Susceptibility Scale ranged from 0 to 12. The subjects included in the study scored 9–10 on the Hypnotic Induction Profile (mean score=9.1) and 10–11 on the Standard Hypnotic Susceptibility Scale (mean score=10.5). Subjects were not only prescreened with the hypnotizability scales but also evaluated and selected on the basis of their performance of the task. Subjects were shown both the color and gray-scale stimuli during the screening session, and after hypnotic induction, they were asked to drain the color from the color stimulus, add color to the gray-scale one, and report whether they could do so. All subjects included in the study reported being able to alter the stimuli during the screening session. Eight other subjects selected for being extremely low in hypnotizability were also scanned but were unable to perform the visual hallucination task, and their blood flow results were inconsistent. After complete description of the study to the subjects, written informed consent was obtained, and subjects were positioned in the PET scanner.
PET Procedures
Briefly, subjects were aligned relative to the canthomeatal line and fitted with a thermoplastic face mask, a set of nasal cannulae, and a vacuum mask. Transmission measurements were taken with an orbiting rod source before scanning. Subjects were imaged for a total of 1 minute per condition by means of [15O]CO2. Approximately 10 minutes separated each condition. The PET machine was a General Electric Scanditronix PC4096, 15-slice, whole-body tomograph (Uppsala, Sweden). The PET scanning procedures used at Massachusetts General Hospital have been described in detail previously (27, 28).
Task Procedures
Each subject performed four tasks after having undergone hypnotic induction and four tasks with no hypnotic induction. The order of hypnotic states was balanced so that one-half the subjects began with the hypnosis block and one-half began with the no-hypnosis block. Within each block (hypnosis and no hypnosis), subjects were presented with a rectangular color stimulus that itself was made up of a set of smaller rectangles, thus making the stimulus resemble a painting by the Dutch artist Piet Mondrian. The stimuli appeared on a 13-inch color monitor placed at a distance of approximately 50 cm from the subject’s eyes. As illustrated in Figure 1, there was also a gray-scale version of the stimulus, which was produced to have comparable saturation and intensity differences as the color one but with no variations in hue.
All subjects received the following four conditions twice, once after the hypnotic induction procedure and once without hypnosis: 1) subjects were shown the color stimulus and asked to perceive it veridically (i.e., in color); 2) subjects were shown the color stimulus but asked to drain the color from it, visualizing the stimulus as if it were in shades of gray; 3) subjects were shown the gray-scale stimulus and asked to perceive it as it was; and 4) subjects were shown the gray-scale stimulus but asked to add color, visualizing it as if it were a color stimulus. Subjects were always asked to experience the stimulus in a certain way (i.e., veridically or altered) for the entire duration of the scan. The order of the blocks and conditions within a block was counterbalanced, except that the color stimulus was always presented first because we wanted subjects to know what the stimulus looked like when variations in hues were present.
In the hypnosis condition before scanning began, the subjects were asked to alter actively the stimulus, to drain or add color while focusing on the altered stimuli. They were asked to alter their perception of the stimuli as much as possible and to let the investigators know when they had successfully added or drained the color. The no-hypnosis condition was identical to the hypnosis condition except that when subjects were asked to perceive the gray-scale stimulus in color or vice versa, they were asked to try to “remember and visualize” the stimulus in its other form. Thus, the no-hypnosis condition served as a mental imagery control for the hypnosis condition. The wording used here was chosen to lead subjects to attend to the visible stimulus and to alter it, rather than to substitute a complete hallucination for the observed pattern. The instructions for this condition were worded to avoid leading the subjects, who were all highly hypnotizable, to fall into a hypnotic state during performance of the task.
PET Statistical Analysis
We analyzed the resulting data with the statistical parametric mapping technique (29–31) by means of the SPM 95 software package (Wellcome Department of Cognitive Neurology, London). At each voxel, the data acquired during PET scanning were normalized to a global mean of 50 ml/min/100 g and fit by the method of least squares to a linear model. Cognitive state (i.e., scan condition) was considered the main effect in the resulting analysis of variance (ANOVA) comparisons, and subjects were considered a block effect. Planned contrasts at each voxel were carried out. This technique fits a linear statistical model, voxel by voxel, to the data; hypotheses are tested as contrasts in which differences between conditions are evaluated by means of the t statistic. Data from all conditions were used to compute the contrast error term. Any z scores greater than 3.29 (p<0.001, uncorrected, two-tailed) were considered to meet statistical significance, except in the case of the lingual or fusiform gyri, where a strong hypothesis based on earlier results led us to expect greater activation during the viewing of color. In this case, we set the threshold at 3.09 (p<0.001, uncorrected, one-tailed). We considered these thresholds to be a compromise between the higher thresholds suggested by Gaussian fields theory, which supposes no previous hypotheses regarding the anatomic localization of activations, and simple statistical theories that fail to take into account the spatial correlations necessarily encountered with PET and other neuroimaging methods (32).
The region-of-interest analyses were performed by means of software developed at Massachusetts General Hospital. The software permitted the tracing of a region of specified size and shape onto the statistical image outputs of SPM 95. Thus, values averaged over the voxels in the traced regions were extracted and later submitted to ANOVA comparisons between the conditions by means of the SuperANOVA program (Abacus Concepts, Berkeley, Calif.) for the Macintosh.
Results
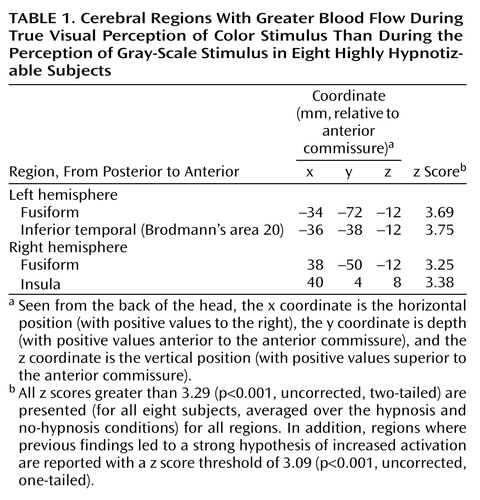
We began by examining the results when subjects viewed color versus gray-scale stimuli and were told to see them veridically. Table 1 notes all areas activated with z>3.29 or 3.09 (for strongly predicted regions), and Figure 2 illustrates activation found in the left and right fusiform areas. As is evident, color is processed by a circuit, not a single area. However, it is notable that we found activation in the lingual or fusiform area, as reported by Lueck et al. (23), Corbetta et al. (24), Chao and Martin (25), and Allison et al. (33). We defined a region of interest with a 10-mm radius in the left hemisphere fusiform area at coordinates –34, –72, and –12 and another in the right hemisphere at coordinates 38, –50, and –12, both of which were activated during color perception. The locations of these two regions are clearly consistent with those from previous reports.
The results are illustrated in Figure 3 and Figure 4. We began by analyzing data from both regions of interest in an ANOVA. This analysis revealed that both the presentation of color (F=8.69, df=1, 7, p=0.02) and the perception of color independent of presentation (F=8.98, df=1, 7, p=0.02) resulted in greater blood flow than the presentation or perception of shades of gray. The hypnotic illusion of color induced blood flow change consistent with actually observing color. In addition, we found greater blood flow in the right hemisphere color region than in the left (F=5.30, df=1, 7, p=0.05). Moreover, the effect of what was presented was greater in the left hemisphere than in the right hemisphere (F=8.22, df=1, 7, p=0.02), and the effect of hypnosis on what was perceived was different in the two hemispheres (F=9.43, df=1, 7, p<0.02) for the interaction of state, color perception, and hemisphere. No other main effects or interactions were significant, including the state of being hypnotized.
Given the interactions with hemisphere, we next analyzed the two regions of interest separately. Figure 3 illustrates the results from the left region of interest. As in the initial analysis of the perception conditions, we found greater blood flow when color was displayed than when gray scale was displayed (F=11.96, df=1, 7, p=0.01), with means of 55.4 ml/min/100 g (SD=4.7) and 53.7 ml/min/100 g (SD=3.9), respectively. However, we also found greater blood flow when color was perceived than when gray scale was perceived, independent of what was actually presented (F=8.68, df=1, 7, p<0.03), with means of 55.1 ml/min/100 g (SD=4.6) and 54.0 ml/min/100 g (SD=4.0), respectively. In addition, we found that blood flow in the left region of interest varied with instruction to perceive color versus gray scale only when the subjects were formally hypnotized (F=21.48, df=1, 7, p<0.003, for the interaction of hypnotic state and stimulus perceived). Indeed, although the difference between the effects of instruction to perceive color versus gray scale was robust during hypnosis (t=7.8, df=7, p<0.0001), there was no effect when subjects were not hypnotized (t=1.3, df=7, p>0.25).
We next performed least squares means comparisons (Bonferroni-corrected to an alpha level of 0.008) on the interaction between hypnotic state and stimulus perceived. These tests revealed significant differences for three pairs of comparisons: “hypnosis, color perceived” versus “hypnosis, gray scale perceived”; “hypnosis, color perceived” versus “no hypnosis, gray scale perceived”; and “hypnosis, color perceived” versus “no hypnosis, color perceived” (t=7.8, df=7, p=0.0001; t=6.2, df=7, p=0.0004; and t=5.0, df=7, p=0.002, respectively). Thus, the “hypnosis, color perceived” condition resulted in significantly greater blood flow to the region of interest in all comparisons where it was examined. Not significant after correction were the “hypnosis, gray scale perceived” versus “no hypnosis, color perceived” (t=2.8, df=7, p<0.03), the “no hypnosis, color perceived” versus “no hypnosis, gray scale perceived” (t=1.2, df=7, p>0.25), and the “hypnosis, gray scale perceived” versus the “no hypnosis, gray scale perceived” (t=1.6, df=7, p>0.15) comparisons.
As indicated by the interactions with hemisphere in the main analysis, we found some different results in the right hemisphere color processing region. As illustrated in Figure 4, the only factor that affected blood flow in the right region of interest was what subjects were asked to perceive (F=7.76, df=1, 7, p<0.03), with means of 58.1 ml/min/100 g (SD=3.5) for gray scale and 59.7 ml/min/100 g (SD=2.5) for color. No other main effect or interaction, including those with the state of being hypnotized, approached significance (p>0.13). The instruction to perceive the stimulus as color or gray scale overrode the effect of the actual stimulus presented, with means of 58.7 ml/min/100 g (SD=2.9) and 59.1 ml/min/100 g (SD=2.9) for gray scale and color stimuli, respectively (F=3.6, df=1, 7, p>0.20).
The means in the interaction between displayed and perceived colors revealed that in all cases asking the subjects to perceive color produced more activation than asking them to perceive gray scale. Least squares means contrasts (Bonferroni-corrected to an alpha level of 0.008) for multiple comparisons performed on all possible pairs revealed that these differences were all significant, with the exception of the “gray scale displayed, color perceived” versus “color displayed, gray scale perceived” comparison, which was just below the significance threshold after correction for multiple comparisons (t=3.3, df=7, p=0.01). For all other comparisons between conditions where subjects were asked to perceive color or gray scale, t values ranged from 4.34 to 5.98 and p values from 0.003 to 0.0006, df=7. Moreover, the amount of activation was the same when subjects perceived color that was presented versus when they visualized it on seeing gray scale (t=1.0, df=7, p>0.33) and when they perceived gray scale that was presented versus when they visualized it on seeing color (t=1.6, df=7, p>0.14).
Discussion
The results of this study revealed that people who are highly hypnotizable can modulate the neural responses underlying color perception by both enhancing these responses and diminishing them. The left hemisphere color area registered what they were told to see only when subjects were formally hypnotized. In contract, the right hemisphere region of interest registered what the subjects were told to see (independently of what was actually presented), whether or not they were formally hypnotized. The right hemisphere appeared to respond to imagery per se, whereas the left required the additional boost provided by hypnosis.
Our findings are consistent with those of Howard et al. (34), who reported that ordinary mental imagery of color activated only the right fusiform area, not the left. Thus, our findings in the left hemisphere could not have been produced by mental imagery alone. If we had found only results in the right color area, we would simply have extended the findings of Howard et al. (34), showing not only that imagery can activate these areas but also that it can literally override perceptual input. However, our results are stronger than that. We also found that hypnosis can activate the left color area in a way that imagery alone does not. This finding is consistent with results from a recent study by Maquet et al. (15), who used PET to examine the functional aspects of the hypnotic state. They reported a predominance of left-side activation during hypnosis, as well as many areas that overlap with those found in studies of visual mental imagery (11; see also reference 35). They concluded that multimodal mental imagery is an integral part of the hypnotic experience. Rainville et al. (16) reached similar conclusions about the role of imagery and proposed that the predominance of left hemisphere activations may be due to verbal mediation of hypnotic suggestions, working memory functions, and top-down processes that may reinterpret the sensory experience.
The results in the right hemisphere are not as easily interpreted as those in the left and must therefore be viewed with caution. It is possible that the right-side activation across hypnotic and nonhypnotic conditions reflects not only the effects of imagery per se but also the trait of hypnotizability; however, our data do not allow us to address this issue directly, and so the resolution of this important question of distinctions between state and trait must be left to future investigations.
We conclude that hypnosis is not simply role enactment. Consistent with other recent work (19), we find that the vivid changes in subjective experience attained under these hypnotic conditions are associated with changes in brain function that are typical of differences in actual perception among highly hypnotizable subjects.
 |
Received June 28, 1999; revised Dec. 23, 1999; accepted Dec. 30, 1999. From the Department of Psychology, Harvard University; the Department of Neurology and the Department of Radiology, Massachusetts General Hospital, Boston; Weill Medical College, Cornell University, New York; and the Department of Psychiatry and Behavioral Sciences, School of Medicine, Stanford University, Stanford, Calif. Address reprint requests to Dr. Kosslyn, Department of Psychology, Harvard University, 830 William James Hall, 33 Kirkland St., Cambridge, MA 02138; [email protected] (e-mail).Supported by a grant from the Mind/Body Network of the John D. and Catherine T. MacArthur Foundation.The authors thank Sandra Barrow, Benjamin Martin Bly, Christopher Chabris, Avis Loring, Katherine Sukel, Steve Weise, and the Massachusetts General Hospital cyclotron staff for comments and technical assistance.

Figure 1. Stimuli Used in a Study of Color Perception in Eight Highly Hypnotizable Subjectsa
aSubjects were asked to see these stimuli as they actually appeared or to see the color one as if it were only in shades of gray and to see the gray-scale one as if it were in colorThe gray-scale version of the figure was produced to have comparable saturation and intensity as the color figure but with no variation in hue. The color and gray-scale stimuli, as reproduced in print, will vary slightly from the original ones viewed by study participants on a computer monitor.

Figure 2. PET Image of Perceptually Driven Color Activation in Eight Highly Hypnotizable Subjectsa
aThe named areas were activated more when the subjects were told to view veridically a color stimulus than when they were told to view veridically a gray-scale stimulusThe transverse slice pictured is 12 mm below the line connecting the anterior commissure and posterior commissure. The z-score threshold for this image was 3.09.

Figure 3. Normalized Regional Cerebral Blood Flow (rCBF) in the Left Fusiform Region of Eight Highly Hypnotizable Subjects Viewing Color and Gray-Scale Stimulia
aNormalized rCBF was greater when a color stimulus was displayed than when a gray-scale stimulus was displayed (F=1196, df=1, 7, p=0.01) and was greater when the subjects were instructed to perceive color than when they were instructed to perceive gray scale (F=8.68, df=1, 7, p<0.03). However, the instruction to perceive color resulted in greater blood flow only in the hypnosis condition (F=21.48, df=1, 7, p<0.003).

Figure 4. Normalized Regional Cerebral Blood Flow (rCBF) in the Right Fusiform Region of Eight Highly Hypnotizable Subjects Viewing Color and Gray-Scale Stimulia
aGreater rCBF resulted from the instruction to perceive color than from the instruction to perceive shades of gray (F=776, df=1, 7, p<0.03).
1. Hilgard ER: Hypnotic Susceptibility. New York, Harcourt, Brace & World, 1965Google Scholar
2. Hilgard ER, Hilgard JR: Hypnosis in the Relief of Pain. Los Altos, Calif, William Kaufmann, 1975Google Scholar
3. Kihlstrom JF: The cognitive unconscious. Science 1987; 237:1445–1452Google Scholar
4. Spiegel H, Spiegel D: Trance and Treatment: Clinical Uses of Hypnosis. Washington, DC, American Psychiatric Press, 1987Google Scholar
5. Barber TX: Physiological effects of “hypnosis.” Psychol Bull 1961; 58:390–419Crossref, Medline, Google Scholar
6. Spanos NP: Hypnotic behavior: a social-psychological interpretation of amnesia, analgesia, and “trance logic.” Behav Brain Sci 1986; 9:449–502Crossref, Google Scholar
7. Spiegel D: Neurophysiological correlates of hypnosis and dissociation. J Neuropsychiatry Clin Neurosci 1991; 3:440–445Crossref, Medline, Google Scholar
8. Barabasz AF, Lonsdale C: Effects of hypnosis on P300 olfactory-evoked potential amplitudes. J Abnorm Psychol 1983; 92:520–523Crossref, Medline, Google Scholar
9. Spiegel D, Cutcomb S, Ren C, Pribram K: Hypnotic hallucination alters evoked potentials. J Abnorm Psychol 1985; 94:249–255Crossref, Medline, Google Scholar
10. Spiegel D, Bierre P, Rootenberg J: Hypnotic alteration of somatosensory perception. Am J Psychiatry 1989; 146:749–754Link, Google Scholar
11. Jasiukaitis P, Nouriani B, Spiegel D: Left hemisphere superiority for event-related potential effects of hypnotic obstruction. Neuropsychologia 1996; 34:661–668Crossref, Medline, Google Scholar
12. Sabourin ME, Cutcomb SD, Crawford HJ, Pribram K: EEG correlates of hypnotic susceptibility and hypnotic trance: spectral analysis and coherence. Int J Psychophysiol 1990; 10:125–142Crossref, Medline, Google Scholar
13. Graffin NF, Ray WJ, Lundy R: EEG concomitants of hypnosis and hypnotic susceptibility. J Abnorm Psychol 1995; 104:123–131Crossref, Medline, Google Scholar
14. Baer L, Ackerman R, Surman O, Correia J, Griffith J, Alpert N, Hackett T: PET studies during hypnosis and hypnotic suggestion, in Psychiatry: The State of the Art, Vol 2: Biological Psychiatry, Higher Nervous Activity. Edited by Berner P. New York, Plenum, 1985, pp 293–298Google Scholar
15. Maquet P, Faymonville ME, Degueldre C, Delfiore G, Franck G, Luxen A, Lamy M: Functional neuroanatomy of hypnotic state. Biol Psychiatry 1999; 45:327–333Crossref, Medline, Google Scholar
16. Rainville P, Hofbauer RK, Paus T, Duncan GH, Bushnell MC, Price DD: Cerebral mechanisms of hypnotic induction and suggestion. J Cogn Neurosci 1999; 11:110–125Crossref, Medline, Google Scholar
17. Crawford HJ, Gur RC, Skolnick B, Gur RE, Benson DM: Effects of hypnosis on regional cerebral blood flow during ischemic pain with and without suggested hypnotic analgesia. Int J Psychophysiol 1993; 15:181–195Crossref, Medline, Google Scholar
18. Rainville P, Duncan GH, Price DD, Carrier B, Bushnell MC: Pain affect encoded in human anterior cingulate but not somatosensory cortex. Science 1997; 277:968–971Crossref, Medline, Google Scholar
19. Szechtman H, Woody E, Bowers KS, Nahmias C: Where the imaginal appears real: a positron emission tomography study of auditory hallucinations. Proc Natl Acad Sci USA 1998; 95:1956–1960Google Scholar
20. Harvey MA, Sipprelle CN: Color blindness, perceptual interference, and hypnosis. Am J Clin Hyp 1978; 20:189–193Crossref, Medline, Google Scholar
21. Cunningham PV, Blum GS: Further evidence that hypnotically induced color blindness does not mimic congenital defects. J Abnorm Psychol 1982; 91:139–143Crossref, Medline, Google Scholar
22. Miller RJ, Lundy RM, Galbraith GG: Effects of hypnotically induced hallucination of a color filter. J Abnorm Psychol 1970; 76:316–319Crossref, Medline, Google Scholar
23. Lueck CJ, Zeki S, Friston KJ, Deiber MP, Cope P, Cunningham VJ, Lammertsma AA, Kennard C, Frackowiak RS: The colour centre of the cerebral cortex in man. Nature 1989; 340:386–389Crossref, Medline, Google Scholar
24. Corbetta M, Miezin FM, Dobmeyer S, Shulman GL, Petersen SE: Selective and divided attention during visual discriminations of shape, color, and speed: functional anatomy by positron emission tomography. J Neurosci 1991; 11:2383–2402Google Scholar
25. Chao LL, Martin A: Cortical regions associated with perceiving, naming, and knowing about colors. J Cogn Neurosci 1999; 11:25–35Crossref, Medline, Google Scholar
26. Weitzenhoffer AM, Hilgard ER: Stanford Hypnotic Susceptibility Scale: Form C. Palo Alto, Calif, Consulting Psychologists Press, 1962Google Scholar
27. Kosslyn SM, Alpert NM, Thompson WL, Chabris CF, Rauch SL, Anderson AK: Identifying objects seen from different viewpoints: a PET investigation. Brain 1994; 117:1055–1071Google Scholar
28. Shin LM, McNally RJ, Kosslyn SM, Thompson WL, Rauch SL, Alpert NM, Metzger LJ, Lasko NB, Orr SP, Pitman RK: Regional cerebral blood flow during script-driven imagery in childhood sexual abuse-related PTSD: a PET investigation. Am J Psychiatry 1999; 156:575–584Abstract, Google Scholar
29. Friston KJ, Holmes AP, Worsley KJ, Poline J-P, Frith CD, Frackowiak RSJ: Statistical parametric maps in functional imaging: a general linear approach. Hum Brain Mapp 1995; 2:189–210Crossref, Google Scholar
30. Friston KJ, Frith CD, Liddle PF, Frackowiak RSJ: Comparing functional (PET) images: the assessment of significant changes. J Cereb Blood Flow Metab 1991; 11:690–699Crossref, Medline, Google Scholar
31. Worsley KJ, Evans AC, Marrett S, Neelin P: A three-dimensional statistical analysis for rCBF activation studies in human brain. J Cereb Blood Flow Metab 1992; 12:900–918Crossref, Medline, Google Scholar
32. Worsley KJ, Marrett S, Neelin P, Vandal AC, Friston KJ, Evans AC: A unified statistical approach for determining significant signals in images of cerebral activation. Hum Brain Mapp 1996; 4:58–73Crossref, Medline, Google Scholar
33. Allison T, Begleiter A, McCarthy G, Roessler E, Nobre AC, Spencer DD: Electrophysiological studies of color processing in human visual cortex. Electroencephalogr Clin Neurophysiol 1993; 88:343–345Crossref, Medline, Google Scholar
34. Howard RJ, ffytche DH, Barnes J, McKeefry D, Ha Y, Woodruff PW, Bullmore ET, Simmons A, Williams SC, David AS, Brammer M: The functional anatomy of imagining and perceiving colour. Neuroreport 1998; 9:1019–1023Google Scholar
35. Jasiukaitis P, Nouriani B, Hugdahl K, Spiegel D: Relateralizing hypnosis: or, have we been barking up the wrong hemisphere? Int J Clin Exp Hypn 1997; 45:158–177Google Scholar