A Validation of Event-Related fMRI Comparisons Between Users of Cocaine, Nicotine, or Cannabis and Control Subjects
Abstract
Objective: Noninvasive brain imaging techniques are a powerful tool for researching the effects of drug abuse on brain activation measures. However, because many drugs have direct vascular effects, the validity of techniques that depend on blood flow measures as a reflection of neuronal activity may be called into question. This may be of particular concern in event-related functional magnetic resonance imaging (fMRI), where current analytic techniques search for a specific shape in the hemodynamic response to neuronal activity. Method: To investigate possible alterations in task-related activation as a result of drug abuse, fMRI scans were conducted on subjects in four groups as they performed a simple event-related finger-tapping task: users of cocaine, nicotine, or cannabis and control subjects. Results: Activation measures, as determined by two different analytic methods, did not differ between the groups. A comparison between an intravenous saline and an intravenous cocaine condition in cocaine users found a similar null result. Further in-depth analyses of the shape of the hemodynamic responses in each group also showed no differences. Conclusions: This study demonstrates that drug groups may be compared with control subjects using event-related fMRI without the need for any post hoc procedures to correct for possible drug-induced cardiovascular alterations. Thus, fMRI activation differences reported between these drug groups can be more confidently interpreted as reflecting neuronal differences.
The investigation of clinical populations to find inherent differences in brain activity is one of the functions of noninvasive brain imaging that has great potential for enhancing our understanding of the brain. Research on the effects of drugs of abuse, in which cognitive and affective as well as direct drug differences are investigated, is one such application. However, given that many drugs may have direct vascular effects and that functional magnetic resonance imaging (fMRI) is an indirect measure of neuronal activity based on blood flow, it is important that researchers determine the extent to which these nonneuronal effects might affect fMRI activation measures. If drugs of abuse do affect cardiovascular properties, then the interpretation of fMRI differences as indicators of between-group neuronal differences is suspect.
Cocaine increases mean arterial blood pressure, reduces cerebral blood volume, and causes cerebral vasoconstriction (1 – 4) . The interaction between complex global and regional vascular changes and the fMRI blood-oxygen-level-dependent (BOLD) signal is still poorly understood (5) , and the literature contains conflicting conclusions on what effects such changes might have. It has been shown that the BOLD signal is affected in chronic cocaine abusers even when no cocaine has been administered; chronic abusers exhibited a significantly enhanced positive BOLD response to photic stimulation compared with control subjects (6) . The duration of prior cocaine use has been demonstrated to predict the relationship between cocaine administration and vasoconstriction (3) , which suggests that cocaine may have a cumulative residual effect that is present whether or not the drug is present in the bloodstream. These studies suggest that a task-induced BOLD fMRI signal may be confounded by chronic vasoconstrictive effects in cocaine users. However, Luo and colleagues (1) showed that the potential confounding factor of changes in mean arterial blood pressure had little effect on the interpretation of cocaine-induced BOLD changes and thus concluded that BOLD fMRI could be extended to map drug-induced neuronal activity. Arriving at a similar conclusion, Gollub and colleagues were able to observe an expected 2%–3% increase in visual stimulus-induced BOLD signal on top of a 14% decrease in baseline blood flow after acute cocaine administration (4) . Breiter and colleagues demonstrated that fMRI can map localized dynamic changes in brain activation after cocaine infusion (7) . Combined, these studies lead us to conclude that although there may be chronic or baseline effects of cocaine on the vasculature that underlies the BOLD signal, it is nonetheless possible with fMRI to observe robust task-induced activation changes in cocaine users.
Nicotine is a prominent and more socially acceptable drug of abuse, and a number of studies have examined the drug’s cognitive and cardiovascular effects. It has been shown that nicotine affects cognitive strategies on working memory tasks (8) and improves attention (9) and performance on working memory tasks (10) . These improvements in performance have been associated with changes in activation in task-relevant areas. There are conflicting opinions on whether administration of nicotine increases (11 , 12) or decreases (13 , 14) cerebral blood flow (CBF), and most studies have found a complex pattern of decreases and increases across the brain. Terborg and colleagues reported that although they discovered significant increases in CBF velocity and levels of oxyhemoglobin and total hemoglobin, no substantial increase in regional CBF was found (15) . However, nicotine has also been found to cause vasodilation (16) , and other evidence suggests that chronic users exhibit a global reduction in CBF (17) . Although little is known about how these increases and decreases would affect the BOLD signal in nicotine users, one study found no evidence for an effect of nicotine on a task-activated BOLD signal response to photic stimulation (18) . Thus, whatever direct effect nicotine has on the vasculature, it may not alter the coupling between BOLD signal and neuronal activity in the cortex.
The effects of marijuana and its active ingredient tetrahydrocannabinol (THC) on cardiovascular function have been the subject of several reviews (19 – 22) . The most commonly observed cardiovascular effect of these drugs in human subjects is a dose-related tachycardia (23 – 26) that follows a time course similar to that seen for the drugs’ psychoactive effects. The overall effect of marijuana and THC is to increase myocardial workload and oxygen demand, and there is some evidence that high doses of cannabinoids can depress the respiratory system in animals (19 , 27) . At the same time, the drugs’ effects on blood pressure are minimal (20 , 26) , and moderate doses of intravenous THC (28) or smoked marijuana (29) in human subjects have not been associated with increases in carbon dioxide. Functional cannabinoid type 1 receptors are found on cerebral blood vessels (22 , 30) , although their functional significance remains unclear. Studies using fMRI have shown that there are individual differences in blood flow reactions to THC (17 , 31) . Mathew and colleagues found that in a majority of subjects, CBF increased after administration of THC and that those in whom it decreased had a significant alteration in time sense (31) . With evidence for both decreases and increases in CBF, even in the same experiment, the effect of THC administration on task-induced BOLD fMRI signal change is not well known.
To summarize, there is evidence that the administration of cocaine, nicotine, or THC has direct cardiovascular effects, but what consequences these effects have on brain vasculature and, more important for our present purposes, on neuronally mediated vascular changes is quite unclear. In chronic abusers of such drugs, cardiovascular properties may be altered permanently, and thus changes in cerebrovascular dynamics may be detected even when the drug of abuse is not present in the system. Such alterations could confound the interpretation of results from fMRI studies in substance-abusing populations. This would be of particular concern when trying to determine differences in brain function between drug abusers and control subjects, and it may be especially problematic in event-related fMRI designs in which hemodynamic responses may overlap, thereby requiring deconvolution analyses that assume robust and linearly additive hemodynamic responses.
In this study, to investigate possible alterations in task-related activation as a result of drug use, we had four groups perform a simple event-related finger-tapping task: users of cocaine, nicotine, or cannabis and control subjects. We had a second group of cocaine users perform the same task after an injection of saline (the intravenous saline condition) and after an injection of cocaine (the intravenous cocaine condition). An event-related task was chosen as a particularly appropriate test for assessing hemodynamic differences. Two types of analyses were performed on the functional data, both to ensure the robustness of any findings and, given that different researchers employ different analytic techniques, to show that the results are unbiased to the technique used. The first technique determines an impulse response function for each voxel using a deconvolution procedure. A separate hemodynamic shape is then fitted to each voxel’s impulse response function, and an activation measure is obtained from this shape. One advantage of this method is that the impulse response function can be described quantitatively, both voxelwise and subjectwise. This method should be particularly valuable if the different groups have differing hemodynamic responses. The second technique uses the standard statistical parametric mapping hemodynamic shape convolved with the event stimulus stream as a regressor in a multiple regression procedure. z-Score activation maps are found for each subject based on the scaling factor of this regressor.
Method
Participants and Task Design
The study included two parts. In the first part, 76 participants (30 female; mean age=29 years, range=19–46), all right-handed, completed the experiment. The participants constituted four groups: 25 control subjects (14 female; mean age=25 years, range=19–36), 18 cocaine users (five female; mean age=38 years, range=22–45), 13 nicotine users (six female; mean age=34 years, range=22–46), and 20 cannabis users (five female; mean age=23 years, range=19–45). The cocaine group had been using cocaine for an average of 12.5 years and spent, on average, $350 a week on cocaine. The nicotine group had been smoking, on average, for 18 years and smoked a mean of 23 cigarettes a day; their average score on the Fagerstrom Tolerance Questionnaire (32) was 5.3. The cannabis group had been using the drug for an average of 6.5 years and did so on average 6 days a week. Some subjects in the cocaine and cannabis groups also smoked tobacco. Nine members of the cocaine group smoked cigarettes (average nicotine use=9 years; six cigarettes a day), and eight of the cannabis group smoked (average nicotine use=5 years; 7.5 cigarettes a day). Nicotine use in the nicotine group was significantly greater than in the cocaine and cannabis groups, both in years of use and in number of cigarettes a day.
Control subjects were naive to all drugs. The cocaine and cannabis users were abstinent from their drug of use for 24 hours prior to testing. Nicotine users had been permitted to smoke within hours of beginning the task, so concerns about acute withdrawal in this group were avoided. After subjects had been given a complete description of the study, written informed consent was obtained.
The event-related finger-tapping task used a black and white checkerboard flashing at 4 Hz for 1 second. This stimulus was presented 30 times over 6 minutes with interstimulus intervals of 8–16 seconds. A countdown clock was used to prepare participants for each checkerboard presentation. While the checkerboard appeared, the participants were required to finger-tap bilaterally for the duration of the stimulus. To minimize contamination of results due to performance differences (i.e., lower activation measures due to slower finger tapping), participants were asked to finger-tap as quickly as possible.
In the second part of the study, another 13 cocaine users (two female; mean age=37 years, range=21–45) completed the same experiment after an injection of saline and after an injection of cocaine. This group had been using cocaine for an average of 12 years and spent, on average, $220 a week on cocaine. Eleven subjects in this group smoked cigarettes (average nicotine use=15 years; nine cigarettes a day). Written informed consent was also obtained from this group. The finger-tapping task was run in conjunction with a Go/No-Go task (J. Kaufman and H. Garavan, unpublished 2004 data). The cocaine users participated in two scan sessions approximately 3 hours apart during the same day. In one session, saline was infused twice, and in the other, cocaine was infused twice; the order of infusions was counterbalanced across subjects. In each session, subjects completed the finger-tapping task twice, but we limited the analysis to the first performance of the task for comparability with the data from the other groups, in which the task was performed only once. Injections with either cocaine (at 40 mg per 70 kg of body weight) or normal saline were delivered manually through a catheter port over 120 seconds. The finger-tapping task was performed approximately 4.5 minutes after the infusion.
Scanning Parameters
Scanning was conducted on 7 mm contiguous sagittal slices covering the entire brain from a 1.5T GE Signa scanner using a blipped gradient-echo, echo-planar pulse sequence (TE=40 msec; TR=2000 msec; field of view=24 cm; 64×64 matrix; 3.75×3.75 mm in-plane resolution). High-resolution anatomic images were acquired prior to functional imaging by using spoiled gradient-recall acquisition in the steady state protocol (TR=24 msec, TE=5 msec, flip angle=45 degrees, field of view=24 cm, thickness=1.0 mm with no gap, matrix size=256×256×124).
Image Analysis
The AFNI software package (33) (http://afni.nimh.nih.gov/afni) was used for all data processing. Initially, each voxel’s time series was shifted so that the separate slices acquired at different times were aligned to the same temporal origin. Each three-dimensional image corresponding to a particular time point was then volume registered to a base image using a Fourier interpolation algorithm to align the voxels. Voxels lying outside the brain were then removed.
The estimation of the impulse response function for each voxel was performed using a deconvolution technique. This technique uses a multiple regression analysis to estimate the signal contributed by the events to the overall time series. A regressor indicating the positions of the finger-tapping events along with motion regressors derived from the volume registration were included. The deconvolution model includes both intercept and slope parameters, which can be used to calculate a baseline for the impulse response function. The best-fitting hemodynamic shape (a gamma-variate function, y=k×t r ×e –t/b ) was determined for each voxel’s finger-tapping impulse response function using a nonlinear regression algorithm (34) . The estimated hemodynamic shape for each voxel was converted into a percentage-area-under-the-curve score by expressing the area under the hemodynamic curve as a percentage of the area under the baseline.
Another analysis emulated that used in statistical parametric mapping (in the SPM2 software package; http://www.fil.ion.ucl.ac.uk/spm/spm2.html). Two regressors, one obtained by convolving the event stimulus train with the packaged SPM2 hemodynamic response function and the other with its time derivative, were used in the regression procedure (the inclusion of the time derivative in the multiple regression analysis should accommodate for differences in temporal delay between voxels [35] ). The scaling factor for the first regressor was converted into a z-score map for each participant.
The percentage-area-under-the-curve score and z-score maps were then resampled at a higher resolution (1 μl) and converted to the standard stereotaxic coordinate system of Talairach and Tournoux (36) . The images were then spatially smoothed using a Gaussian kernel with 3 mm RMS isotropic deviation.
To create regions of interest for in-depth between-group comparisons, independent sample t tests against the null hypothesis of no effect (zero activation) were performed on a voxelwise basis using the percentage-area-under-the-curve score activation maps. To negate any bias in combining these maps due to uneven numbers of participants in each group, 50 t test maps were made by randomly selecting 13 activation maps from each of the four groups (13 being the minimum number of participants in any group) and t testing each collection of 52 subjects. These t test maps were then thresholded at a strict p value of 0.000001 with a 100 μl cluster criterion and combined by ANDing the maps together (i.e., using the logical AND function, a voxel was deemed to show a significant effect only if it showed a significant effect in all 50 t test maps after thresholding). A similar procedure was followed using the z-score activation maps.
The mean activations, for both the percentage-area-under-the-curve-score maps and the z-score maps, were calculated in each region of interest for each participant. The mean percentage-area-under-the-curve scores were inserted into an ANOVA to check for differences between each of the four groups for each region of interest. The difference was considered significant if it passed the standard threshold p value of 0.05 (to enable the detection of any differences between the groups, no corrections for multiple comparisons were made). A similar procedure was applied to the mean z-score values. Paired-sample t tests were performed for each region of interest on the percentage-area-under-the-curve scores and the z scores comparing the intravenous cocaine and intravenous saline conditions in the cocaine group.
A more in-depth analysis was performed to test for differences in the shape of the impulse response functions for each group. The average impulse response function shape in each region of interest was calculated and subjected to the nonlinear fitting procedure for each participant. This process yielded descriptive values for each participant’s hemodynamic responses, such as the time to depart from baseline (t 0 ), the variables r and b in the gamma-variate equation y=k¥t r ¥e –t/b , the time to peak (T max ), and the standard deviation between the fitted model and the impulse response function (σ res ). Similarly, the four groups were compared on each parameter for each region of interest with one-way ANOVAs. Paired-sample t tests were also performed for cocaine users between the intravenous cocaine and intravenous saline conditions.
Results
Four areas were identified in the percentage-area-under-the-curve score AND map ( Figure 1 ): the left precentral gyrus (x=–31, y=–21, z=49, volume=710 μl), the left medial frontal gyrus (x=–1, y=–1, z=54, volume=382 μl), the right precentral gyrus (x=38, y=–15, z=50, volume=320 μl), and the left cingulate gyrus (x=–4, y=–1, z=46, volume=182 μl). The z-score AND map found similar clusters in the left and right precentral gyri but failed to detect both of the midline clusters (this was true even when the scaling factors of both the event regressor and its temporal derivative were included in the activation measure).

a Also displayed are the averaged fitted hemodynamic shapes for each group (control subjects, cocaine, nicotine, and cannabis users, and cocaine users given intravenous saline and intravenous cocaine) in each area. These shapes are averaged across voxels in each area and then across subjects in each group.
No significant differences in percentage-area-under-the-curve score and z-score measures were found in any of the region-of-interest areas when testing between the four groups in the first part of the study (i.e., control subjects, cocaine users, nicotine users, and cannabis users). Similarly, no differences in percentage-area-under-the-curve score and z score were found between the intravenous saline and intravenous cocaine activation maps in each of the region-of-interest areas ( Table 1 ).
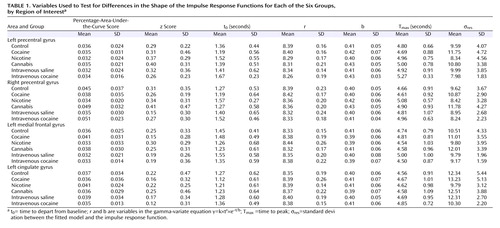
The in-depth analysis of the shape of the impulse response functions revealed no significant differences in any region of interest when comparing the four groups on each of the parameters t 0 , r, b, T max , and σ res . Similarly, no significant differences were found between the intravenous saline and intravenous cocaine activation maps on any of the parameters.
Discussion
The lack of significant differences between the groups in percentage-area-under-the-curve score and z-score activation measures would suggest that the BOLD signal intensity is not compromised in drug users and might be indicative of intact vascular-neuronal coupling in these groups. Similarly, no significant differences between the intravenous saline and intravenous cocaine conditions were found. This result is particularly interesting since it is known that cocaine causes vasoconstriction. The results of the in-depth analysis reveal that despite the existing literature suggesting drug-related alterations in the properties of blood vessels, the hemodynamic shape is not significantly changed. Thus, the results of analytic techniques that depend on hemodynamic shape may not be distorted when investigating groups of subjects who abuse drugs. The fact that no differences were found with the z-score analysis suggests that the standardized hemodynamic shape that it uses is sufficiently sensitive to yield reliable results even when cocaine has been administered. Combined, these results imply either that these drugs of abuse have no impact on the vascular processes that underlie the BOLD signal or that they affect the tonic baseline but not the dynamic task-induced, event-related BOLD changes (4) .
There were differences between the final activation maps of the percentage-area-under-the-curve score and z-score analyses. One possible reason for this discrepancy is that the standard hemodynamic shape used in the z-score analysis was different from the actual hemodynamic response measured in the midline areas. In the majority of the groups, the measured impulse response function was noisier in these areas (σ res ) ( Table 1 ), and hence it is possible that the regressor used in the analysis did not correlate as well with the shape of the time series in those voxels and thus did not identify those voxels as significantly active (these areas do appear at a lower statistical threshold in the z-score analysis). However, the more robust percentage-area-under-the-curve score analysis that can accommodate voxelwise differences in hemodynamic shape (by being capable of fitting a different gamma-variate function to each voxel) was able to detect activations in these areas. For this reason, the regions of interest for the analyses were taken from the percentage-area-under-the-curve score AND map.
A possible confounding factor in this study is age, since both the cocaine and nicotine groups differed significantly from the control group on this measure (t=6.94, df=41, p<0.0001, and t=3.44, df=36, p<0.001, respectively). It has been shown that some BOLD fMRI hemodynamic properties change with normal aging (37 , 38) . To verify whether this situation biased the results, the groups were aggregated into one and age was correlated with all experimental measures (i.e., percentage-area-under-the-curve score, z score, t 0 , r, b, T max and σ res ). No significant correlations were found, which suggests that age-related differences in the BOLD response between the groups were negligible. Furthermore, if age had an effect on nonneuronally driven vasculature, then we would expect to observe group differences, which we did not. Gender was another possible confounding factor, since the groups were not perfectly balanced on this demographic factor. Male and female differences were investigated by using independent-samples t tests on all experimental measures after collapsing across all groups. Again, no significant differences were discovered. Furthermore, multiple regression analyses with age, gender, and group as independent variables revealed no significant prediction of any of the experimental measures.
Although the sample sizes in this study were reasonably large, one might propose that the failure to find group differences was due to a lack of statistical power. It has been shown, however, that a group of 20 participants will yield stable activation maps and that the activation measures of smaller samples correlate well with those of larger groups with higher statistical power (39) . Three recent studies in our laboratory, with group sizes of 13, 13, and 15, respectively, used the percentage-area-under-the-curve score technique to detect differences between a cocaine-user group and a control group in areas associated with executive functions (40 , 41 ; J. Kaufman and H. Garavan, unpublished 2004 data). Using this technique, we also detected age-related activation differences with groups of 10 or fewer subjects (42) . This suggests that the null result of this study is not due to a lack of statistical power. To demonstrate this further, the drug users were aggregated into a single group, and analyses comparing control subjects with all drug users were repeated. Again, no significant differences were found, thus strengthening the claim that no group differences exist in hemodynamic properties.
Although the results of this study rely on accepting the null hypothesis of no differences, it is clear from Figure 1 that robust hemodynamic responses were present in each group. The in-depth analyses show that these hemodynamic responses are not altered by the users’ drug of choice, and in the case of cocaine, they did not differ even after an acute administration of the drug. This evidence demonstrates that it is possible to compare drug groups and control groups on an equal basis, using the analytic techniques described, without the need for post hoc corrections due to drug-related vascular changes. Thus, neuroimaging studies that identify activation differences between control groups and drug-abusing groups may conclude with greater confidence that the observed differences reflect true neuronal differences.
1. Luo F, Wu G, Li Z, Li SJ: Characterization of effects of mean arterial blood pressure induced by cocaine and cocaine methiodide on BOLD signals in rat brain. Magn Reson Med 2003; 49:264–270Google Scholar
2. Kaufman MJ, Levin JM, Maas LC, Rose SL, Lukas SE, Mendelson JH, Cohen BM, Renshaw PF: Cocaine decreases relative cerebral blood volume in humans: a dynamic susceptibility contrast magnetic resonance imaging study. Psychopharmacology (Berl) 1998; 138:76–81Google Scholar
3. Kaufman MJ, Levin JM, Ross MH, Lange N, Rose SL, Kukes TJ, Mendelson JH, Lukas SE, Cohen BM, Renshaw PF: Cocaine-induced cerebral vasoconstriction detected in humans with magnetic resonance angiography. JAMA 1998; 279:376–380Google Scholar
4. Gollub RL, Breiter HC, Kantor H, Kennedy D, Gastfriend D, Mathew RT, Makris N, Guimaraes A, Riorden J, Campbell T, Foley M, Hyman SE, Rosen B, Weisskoff R: Cocaine decreases cortical cerebral blood flow but does not obscure regional activation in functional magnetic resonance imaging in human subjects. J Cereb Blood Flow Metab 1998; 18:724–734Google Scholar
5. Buxton RB, Wong EC, Frank LR: Dynamics of blood flow and oxygenation changes during brain activation: the balloon model. Magn Reson Med 1998; 39:855–864Google Scholar
6. Lee JH, Telang FW, Springer CS Jr, Volkow ND: Abnormal brain activation to visual stimulation in cocaine abusers. Life Sci 2003; 73:1953–1961Google Scholar
7. Breiter HC, Gollub RL, Weisskoff RM, Kennedy DN, Makris N, Berke JD, Goodman JM, Kantor HL, Gastfriend DR, Riorden JP, Mathew RT, Rosen BR, Hyman SE: Acute effects of cocaine on human brain activity and emotion. Neuron 1997; 19:591–611Google Scholar
8. Ernst M, Matochik JA, Heishman SJ, Van Horn JD, Jons PH, Henningfield JE, London ED: Effect of nicotine on brain activation during performance of a working memory task. Proc Natl Acad Sci USA 2001; 98:4728–4733Google Scholar
9. Lawrence NS, Ross TJ, Stein EA: Cognitive mechanisms of nicotine on visual attention. Neuron 2002; 36:539–548Google Scholar
10. Kumari V, Gray JA, ffytche DH, Mitterschiffthaler MT, Das M, Zachariah E, Vythelingum GN, Williams SC, Simmons A, Sharma T: Cognitive effects of nicotine in humans: an fMRI study. Neuroimage 2003; 19:1002–1013Google Scholar
11. Domino EF, Minoshima S, Guthrie S, Ohl L, Ni L, Koeppe RA, Zubieta JK: Nicotine effects on regional cerebral blood flow in awake, resting tobacco smokers. Synapse 2000; 38:313–321Google Scholar
12. Grunwald F, Schrock H, Kuschinsky W: The influence of nicotine on local cerebral blood flow in rats. Neurosci Lett 1991; 124:108–110Google Scholar
13. Zubieta J, Lombardi U, Minoshima S, Guthrie S, Ni L, Ohl LE, Koeppe RA, Domino EF: Regional cerebral blood flow effects of nicotine in overnight abstinent smokers. Biol Psychiatry 2001; 49:906–913Google Scholar
14. Ghatan PH, Ingvar M, Eriksson L, Stone-Elander S, Serrander M, Ekberg K, Wahren J: Cerebral effects of nicotine during cognition in smokers and non-smokers. Psychopharmacology (Berl) 1998; 136:179–189Google Scholar
15. Terborg C, Birkner T, Schack B, Witte OW: Acute effects of cigarette smoking on cerebral oxygenation and hemodynamics: a combined study with near-infrared spectroscopy and transcranial Doppler sonography. J Neurol Sci 2002; 205:71–75Google Scholar
16. Iida M, Iida H, Dohi S, Takenaka M, Fujiwara H: Mechanisms underlying cerebrovascular effects of cigarette smoking in rats in vivo. Stroke 1998; 29:1656–1665Google Scholar
17. Mathew RJ, Wilson WH: Substance abuse and cerebral blood flow. Am J Psychiatry 1991; 148:292–305Google Scholar
18. Jacobsen LK, Gore JC, Skudlarski P, Lacadie CM, Jatlow P, Krystal JH: Impact of intravenous nicotine on BOLD signal response to photic stimulation. Magn Reson Imaging 2002; 20:141–145Google Scholar
19. Dewey WL: Cannabinoid pharmacology. Pharmacol Rev 1986; 38:151–178Google Scholar
20. Hollister LE: Health aspects of cannabis. Pharmacol Rev 1986; 38:1–20Google Scholar
21. Mendelson JH: Marijuana, in Psychopharmacology: The Third Generation of Progress. Edited by Meltzer HY. New York, Raven Press, 1987, pp 1565–1571Google Scholar
22. Randall MD, Harris D, Kendall DA, Ralevic V: Cardiovascular effects of cannabinoids. Pharmacol Ther 2002; 95:191–202Google Scholar
23. Lemberger L, McMahon R, Archer R, Matsumoto K, Rowe H: Pharmacologic effects and physiologic disposition of delta 6a,10a dimethyl heptyl tetrahydrocannabinol (DMHP) in man. Clin Pharmacol Ther 1974; 15:380–386Google Scholar
24. Benowitz NL, Jones RT: Cardiovascular and metabolic considerations in prolonged cannabinoid administration in man. J Clin Pharmacol 1981; 21(8-9 suppl):214S–223SGoogle Scholar
25. Lex BW, Mendelson JH, Bavli S, Harvey K, Mello NK: Effects of acute marijuana smoking on pulse rate and mood states in women. Psychopharmacology (Berl) 1984; 84:178–187Google Scholar
26. Heishman SJ, Huestis MA, Henningfield JE, Cone EJ: Acute and residual effects of marijuana: profiles of plasma THC levels, physiological, subjective, and performance measures. Pharmacol Biochem Behav 1990; 37:561–565Google Scholar
27. Bloom AS, Tershner S, Fuller SA, Stein EA: Cannabinoid-induced alterations in regional cerebral blood flow in the rat. Pharmacol Biochem Behav 1997; 57:625–631Google Scholar
28. Mathew RJ, Wilson WH, Coleman RE, Turkington TG, DeGrado TR: Marijuana intoxication and brain activation in marijuana smokers. Life Sci 1997; 60:2075–2089Google Scholar
29. Mathew RJ, Wilson WH, Humphreys DF, Lowe JV, Wiethe KE: Regional cerebral blood flow after marijuana smoking. J Cereb Blood Flow Metab 1992; 12:750–758Google Scholar
30. Liu J, Gao B, Mirshahi F, Sanyal AJ, Khanolkar AD, Makriyannis A, Kunos G: Functional CB1 cannabinoid receptors in human vascular endothelial cells. Biochem J 2000; 346(part 3):835–840Google Scholar
31. Mathew RJ, Wilson WH, Turkington TG, Coleman RE: Cerebellar activity and disturbed time sense after THC. Brain Res 1998; 797:183–189Google Scholar
32. Fagerstrom KO: Measuring degree of physical dependence to tobacco smoking with reference to individualization of treatment. Addict Behav 1978; 3:235–241Google Scholar
33. Cox R: AFNI: Software for analysis and visualization of functional magnetic resonance neuroimages. Comput Biomed Res 1996; 29:162–173Google Scholar
34. Ward B, Garavan H, Ross TJ, Bloom A, Cox R, Stein EA: Nonlinear regression for fMRI time series analysis. Neuroimage 1998; 7:S767Google Scholar
35. Friston KJ, Fletcher P, Josephs O, Holmes A, Rugg MD, Turner R: Event-related fMRI: characterizing differential responses. Neuroimage 1998; 7:30–40Google Scholar
36. Talairach J, Tournoux P: Co-Planar Stereotaxic Atlas of the Human Brain: Three-Dimensional Proportional System. New York, Thieme Medical, 1988Google Scholar
37. Huettel SA, Singerman JD, McCarthy G: The effects of aging upon the hemodynamic response measured by functional MRI. Neuroimage 2001; 13:161–175Google Scholar
38. Richter W, Richter M: The shape of the fMRI BOLD response in children and adults changes systematically with age. Neuroimage 2003; 20:1122–1131Google Scholar
39. Murphy K, Garavan H: An empirical investigation into the number of subjects required for an event-related fMRI study. Neuroimage 2004; 22:879–885Google Scholar
40. Kaufman JN, Ross TJ, Stein EA, Garavan H: Cingulate hypoactivity in cocaine users during a GO-NOGO task as revealed by event-related functional magnetic resonance imaging. J Neurosci 2003; 23:7839–7843Google Scholar
41. Hester R, Garavan H: Executive dysfunction in cocaine addiction: evidence for discordant frontal, cingulate, and cerebellar activity. J Neurosci 2004; 24:11017–11022Google Scholar
42. Nielson KA, Langenecker SA, Garavan H: Differences in the functional neuroanatomy of inhibitory control across the adult life span. Psychol Aging 2002; 17:56–71Google Scholar