A Proton MRSI Study of Brain N -Acetylaspartate Level After 12 Weeks of Citalopram Treatment in Drug-Naive Patients With Obsessive-Compulsive Disorder
Abstract
Objective: Reductions in the level of N -acetylaspartate within subcortical structures of patients with obsessive-compulsive disorder (OCD) have been reported in several studies. However, there have been, as yet, no reports regarding N -acetylaspartate levels in the prefrontal cortex of adult drug-naive OCD patients. The authors used proton magnetic resonance spectroscopic imaging ( 1 H-MRSI) to investigate regional N -acetylaspartate level abnormalities and changes after 12 weeks of pharmacotherapy with citalopram in drug-naive OCD patients. Method: Thirteen drug-naive OCD patients and 13 age- and sex-matched healthy comparison subjects were included in this study. N -acetylaspartate levels (obtained from ratios of N -acetylaspartate with creatine, choline, and creatine plus choline) in the prefrontal cortex, parietal cortex, anterior cingulate, posterior cingulate, frontal white matter, and parietal white matter were measured by 1 H-MRSI. In OCD patients, measurements were taken before and after 12 weeks of citalopram treatment. Correlations between N -acetylaspartate concentrations in regions of interest and clinical measures were also assessed. Results: Drug-naive OCD patients exhibited significantly lower N -acetylaspartate levels in the prefrontal cortex, frontal white matter, and anterior cingulate at baseline than did comparison subjects. Significant increases in N -acetylaspartate level were detected in the prefrontal cortex and frontal white matter in OCD patients after 12 weeks of citalopram treatment. Conclusions: These data suggest that reductions in neuronal viability occur in the frontal region of OCD patients and that these reductions may be partly reversible.
Neuroimaging studies have contributed greatly to the development of contemporary neurocircuitry models of obsessive-compulsive disorder (OCD). Among these, in vivo proton magnetic resonance spectroscopic imaging ( 1 H-MRSI) is a technique that allows for the study of a number of brain chemicals without the need for exogenous tracers or exposure to ionizing radiation. It is important to note that this technique also provides valuable information regarding neuronal function. In particular, N -acetylaspartate levels may constitute a sensitive means for monitoring neuronal cellular function (1 , 2) .
Reductions in N -acetylaspartate levels within subcortical structures have been the most frequently reported findings in OCD patients (3 , 4) . Bartha et al. (3) reported that relative N -acetylaspartate levels in the left corpus striatum were significantly lower in OCD patients despite the lack of difference in caudate volumes between OCD patients and comparison subjects. Ebert et al. (4) reported a decreased N -acetylaspartate/creatine plus phosphocreatine ratio in the right striatum and anterior cingulate. Decreased N -acetylaspartate levels (obtained from the N -acetylaspartate/creatine plus choline ratio) in the medial thalamus were also reported in a study of pediatric OCD patients (5) . Little is known regarding possible cortical abnormalities in OCD patients.
We measured regional N -acetylaspartate levels in the prefrontal gray matter, parietal gray matter, anterior and posterior cingulate, frontal white matter, and parietal white matter in drug-naive adult patients with OCD. We also assessed changes in regional N -acetylaspartate levels in OCD patients after 12 weeks of pharmacotherapy with citalopram.
Method
Subjects
Thirteen patients who fulfilled DSM-IV criteria for OCD, as determined with the Structured Clinical Interview for DSM-IV Axis I Disorders (SCID), were recruited. Thirteen sex- and age-matched comparison subjects were recruited through newspaper and leaflet advertisements. Absence of axis I psychiatric disorders in the comparison subjects was confirmed with the Structured Clinical Interview for DSM–IV Nonpatient Version (SCID-NP). Both groups consisted of eight men and five women. The demographic characteristics of the subjects in each group are presented in Table 1 . There were no significant differences with regard to age, education, or mean IQ as estimated by the Korean version of the WAIS. All subjects were right-handed. Exclusion criteria were a history of psychosis, bipolar disorder, substance abuse or dependence, Tourette’s disorder or other tic-related conditions, significant head injury, seizure disorder, or mental retardation.
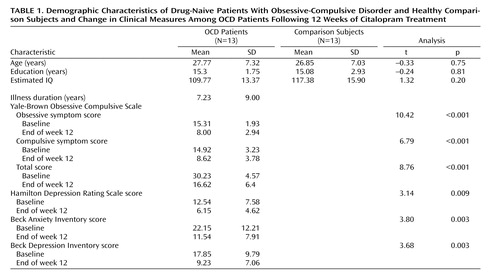
The patients had a mean duration of illness of 7.23 years (SD=9.00). Two of the OCD patients had comorbid major depressive disorder, and one patient had comorbid dysthymic disorder. Patients were drug-naive except one who had taken medication for a few days several years before the present study. None of the 13 patients had received cognitive behavior therapy or other psychotherapy before the present study. The study was approved by the local institutional review board, and written informed consent was obtained from all subjects after the procedures had been fully explained.
Clinical Assessments
OCD symptom severity was measured by using the Yale-Brown Obsessive Compulsive Scale. The Hamilton Depression Rating Scale, the Beck Depression Inventory, and the Beck Anxiety Inventory were also administered both before and after pharmacotherapy.
MR Acquisition and Processing
Three-dimensional T 1 -weighted MRI and 1 H-MRSI scans were performed on the same day at the Kangbuk Samsung Hospital; a 1.5-T MR scanner (Philips Medical Systems, Best, the Netherlands) was used. First, an axial three-dimensional T1 fast field echo sequence was used to obtain 150 1.0-mm contiguous axial images from the entire brain (overlapping slices, repetition time [TR]=25 msec, echo time [TE]=6.9 msec, flip angle=40°, acquisition matrix=256×256, field of view=240 mm×240 mm). Axial sections were acquired parallel to the anterior commissure-posterior commissure line. 1 H-MRSI data were acquired by using a point resolved selective spectroscopy (PRESS) sequence with outer volume suppression (TR=2000 msec, TE=272 msec). One slice (thickness: 20 mm) was chosen for spectroscopy in which, according to the consensus of two investigators (J.H.J., J.S.K.), the cingulate regions were most included ( Figure 1 , right). The field of view was 12 cm×12 cm for the slice; combined with 16×16 phase encoding. Voxel dimensions were 7.5 mm×7.5 mm×20 mm. The signal was digitized with 256 points and a 1000 Hz spectral width.

First, we drew regions of interest on the T 1 -weighted coaxial MR images. Boundary definitions were performed as described by Crespo-Facorro et al. (6) and Bokde et al. (7) . In order to select the regions of interest, the volumetric MRI data were segmented into gray matter, white matter, and CSF components, using a fuzzy C-means algorithm (8) . Then, we classified each voxel of MRSI data into white matter when the exact same voxel location for volumetric MRI consisted of >80% white matter, and into gray matter when the exact same voxel location for volumetric MRI consisted of >50% gray matter ( Figure 1 , left). Finally, the quantification of N -acetylaspartate, creatine, and choline were measured by the MRUI package (Leuven, Belgium) in each region of interest ( Figure 2 ). In order to ensure high-quality data, spectra were rejected if the resolution between the choline and creatine peaks was not at least 50% of the distance from the peak maximum to the apparent baseline. Levels of N -acetylaspartate were measured in terms of ratios with creatine, choline, and creatine plus choline.

Pharmacotherapy
After completion of clinical assessments and the baseline 1 H-MRSI scans, citalopram (an approved medication for OCD in Korea) treatment was started at 10 mg/day and titrated up to 60 mg/day by the 6th week, increasing by 10 mg every week. It was then maintained at 60 mg/day until the end of the 12-week pharmacotherapy regimen. Patients received no medications other than citalopram and were not engaged in cognitive behavior therapy or psychoanalytic psychotherapy. Effects and side effects were evaluated every 2 weeks. None of the patients experienced clinically significant side effects during the course of the study, and all patients completed the procedures and evaluations after the 12-week pharmacotherapy; there were no dropouts.
Statistical Analyses
Analyses of variance (ANOVAs) were performed with least significant difference post hoc tests to examine for significant differences in the N -acetylaspartate ratios between comparison subjects and OCD patients and in OCD patients before and after citalopram treatment.
Paired t tests were employed to compare pretreatment versus posttreatment scores on the Yale-Brown Obsessive Compulsive Scale, Hamilton depression scale, and Beck anxiety and depression inventories in OCD patients, while independent t tests were used to compare OCD patients and comparison subjects with regard to baseline demographic measures. A level of p<0.05 was considered to be significant.
Results
Clinical Changes
As shown in Table 1 , there were significant improvements in all clinical measures after 12 weeks of citalopram treatment. The patients experienced an average 45.37% (SD=17.59) improvement in their mean Yale-Brown Obsessive Compulsive Scale scores after pharmacotherapy.
Between-Group Differences in Regional N -Acetylaspartate Levels
Post hoc tests revealed that among gray matter voxels of interest in the prefrontal cortex and anterior cingulate, the OCD patients and the comparison subjects differed significantly in terms of the N -acetylaspartate/creatine ratio (prefrontal cortex: 3.04 [SD=0.49] versus 3.53 [SD=0.48], respectively, p=0.01; anterior cingulate: 2.69 [SD=0.57] versus 3.12 [SD=0.43], p<0.05), and also differed significantly in terms of the N -acetylaspartate/creatine plus choline ratio (prefrontal cortex: 2.43 [SD=0.33] versus 2.72 [SD=0.27], p=0.02; anterior cingulate: 2.09 [SD=0.37] versus 2.38 [SD=0.29], p<0.05). In the frontal white matter, significantly lower N -acetylaspartate/creatine and N -acetylaspartate/creatine plus choline ratios were seen in OCD patients (3.60 [SD=0.51] and 2.70 [SD=0.29], respectively) relative to comparison subjects (4.11 [SD=0.52], p=0.011; 2.98 [SD=0.24], p=0.006) ( Figure 3 ). No significant differences were detected in terms of the N -acetylaspartate/creatine or N -acetylaspartate/creatine plus choline ratios in the parietal cortex, parietal white matter, and posterior cingulate between the OCD patients and the comparison subjects. With regard to the N -acetylaspartate/choline ratios, no significant differences were detected between the two groups. No significant correlation was determined to exist between the N -acetylaspartate ratios and clinical measures (duration of illness; age at onset; total, obsessive symptom, or compulsive symptom scores from the Yale-Brown Obsessive Compulsive Scale; Hamilton depression scale score; or Beck anxiety or depressive inventory scores).

a Significant difference between patients with obsessive-compulsive disorder and comparison subjects (p<0.05, ANOVA with least significant difference post hoc test).
b Significant difference between pretreatment and posttreatment in patients with obsessive-compulsive disorder (p<0.05, ANOVA with least significant difference post hoc test).
N -Acetylaspartate Level Changes Posttreatment
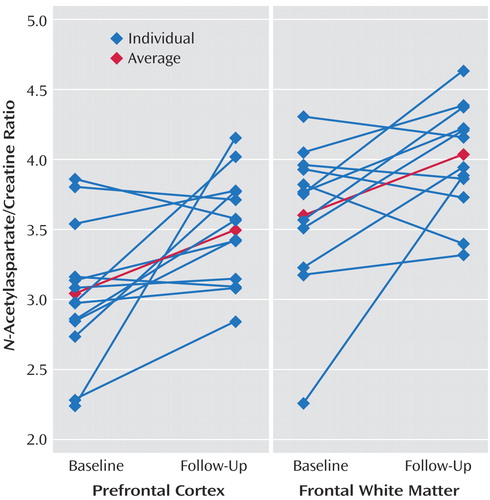
After 12 weeks of citalopram treatment, significant N -acetylaspartate ratio increases were detected in the prefrontal cortex ( N -acetylaspartate/creatine ratio: baseline=3.04 [SD=0.49], follow-up=3.51 [SD=0.39], p<0.02; N -acetylaspartate/creatine plus choline ratio: baseline=2.43 [SD=0.33], follow-up=2.69 [SD=0.29], p<0.04), and also were detected in frontal white matter ( N -acetylaspartate/creatine ratio: baseline=3.60 [SD=0.51], follow-up=4.04 [SD=0.40], p<0.03; N -acetylaspartate/creatine plus choline ratio: baseline=2.70 [SD=0.29], follow-up=2.91 [SD=0.21], p<0.04). N -acetylaspartate ratio increases were also detected in the anterior cingulate that were significant ( N -acetylaspartate/creatine plus choline ratio: baseline=2.09 [SD=0.37], follow-up=2.39 [SD=0.41], p<0.04) or approached significance ( N -acetylaspartate/creatine ratio: baseline=2.69 [SD=0.57], follow-up=3.11 [SD=0.59], p=0.051). No significant N -acetylaspartate ratio changes were observed in the posterior cingulate, parietal cortex, or parietal white matter ( Figure 3 ). Individual N -acetylaspartate/creatine ratio changes in the prefrontal cortex and frontal white matter are presented in Figure 4 ; the average percentage changes in the prefrontal cortex and frontal white matter were 18.51% and 14.51%, respectively.
The percentage changes in regional brain N -acetylaspartate ratios from baseline to follow-up were compared with the percentage changes in the clinical measures. No significant correlations were found.
Discussion
To our knowledge, this is the first 1 H-MRS study demonstrating abnormalities in N -acetylaspartate levels in adult drug-naive OCD patients and the first study to address the effects of citalopram treatment on N -acetylaspartate levels in this illness.
Decreased baseline N -acetylaspartate levels in the frontal white matter, prefrontal cortex, and anterior cingulate were selectively increased by citalopram treatment. Citalopram treatment had no effect on N -acetylaspartate levels in any of the other regions, namely, the posterior cingulate or parietal regions. Also, our findings do not appear to reflect effects of time. In six comparison subjects, we measured neurochemicals twice (a baseline measurement with follow-up 12 weeks later), and no significant differences were detected in any 1 H-MRS measures. This suggests that 1 H-MRS measures remain stable, at least during a 12-week period, and it is highly probable that the N -acetylaspartate concentration changes seen in OCD patients were attributable to pharmacotherapy.
The physiological role of N -acetylaspartate in neurons has yet to be fully elucidated. In the mature brain, N -acetylaspartate is found almost exclusively in neurons, and in the highest concentrations in the pyramidal glutamatergic neurons (9 , 10) , and N -acetylaspartate synthesis is dependent on glutamate and pyruvate or 3-hydroxybutyrate (11) . In recent studies, it has been determined that N -acetylaspartate is an intracellular osmolyte, and functions as a storage substrate for brain aspartate and acetate (12 , 13) . It has also been proposed that the N -acetylaspartate cycle functions as a neuronal mechanism for the removal of large amounts of metabolic water generated in the performance of interneuronal and intercellular signaling tasks (14) . Some 1 H-MRSI studies have also reported a positive correlation between cerebral glucose metabolic rates and N -acetylaspartate concentrations (15 , 16) . N -Acetylaspartate concentration varies with the structural and functional state of the neuronal cells and is associated with various pathologic conditions involving neurons (17 – 19) . All of these studies suggest that N -acetylaspartate concentration represents not only neuronal density, but also the metabolic status of neurons (19) .
In positron emission tomography studies conducted with OCD patients, abnormal glucose metabolism or cerebral blood flow has been reported to occur in the prefrontal area (especially, the orbitofrontal cortex), anterior cingulate, thalamus, and caudate (20 – 23) . These abnormal activities have all been demonstrated to be normalizable by pharmacotherapy (24 – 26) . The results of the present study are consistent with those of previous studies.
In contrast to the results of the current study, Rosenberg et al. (27) found no significant reductions in N -acetylaspartate level in the anterior cingulate of drug-naive pediatric OCD patients. The difference may be due to the fact that the duration of illness in their study (mean=3.87 years) was too short to cause a significant difference in N -acetylaspartate levels. In a study of adult OCD patients whose mean duration of illness was 11 years (SD=7 years) (4) , significantly lower N -acetylaspartate levels were observed in the anterior cingulate. Russell et al. (28) observed an increase in N -acetylaspartate in the left but not right dorsolateral prefrontal cortex in pediatric OCD patients (8–15 years of age) relative to comparison subjects. This result is contrary to our study. This might be due to the differences of methodology (differences of regions of interest selection, measuring ratios versus absolute concentrations, MRSI versus single voxel) or subjects. Russell et al. suggested that increased left dorsolateral prefrontal cortex N -acetylaspartate may represent neuronal hypertrophy or hyperplasia in pediatric OCD patients.
There are several limitations of this study. First, the group sizes were small. The lack of correlation between clinical measures and N -acetylaspartate levels may be due, at least in part, to the small group sizes. Second, we used the ratios of N -acetylaspartate to other neurochemicals as a form of normalization. Although this approach controls for the variances associated with assay irregularities, it is potentially less sensitive to changes affecting multiple metabolite signals. Thus, when we made a description of “changes in N -acetylaspartate levels,” we cannot exclude the possibility that the results of the current study were affected by changes in creatine or choline concentrations. Third, in the current study, the OCD patients were drug-naive at baseline period and had taken only citalopram. For this reason, it is difficult to speculate as to whether our results would be applicable to patients who are taking other medications or undergoing cognitive behavior therapy.
1. Dager SR, Steen RG: Applications of magnetic resonance spectroscopy to the investigation of neuropsychiatric disorders. Neuropsychopharmacology 1992; 6:249–266Google Scholar
2. Michaelis T, Merboldt KD, Bruhn H, Hanicke W, Frahm J: Absolute concentrations of metabolites in the adult human brain in vivo: quantification of localized proton MR spectra. Radiology 1993; 187:219–227Google Scholar
3. Bartha R, Stein MB, Williamson PC, Drost DJ, Neufeld RW, Carr TJ, Canaran G, Densmore M, Anderson G, Siddiqui AR: A short echo 1 H spectroscopy and volumetric MRI study of the corpus striatum in patients with obsessive-compulsive disorder and comparison subjects. Am J Psychiatry 1998; 155:1584–1591 Google Scholar
4. Ebert D, Speck O, Konig A, Berger M, Hennig J, Hohagen F: 1 H-magnetic resonance spectroscopy in obsessive-compulsive disorder: evidence for neuronal loss in the cingulate gyrus and the right striatum. Psychiatry Res: Neuroimaging 1997; 74:173–176 Google Scholar
5. Fitzgerald KD, Moore GJ, Paulson LA, Stewart CM, Rosenberg DR: Proton spectroscopic imaging of the thalamus in treatment-naive pediatric obsessive-compulsive disorder. Biol Psychiatry 2000; 47:174–182Google Scholar
6. Crespo-Facorro B, Kim JJ, Andreasen NC, O’Leary DS, Wiser AK, Bailey JM, Harris G, Magnotta VA: Human frontal cortex: an MRI-based parcellation method. Neuroimage 1999; 10:500–519Google Scholar
7. Bokde AL, Teipel SJ, Zebuhr Y, Leinsinger G, Gootjes L, Schwarz R, Buerger K, Scheltens P, Moeller HJ, Hampel H: A new rapid landmark-based regional MRI segmentation method of the brain. J Neurol Sci 2002; 194:35–40Google Scholar
8. Yoon U, Lee JM, Kim JJ, Lee SM, Kim IY, Kwon JS, Kim SI: Modified magnetic resonance image based parcellation method for cerebral cortex using successive fuzzy clustering and boundary detection. Ann Biomed Eng 2003; 31:441–447Google Scholar
9. Birken DL, Oldendorf WH: N-acetyl-L-aspartic acid: a literature review of a compound prominent in 1 H-NMR spectroscopic studies of brain. Neurosci Biobehav Rev 1989; 13:23–31 Google Scholar
10. Jung RE, Yeo RA, Chiulli SJ, Sibbitt WL, Jr, Weers DC, Hart BL, Brooks WM: Biochemical markers of cognition: a proton MR spectroscopy study of normal human brain. Neuroreport 1999; 10:3327–3331Google Scholar
11. Clark JB: N-acetyl aspartate: a marker for neuronal loss or mitochondrial dysfunction. Dev Neurosci 1998; 20(4–5):271–276Google Scholar
12. Baslow MH: Brain N-acetylaspartate as a molecular water pump and its role in the etiology of Canavan disease: a mechanistic explanation. J Mol Neurosci 2003; 21:185–190Google Scholar
13. Baslow MH: N-acetylaspartate in the vertebrate brain: metabolism and function. Neurochem Res 2003; 28:941–953Google Scholar
14. Baslow MH: Evidence supporting a role for N-acetyl-L-aspartate as a molecular water pump in myelinated neurons in the central nervous system: an analytical review. Neurochem Int 2002; 40:295–300Google Scholar
15. Zhu XH, Chen W: Observed bold effects on cerebral metabolite resonances in human visual cortex during visual stimulation: a functional (1)H MRS study at 4 T. Magn Reson Med 2001; 46:841–847Google Scholar
16. O’Neill J, Eberling JL, Schuff N, Jagust W, Reed B, Soto G, Ezekiel F, Klein G, Weiner MW: Method to correlate 1 H MRSI and 18 FDG-PET. Magn Reson Med 2000; 43:244–250 Google Scholar
17. Cendes F, Andermann F, Dubeau F, Matthews PM, Arnold DL: Normalization of neuronal metabolic dysfunction after surgery for temporal lobe epilepsy: evidence from proton MR spectroscopic imaging. Neurol 1997; 49:1525–1533Google Scholar
18. Hugg JW, Kuzniecky RI, Gilliam FG, Morawetz RB, Fraught RE, Hetherington HP: Normalization of contralateral metabolic function following temporal lobectomy demonstrated by 1 H magnetic resonance spectroscopic imaging. Ann Neurol 1996; 40:236–239 Google Scholar
19. Bertolino A, Callicott JH, Mattay VS, Weidenhammer KM, Rakow R, Egan MF, Weinberger DR: The effect of treatment with antipsychotic drugs on brain N-acetylaspartate measures in patients with schizophrenia. Biol Psychiatry 2001; 49:39–46Google Scholar
20. Baxter LR Jr, Phelps ME, Mazziotta JC, Guze BH, Schwartz JM, Selin CE: Local cerebral glucose metabolic rates in obsessive-compulsive disorder: a comparison with rates in unipolar depression and in normal controls. Arch Gen Psychiatry 1987; 44:211–218Google Scholar
21. Swedo SE, Schapiro MB, Grady CL, Cheslow DL, Leonard HL, Kumar A, Friedland R, Rapoport SI, Rapoport JL: Cerebral glucose metabolism in childhood-onset obsessive-compulsive disorder. Arch Gen Psychiatry 1989; 46:518–523Google Scholar
22. Sawle GV, Hymas NF, Lees AJ, Frackowiak RS: Obsessional slowness. functional studies with positron emission tomography. Brain 1991; 114(pt 5):2191–2202Google Scholar
23. Saxena S, Brody AL, Ho ML, Alborzian S, Ho MK, Maidment KM, Huang SC, Wu HM, Au SC, Baxter LR Jr: Cerebral metabolism in major depression and obsessive-compulsive disorder occurring separately and concurrently. Biol Psychiatry 2001; 50:159–170Google Scholar
24. Baxter LR Jr, Schwartz JM, Bergman KS, Szuba MP, Guze BH, Mazziotta JC, Alazraki A, Selin CE, Ferng HK, Munford P, et al: Caudate glucose metabolic rate changes with both drug and behavior therapy for obsessive-compulsive disorder. Arch Gen Psychiatry 1992; 49:681–689Google Scholar
25. Swedo SE, Pietrini P, Leonard HL, Schapiro MB, Rettew DC, Goldberger EL, Rapoport SI, Rapoport JL, Grady CL: Cerebral glucose metabolism in childhood-onset obsessive-compulsive disorder: revisualization during pharmacotherapy. Arch Gen Psychiatry 1992; 49:690–694Google Scholar
26. Perani D, Colombo C, Bressi S, Bonfanti A, Grassi F, Scarone S, Bellodi L, Smeraldi E, Fazio F: [ 18 F]FDG PET study in obsessive-compulsive disorder: a clinical/metabolic correlation study after treatment. Br J Psychiatry 1995; 166:244–250 Google Scholar
27. Rosenberg DR, Mirza Y, Russell A, Tang J, Smith JM, Banerjee SP, Bhandari R, Rose M, Ivey J, Boyd C, Moore GJ: Reduced anterior cingulate glutamatergic concentrations in childhood OCD and major depression versus healthy controls. J Am Acad Child Adolesc Psychiatry 2004; 43:1146–1153Google Scholar
28. Russell A, Cortese B, Lorch E, Ivey J, Banerjee SP, Moore GJ, Rosenberg DR: Localized functional neurochemical marker abnormalities in dorsolateral prefrontal cortex in pediatric obsessive-compulsive disorder. J Child Adolesc Psychopharmacol 2003; 13(suppl 1):S31–S38Google Scholar