Strong Evidence for a Novel Schizophrenia Risk Locus on Chromosome 1p31.1 in Homogeneous Pedigrees From Tamil Nadu, India
Abstract
Objective: The study of ethnically homogeneous populations may help to identify schizophrenia risk loci. The authors conducted a genomewide linkage scan for schizophrenia in an Indian population. Method: Participants were 441 individuals (262 affected probands and siblings) who were recruited primarily from one ethnically homogeneous group, the Tamil Brahmin caste, although individuals from other geographically proximal castes also participated. Genotyping of 124 affected sibling pair pedigrees was performed with 402 short tandem repeat polymorphisms. Linkage analyses were conducted using nonparametric exponential LOD (logarithm of the odds ratio for linkage) scores and parametric heterogeneity LOD scores. Parametric heterogeneity scores were calculated using simple dominant and recessive models, correcting for multiple statistics. The data were examined for evidence of consanguinity. Genomewide significance levels were determined using 10,000 gene dropping simulations. Results: These findings revealed genomewide significant linkage to chromosome 1p31.1, through the use of both exponential and heterogeneity LOD scores, incorporating correction for multiple statistics and mild consanguinity. The estimated sibling recurrence risk associated with this putative locus was 1.95. Analysis for heterogeneity LOD scores also detected suggestive linkage to chromosomes 13q22.1 and 16q12.2. Using 117 tag single nucleotide polymorphisms (SNPs), family-based association analyses of phosphodiesterase 4B ( PDE4B ), the closest schizophrenia candidate gene, detected no convincing evidence of association, suggesting that the chromosome 1 peak represents a novel risk locus. Conclusions: This is the first study—to the authors’ knowledge—to report significant linkage of schizophrenia to chromosome 1p31.1. Further investigation of this chromosome region in diverse populations is warranted to identify underlying sequence variants.
Schizophrenia is a severe, debilitating disorder that is characterized by delusional beliefs, hallucinations, disordered speech, and deficits in emotional and social behavior. Although the etiology of the disorder is unknown, family, twin, and adoption studies have suggested that there is a strong genetic component, with heritability estimates of approximately 0.80 (1) . Risk loci identification has been hindered by small gene effect sizes, genetic and phenotypic heterogeneity, and the involvement of indeterminate environmental factors. Despite these challenges, there are growing findings of replicated linkage and association. However, to date, no marker, allele, or haplotype has been unequivocally associated with schizophrenia.
The detection and replication of schizophrenia risk loci could be facilitated by the study of homogeneous populations (2) . We conducted a genomewide linkage analysis of ethnically homogeneous schizophrenia pedigrees from an Indian population. For thousands of years, India has been populated by diverse caste and tribal groups, with a hierarchical caste system dominating marital and cultural interactions. Strict endogamy has resulted in social stratification and barriers to gene flow between caste groups, which likely has been augmented by geographical dispersal and subdivision of the country into different linguistic regions (3) . Accordingly, studies comparing geographically distinct caste populations have consistently reported clines (gradual changes across adjacent populations) in gene frequencies across the country, especially in a north-south direction (4) .
To minimize clinal variation, we recruited participants from the southern state of Tamil Nadu. To maximize sample homogeneity, we exhaustively recruited pedigrees from a single endogamous caste: the Tamil Brahmin. We then recruited additional pedigrees from other Tamil castes. Thus, our study sample could be considered ethnically homogeneous, since population genetic analyses have shown that 1) genetic distances between different Tamil castes are small and 2) Tamil castes are distinguishable from other Indian castes as well as other continental world populations (data available upon request from Watkins et al.).
Method
Sample Description
Families with affected sibling pairs were recruited by the Schizophrenia Research Foundation, Chennai, India. Each affected sibling pair included a proband who met criteria for DSM-IV schizophrenia and at least one other sibling who met criteria for either schizophrenia or schizoaffective disorder. A diagnosis of schizoaffective disorder required the presence of mood syndromes that were >30% of the total illness duration, which is consistent with other major studies (5) . Participants were excluded if they were unable to provide informed consent or if their psychosis was secondary to substance use or a neurological disorder. The caste membership of affected sibling pairs was detailed in the Schizophrenia Research Foundation medical records. All participants gave written informed consent, and the study was approved by relevant institutional ethics committees.
Available parents and grandparents of affected sibling pairs were interviewed via the Family Interview for Genetic Studies (6) in order to verify pedigree caste membership and the unaffected status of other family members. Affected individuals were interviewed using the Diagnostic Interview for Genetic Studies (7) . The Diagnostic Interview for Genetic Studies and Family Interview for Genetic Studies were formally translated into the local Tamil language and back-translated into English by clinicians who were fluent in both languages. Interviews were conducted in the Tamil language, with all interview data translated into English and subsequent narrative reports written in English. Medical records were recorded in English. Consensus best-estimate final diagnoses (8) were assigned (in Chennai, India and Brisbane, Australia) by three research psychiatrists based on independent assessment of Diagnostic Interview for Genetic Studies results, Family Interview for Genetic Studies results, narrative reports, and available medical records. Additional data pertaining to sample ascertainment are provided in the data supplement accompanying the online version of this article
Genotyping
Genotyping was performed by the NHLBI Mammalian Genotyping Service using 402 short tandem repeat markers (Marshfield Screening Set 15, Marshfield, Wisc.). The mean intermarker interval was 9.33 cM, and the mean marker heterozygosity was 0.75 (SD=0.07), excluding X and Y chromosome markers. Seven blood samples did not amplify for >15% of the markers and were thus removed from the analysis. Consequently, the missing data rate was 1.3%. Calculated genotyping error rates were 0.46% (NHLBI Mammalian Genotyping Service) and 0.41% (eight blinded duplicate blood samples). Marker map and order were determined by an integrated genetic map, which incorporated the Rutgers genetic map (9) and NCBI Build 35.1 physical map positions (10) .
Error Checking
Familial relationships were verified using RELPAIR (11) and graphical representation of relationship errors (12) . Two affected monozygotic twin pairs and one misidentified father were detected and excluded from the study. Genotypes that were inconsistent with Mendelian inheritance were detected and zeroed using PEDMANAGER (http://www.broad.mit.edu/ftp/distribution/software/pedmanager/). Genotypes associated with apparent multiple recombination events were identified by ALLEGRO-generated haplotypes (13) and zeroed using a shell script (http://www2.qimr.edu.au/davidD/readinh).
Inbreeding Assessment
Inbreeding can inflate linkage statistics and increase type I error rates (14) . Since Tamil Brahmin marriages can include first cousin and uncle-niece unions, we calculated genomewide inbreeding coefficients (f) using FEstim (15) . We also computed mean genomewide multipoint exponential LOD scores (16) and heterogeneity LOD scores based on observed linkage statistics computed at 1-cM intervals. The expected mean value of each statistic was calculated using 10,000 data replicates simulated with no linkage. The significance of observed means was defined as the proportion of data replicates yielding an equivalent or higher value. Since linkage files did not specify parental relatedness, increased allele sharing and elevated linkage scores for data replicates were entirely a result of chance.
Linkage Analyses
Linkage analyses were performed using MERLIN (17) . Multipoint and single-point exponential LOD scores (16) were calculated using the S pairs scoring statistic (18) . We also computed heterogeneity LOD scores using dominant and recessive models (19) . Affected sibling pair-only analyses were performed by setting an artificially low penetrance (0.1%) for the disease locus, which may increase power to detect disease alleles of low penetrance (20) . Dominant and recessive models specified disease gene frequencies of 0.01 and 0.1, respectively (21) , with penetrance vectors for genotypes containing zero, one, and two disease alleles of 0.000, 0.001, 0.001 (dominant) and 0.000, 0.000, 0.001 (recessive).
Empirical Significance Levels
Genomewide significance levels of observed statistics were defined as the frequency of equivalent or higher scores for 10,000 data replicates simulated using the hypothesis of no linkage. Simulated data sets were generated and analyzed using MERLIN. Peaks separated by >40 cM were considered independent (22) . Significance levels were corrected for the observed statistics by multiplying empirical type I error rates by the effective number of independent tests. This value relates to the variance of eigenvalues derived from a correlation matrix of the three sets of genomewide linkage scores (23) .
Empirical genomewide significance and suggestive thresholds were defined as scores occurring with a 0.05 and 1.0 probability, respectively, for each genome scan (24) . Empirical point-wise thresholds with p values of 0.01 and 0.05 were defined as scores occurring with a 0.01 and 0.05 probability, respectively, at any given map position. Correction for testing the observed statistics was incorporated by dividing the number of required peaks (genomewide) or scores (point-wise) for each threshold by the number of independent tests performed.
Analyses of Population Structure
The most probable number of population clusters (k) was estimated using STRUCTURE (25) , based on the parents or grandparents of 116 independent pedigrees and 375 autosomal short tandem repeat loci. Allele frequencies were assumed to be correlated among clusters, and admixture was permitted. In addition, analysis of molecular variance (26) was conducted using 45 unlinked autosomal tetranucleotide markers for unaffected individuals from each of four Tamil Nadu castes (approximately 48 individuals per caste), representing the most common groups in the linkage sample.
Phosphodiesterase (PDE4B) Gene Association Analyses
Association analyses of the PDE4B gene were conducted for the 40 affected sibling pair pedigrees with two genotyped parents (maximally informative for association) plus 167 parent-offspring trios. For the longest PDE4B gene transcript, Haploview, version 3.32 (http://www.broad.mit.edu/personal/jcbarret/haploview/) (27) was used to select tag single nucleotide polymorphisms (SNPs) representing SNPs with a minor allele frequency >0.01, with r 2 >0.8 from HapMap Phase II SNP-genotype data (release #20). The HapMap CEU reference population was used because of high genetic similarity of Tamil caste groups with European populations (data available upon request from Watkins et al.). The Illumina GoldenGate assay was used to genotype 126 selected SNPs. Of these, 117 were polymorphic, had genotype call rates >90%, and demonstrated Hardy-Weinberg equilibrium (p>0.001) in founders (using PLINK [28] ). Association analyses were conducted using UNPHASED (http://www.mrc-bsu.cam.ac.uk/personal/frank/software/unphased) (29) .
Results
Pedigree Sample
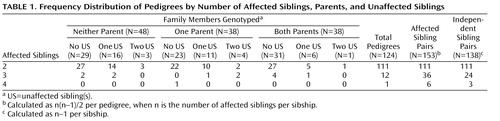
The genotyped sample included 441 individuals (262 affected probands and siblings) organized into 124 pedigrees. The distribution of pedigrees by the number of affected siblings, available parents, and unaffected siblings is detailed in Table 1 . Ninety-seven pedigrees (approximately 78%) were of Tamil Brahmin descent. The remaining 27 pedigrees were from other Tamil Nadu castes. The study sample showed remarkable clinical homogeneity, with all but one affected individual having schizophrenia ( Table 2 ). In addition, there were very low rates of comorbid drug and alcohol use.

Population Structure
Population structure analyses using STRUCTURE supported the presence of a single population cluster (k=1). Moreover, analysis of molecular variance using four castes showed that 99.3% of genetic variation occurred within castes and only 0.7% occurred between castes (data available upon request from Watkins et al.). These modest genetic differences justified the combination of Tamil Brahmin and non-Tamil Brahmin castes for linkage analysis.
Inbreeding Assessment
Inbreeding coefficients (f) were calculated using FEstim. The majority of affected siblings (approximately 68%) showed no evidence of inbreeding (f=0), and 86% had inbreeding coefficient estimates <0.05. However, 13 pedigrees had a mean inbreeding coefficient estimate >0.05 among affected sibling pairs, which may have increased type I error rates among affected sibling pair tests (30) . The highest observed inbreeding coefficient estimate was 0.159.
To investigate the potential inflation of linkage statistics by inbreeding, we computed mean genomewide exponential LOD scores and dominant and recessive heterogeneity LOD scores and then compared these mean scores with empirically derived expected values. The observed and expected mean exponential LOD scores were 0.194 and 0.004 (p=0.01), respectively, suggesting potential inflation via inbreeding by approximately 0.19 LOD units. Observed and expected mean heterogeneity LOD scores were 0.244 and 0.110 (dominant: p=0.02), respectively, and 0.201 and 0.106 (recessive: p=0.03), respectively, suggesting potential inflation of linkage statistics via inbreeding by approximately 0.134 (dominant) and 0.095 (recessive) heterogeneity LOD units. Increased identity-by-descent sharing and linkage evidence may result from either inbreeding or linkage. However, because modest inbreeding was suggested by both clinical data and inbreeding coefficient estimates, we corrected observed linkage statistics by subtracting their degree of apparent inflation at all map locations. All reported multipoint statistics were corrected using this method (unless otherwise stated).
Significance Thresholds
Based on genomewide correlations between exponential LOD scores (negative scores zeroed) and heterogeneity LOD (dominant and recessive models) scores and the use of the method described by Cheverud (23) , the effective number of independent test statistics was 2.1. Incorporating 2.1 effectively independent tests, empirical genomewide “significant” and “suggestive” thresholds for exponential LOD scores were 3.23 and 1.92, respectively, and thresholds for nominal p values of 0.01 and 0.05 were 1.46 and 0.85, respectively. For heterogeneity LOD dominant and recessive scores, genomewide “significant” and “suggestive” thresholds were 3.26 and 1.92, respectively, and thresholds for nominal p values of 0.01 and 0.05 were 1.45 and 0.85, respectively.
Linkage Analyses
Genomewide multipoint results for all linkage statistics are detailed in the data supplement accompanying the online version of this article.
Allele-Sharing LOD Score Analysis
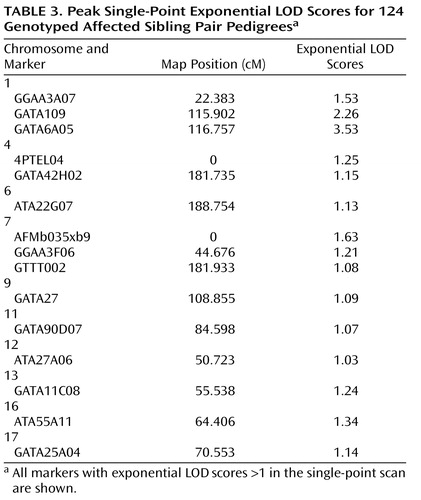
All single-point exponential LOD scores are shown in Figure 1 . The highest observed scores were for two adjacent markers on chromosome 1p31.1: marker GATA109 (exponential LOD score=2.26) and marker GATA6A05 (exponential LOD score=3.53). Markers achieving single-point exponential LOD scores >1 are detailed in Table 3 .
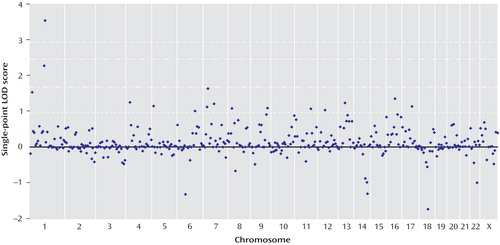
a Single-point exponential LOD scores (16) were calculated using the S pairs scoring statistic (18). Thresholds estimated using asymptotic theory for nominal p values of 0.01 (dashed line just under LOD score of 1), 0.001 (dash-dot-dot line), 0.0001 (dash-dot-dash line), and 0.00002 (dashed line just under LOD score of 3) are shown. Thresholds incorporated reduction by 20%, as suggested by Lander and Kruglyak (24), for a single-point scan with a 10-cM mean resolution.
Genomewide multipoint exponential LOD scores are shown in Figure 2 . Multipoint exponential LOD scores were largely consistent with findings for single-point scores. The highest multipoint exponential LOD score was obtained on chromosome 1p31.1, located 117 cM from the p-telomere (corrected exponential LOD score=3.91). This result easily surpassed the threshold for genomewide significant linkage, with only 56 peaks >3.91 occurring in 10,000 simulations (corrected genomewide significance: p=0.01). Approximately 53% of pedigrees (66/124) yielded positive exponential LOD scores at the 1p31 peak. The 1-LOD drop (approximating a 95% confidence interval [CI] for the location of the peak) delimited a 9.6-cM region that ranged from 114.1–123.7 cM (79.8–89.6 Mb, NCBI Build 36.2). The sibling relative risk associated with the 1p31 peak was calculated using the following equation: λ s =0.25/Z 0 =1.95 (Z 0 indicates the mean proportion of affected sibling pairs sharing zero alleles, identity-by-descent, at the peak [31] ). This locus-specific effect size may have been inflated because of its calculation from genome scan data (32) . Both Tamil Brahmin (78% of the study sample; uncorrected peak exponential LOD score=3.6, 117 cM from the p-telomere) and non-Tamil Brahmin pedigrees (22% of the study sample; uncorrected peak exponential LOD score=0.93, 116 cM from the p-telomere) contributed proportionate linkage evidence at the 1p31 peak.
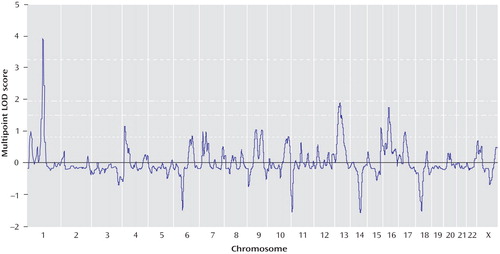
a Multipoint exponential LOD scores (16) were calculated using the S pairs scoring statistic (18) and corrected for inbreeding by subtracting 0.19 LOD units from observed scores. Empirical thresholds for genomewide significant linkage (dashed line just over LOD score of 3), genomewide suggestive linkage (dash-dot-dash line), and nominal p values of 0.01 (dash-dot-dot line) and 0.05 (dashed line just under LOD score of 1) are shown. All thresholds incorporate correction for 2.1 effectively independent tests.
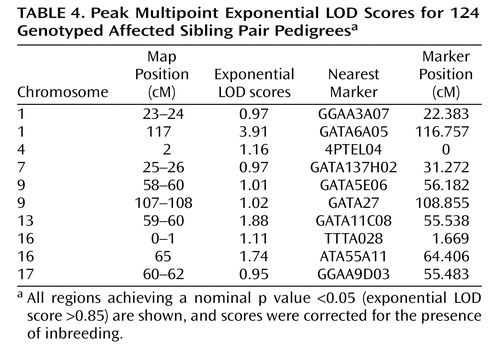
Using exponential LOD scores, the 1p31 peak was the only result to achieve either genomewide suggestive or significant linkage. In addition, three regions achieved nominal p values ≤0.01, and 10 achieved nominal p values ≤0.05 ( Table 4 ). These values did not exceed those that were expected by chance at a nominal p value <0.05. Of 10,000 simulated genomewide scans, 838 had three or more peaks that achieved nominal p values ≤0.01 (experiment-wide significance: p=0.08), and 1,587 had 10 or more peaks that achieved nominal p values ≤0.05 (experiment-wide significance: p=0.2).
Heterogeneity LOD Score Analyses
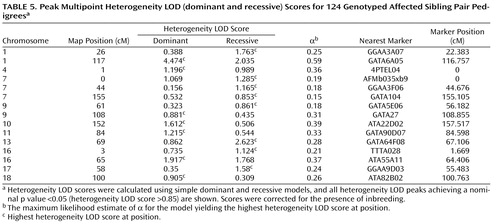
Heterogeneity LOD score analyses supported and extended the allele-sharing analysis. The peak heterogeneity LOD score was also observed on chromosome 1p31.1, 117 cM from the p-telomere. Maximal evidence was obtained using the dominant model (corrected heterogeneity LOD dominant score=4.47; corrected genomewide significance: p=0.004). The difference between heterogeneity LOD dominant and recessive scores at this position was 2.439 (heterogeneity LOD recessive score=2.034), suggesting a dominant mode of inheritance. In 10,000 simulated data sets, an absolute difference between heterogeneity LOD dominant and recessive scores >2.439 was observed for only 67 data sets (point-wise empirical significance: p=0.007), suggesting that this difference did not occur by chance. Strong support for chromosome 1p31 was also provided by single-point analyses of the two markers beneath the multipoint peak (marker GATA109, heterogeneity LOD dominant score=2.61; marker GATA6A05, heterogeneity LOD dominant score=4.49).
Using heterogeneity LOD statistics, suggestive linkage was also observed for chromosome 13q22.1, 69 cM from the p-telomere (heterogeneity LOD recessive score=2.62, corrected genomewide type I error rate=0.205), and chromosome 16q12.2, 65 cM from the p-telomere (heterogeneity LOD dominant score=1.92, corrected genomewide type I error rate=1).
Heterogeneity LOD analyses also detected linkage evidence for more regions than expected by chance across the entire heterogeneity LOD score range. The number of peaks achieving nominal p values ≤0.05, nominal p values ≤0.01, genomewide suggestive linkage, and genomewide significant linkage were 15, 6, 3, and 1, respectively. In 10,000 simulations of heterogeneity LOD dominant scores, 173 had 15 or more peaks with nominal p values ≤0.05 (experiment-wide significance: p=0.02); 152 had six or more peaks with nominal p values ≤0.01 (experiment-wide significance: p=0.02); 217 had three or more peaks achieving suggestive linkage (experiment-wide significance: p=0.02); and 222 had one or more peaks achieving significant linkage (experiment-wide significance: p=0.02). The results were almost identical using the empirical distribution of heterogeneity LOD recessive scores. These findings suggest the presence of multiple, small-effect loci in addition to the significant and suggestive regions. All multipoint heterogeneity LOD peaks achieving nominal p values ≤0.05 are detailed in Table 5 .
PDE4B Gene Association Analyses
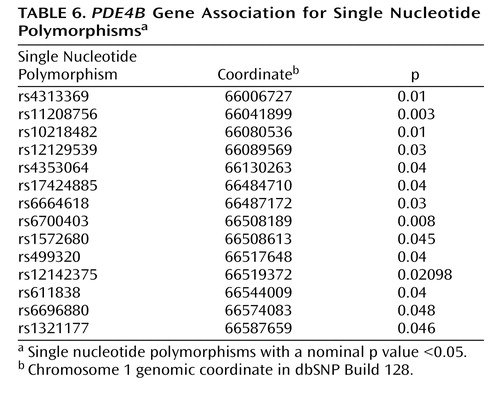
To our knowledge, there are no established schizophrenia candidate genes under the chromosome 1 peak. The nearest candidate gene is PDE4B(33 , 34) on chromosome 1p31.3, located approximately 15 Mb from our reported peak. To determine whether our reported peak reflected the association of schizophrenia with PDE4B gene variants, we conducted genetic association analyses of the PDE4B gene. This analysis included 117 SNPs spanning approximately 620 kb, which were genotyped for 207 fully informative Tamil pedigrees (40 affected sibling pairs, 167 trios). Association analysis using UNPHASED identified 14 SNPs ( Table 6 ) and several multimarker haplotypes with nominal p values ≤0.05. However, no SNP or haplotype association survived multiple testing correction. Although a previous association study demonstrated association of a PDE4B gene haplotype in women (34) , we detected no increased association evidence in families with female-only offspring.
Discussion
To our knowledge, the present study is the first to describe a genomewide linkage scan for schizophrenia in an Indian population. The primary finding was a LOD score of 3.91 on chromosome 1p31.1. This finding achieved genomewide significance using both allele-sharing LOD scores and heterogeneity LOD scores, incorporating correction for multiple testing and mild consanguinity.
Genetic distance estimates have demonstrated that Indian castes occupy a genetic position intermediate between European and East Asian populations (3 , 35) . Consistent with these findings, Caucasian and Chinese schizophrenia subjects have also demonstrated linkage to chromosome 1p31.1. In 238 Finnish schizophrenia pedigrees, Paunio et al. (36) detected a single-point LOD score of 2.68 at marker D1S1728, located approximately 1.1 cM from our reported multipoint peak. Notably, this result may be interpreted as a replication (24) of the significant linkage reported in the present study. In 557 Han Chinese schizophrenia pedigrees, Faraone et al. (37) detected a z score of 2.08 at marker D1S551, located approximately 0.3 cM from our multipoint peak. Shaw et al. (38) also detected linkage to marker D1S551 (nonparametric linkage=1.65) in 70 Caucasian pedigrees with a psychosis-spectrum phenotype. Further, the 1p31.1 region overlaps with a chromosome bin achieving the sixth best p value in a recent meta-analysis of 32 schizophrenia linkage scans (D.L. Levinson, personal communication, August 2008). These results implicate the 1p region in schizophrenia pathogenesis among multiple population groups.
A Japanese study reported significant linkage of schizophrenia to chromosome 1p21.1 (LOD score=3.39), located approximately 18 cM from our multipoint peak (39) . However, the 95% CI regions for the peak reported in the Japanese study and the peak reported in the present study are separated by >12 Mb, suggesting that they represent distinct loci. However, large variations in peak location estimates have been reported for complex diseases (40) , and it is possible that both studies detected the same locus. Clarification will require identification of the causal variants underlying each peak.
In contrast, many published studies, including three meta-analyses (41 – 43) , have not reported linkage of schizophrenia to the 1p region. It is possible that the putative risk variants underlying the peak reported in the present study have similar frequencies in different population groups but that genetic and phenotypic heterogeneity have precluded detection of these risk variants in many studies. Alternatively, these risk variants may have had a higher frequency in our study population. Further research is required to confirm the presence of one or more schizophrenia risk variants in this chromosome region and determine their significance in different populations.
Our second highest linkage peak was detected between the 13q21.31 and 13q22.1 regions. Several studies have reported linkage of schizophrenia to a 13q32-33 region, located approximately 20 cM telomeric from our 13q heterogeneity LOD peak (44 – 47) , and to regions located approximately 6 cM (38) and <1 cM (48) from our reported peak. The heterogeneity LOD peak reported in the present study also overlaps with a region that showed significant linkage evidence in a meta-analysis of 18 genomewide schizophrenia scans (42) . Given the expected variability in peak location estimates from linkage scans of complex disease (49) , these results may support previous evidence for a schizophrenia susceptibility locus on chromosome 13q. Our third highest and suggestive heterogeneity LOD peak was detected on chromosome 16q12.2. We are aware of two studies that have provided evidence for chromosome 16q (38 , 50) , although our findings are the first to report suggestive linkage to this region. Evidence for linkage to this region may be sufficient to justify further study.
In addition to our significant and suggestive findings, our heterogeneity LOD analyses detected more regions at nominal p values ≤0.01 and ≤0.05 than expected by chance. These findings are consistent with an oligogenic transmission model for schizophrenia, which produces moderately increased allele sharing at a number of loci (22) .
A unique feature of the present study sample was phenotypic homogeneity. Molecular genetic studies of schizophrenia typically combine schizophrenia and schizoaffective disorder into a core phenotype, with schizoaffective disorder subjects usually comprising approximately 10%–15% of affected subjects (5 , 51) . Although the same diagnostic criterion was applied to the present study, all affected subjects except one had schizophrenia, which is a finding consistent with several epidemiological studies also conducted in Chennai, India (52 – 54) . The phenotypic homogeneity of our study sample may have increased power to resolve schizophrenia-specific risk variants. Another favorable characteristic was the extremely low rate of comorbid alcohol and illicit drug use, which simplified diagnostic ascertainment and may have reduced an important source of gene-environment interactions influencing disease risk. The Indian families who participated in the present study may also have more uniform dietary and social customs relative to many multicultural Western societies, increasing the environmental homogeneity of the study sample.
One potential limitation to the study is the presence of consanguinity in some pedigrees, which can falsely increase linkage evidence (14) . We corrected for consanguinity by 1) computing expected and observed genomewide mean values for each statistic and 2) subtracting observed scores by the difference between the two. This approach was probably conservative, since mean scores will be inflated by consanguinity or linkage. Notably, linkage evidence for chromosome 1p31.1 remained significant (genomewide significance: p<0.05) following removal of the 13 pedigrees for whom the inbreeding coefficient among affected sibling pairs exceeded 0.05 (30) . This suggests that our corrections were adequate and consanguinity did not substantially influence our results.
To our knowledge, there are no established schizophrenia candidate genes beneath the 1p31 peak. However, the boundary of the 1-LOD drop is located approximately 13 Mb from the PDE4B gene, which has been previously implicated in schizophrenia susceptibility (33 , 34) . Our failure to detect association of PDE4B gene variants with schizophrenia suggests that PDE4B gene variants are not responsible for the 1p31 linkage peak. A possible limitation to the study is the modest power of the association sample, although power should have been enhanced by the inclusion of pedigrees linked to the region (55) . Even allowing for variation in peak location (40) , the PDE4B gene is located well outside the region implicated by the 1p31 peak. Given that the identified 1-LOD drop contains approximately 60 unique brain-expressed genes, it appears more likely that this linkage finding reflects association to a novel candidate gene.
In summary, we detected genomewide significant linkage to chromosome 1p31.1 and suggestive linkage to chromosomes 13q22.1 and 16q12.2 in an Indian population. Power of this analysis may have been enhanced by genetic, environmental, and phenotypic homogeneity, which should also benefit subsequent fine-mapping analyses. We are currently planning a comprehensive linkage disequilibrium mapping analysis of a larger sample to identify novel schizophrenia-associated risk variants.
1. Sullivan PF, Kendler KS, Neale MC: Schizophrenia as a complex trait: evidence from a meta-analysis of twin studies. Arch Gen Psychiatry 2003; 60:1187–1192Google Scholar
2. Altmuller J, Palmer LJ, Fischer G, Scherb H, Wjst M: Genomewide scans of complex human diseases: true linkage is hard to find. Am J Hum Genet 2001; 69:936–950Google Scholar
3. Watkins WS, Prasad BV, Naidu JM, Rao BB, Bhanu BA, Ramachandran B, Das PK, Gai PB, Reddy PC, Reddy PG, Sethuraman M, Bamshad MJ, Jorde LB: Diversity and divergence among the tribal populations of India. Ann Hum Genet 2005; 69(pt 6):680–692Google Scholar
4. Sahoo S, Singh A, Himabindu G, Banerjee J, Sitalaximi T, Gaikwad S, Trivedi R, Endicott P, Kivisild T, Metspalu M, Villems R, Kashyap VK: A prehistory of Indian Y chromosomes: evaluating demic diffusion scenarios. Proc Natl Acad Sci U S A 2006; 103:843–848Google Scholar
5. Suarez BK, Duan J, Sanders AR, Hinrichs AL, Jin CH, Hou C, Buccola NG, Hale N, Weilbaecher AN, Nertney DA, Olincy A, Green S, Schaffer AW, Smith CJ, Hannah DE, Rice JP, Cox NJ, Martinez M, Mowry BJ, Amin F, Silverman JM, Black DW, Byerley WF, Crowe RR, Freedman R, Cloninger CR, Levinson DF, Gejman PV: Genomewide linkage scan of 409 European-ancestry and African American families with schizophrenia: suggestive evidence of linkage at 8p23.3-p21.2 and 11p13.1-q14.1 in the combined sample. Am J Hum Genet 2006; 78:315–333Google Scholar
6. Maxwell ME: Family Interview for Genetic Studies (FIGS): A Manual for FIGS. Bethesda, Md, NIMH, 1992Google Scholar
7. Nurnberger JI Jr, Blehar MC, Kaufmann CA, York-Cooler C, Simpson SG, Harkavy-Friedman J, Severe JB, Malaspina D, Reich T: Diagnostic Interview for Genetic Studies: rationale, unique features, and training. NIMH Genetics Initiative. Arch Gen Psychiatry 1994; 51:849–859Google Scholar
8. Leckman JF, Sholomskas D, Thompson WD, Belanger A, Weissman MM: Best estimate of lifetime psychiatric diagnosis: a methodological study. Arch Gen Psychiatry 1982; 39:879–883Google Scholar
9. Kong X, Murphy K, Raj T, He C, White PS, Matise TC: A combined linkage-physical map of the human genome. Am J Hum Genet 2004; 75:1143–1148Google Scholar
10. Duffy DL: An integrated genetic map for linkage analysis. Behav Genet 2006; 36:4–6Google Scholar
11. Epstein MP, Duren WL, Boehnke M: Improved inference of relationship for pairs of individuals. Am J Hum Genet 2000; 67:1219–1231Google Scholar
12. Abecasis GR, Cherny SS, Cookson WO, Cardon LR: GRR: graphical representation of relationship errors. Bioinformatics 2001; 17:742–743Google Scholar
13. Gudbjartsson DF, Jonasson K, Frigge ML, Kong A: ALLEGRO: a new computer program for multipoint linkage analysis. Nat Genet 2000; 25:12–13Google Scholar
14. Genin E, Clerget-Darpoux F: Consanguinity and the sib-pair method: an approach using identity by descent between and within individuals. Am J Hum Genet 1996; 59:1149–1162Google Scholar
15. Leutenegger AL, Prum B, Genin E, Verny C, Lemainque A, Clerget-Darpoux F, Thompson EA: Estimation of the inbreeding coefficient through use of genomic data. Am J Hum Genet 2003; 73:516–523Google Scholar
16. Kong A, Cox NJ: Allele-sharing models: LOD scores and accurate linkage tests. Am J Hum Genet 1997; 61:1179–1188Google Scholar
17. Abecasis GR, Wigginton JE: Handling marker-marker linkage disequilibrium: pedigree analysis with clustered markers. Am J Hum Genet 2005; 77:754–767Google Scholar
18. Weeks DE, Lange K: The affected-pedigree-member method of linkage analysis. Am J Hum Genet 1988; 42:315–326Google Scholar
19. Greenberg DA, Abreu P, Hodge SE: The power to detect linkage in complex disease by means of simple LOD-score analyses. Am J Hum Genet 1998; 63:870–879Google Scholar
20. Lander ES, Schork NJ: Genetic dissection of complex traits. Science 1994; 265:2037–2048Google Scholar
21. Pal DK, Durner M, Greenberg DA: Effect of misspecification of gene frequency on the two-point LOD score. Eur J Hum Genet 2001; 9:855–859Google Scholar
22. Wiltshire S, Cardon LR, McCarthy MI: Evaluating the results of genomewide linkage scans of complex traits by locus counting. Am J Hum Genet 2002; 71:1175–1182Google Scholar
23. Cheverud JM: A simple correction for multiple comparisons in interval mapping genome scans. Heredity 2001; 87(pt 1):52–58Google Scholar
24. Lander E, Kruglyak L: Genetic dissection of complex traits: guidelines for interpreting and reporting linkage results. Nat Genet 1995; 11:241–247Google Scholar
25. Pritchard JK, Stephens M, Donnelly P: Inference of population structure using multilocus genotype data. Genetics 2000; 155:945–959Google Scholar
26. Excoffier L, Smouse PE, Quattro JM: Analysis of molecular variance inferred from metric distances among DNA haplotypes: application to human mitochondrial DNA restriction data. Genetics 1992; 131:479–491Google Scholar
27. Barrett JC, Fry B, Maller J, Daly MJ: Haploview: analysis and visualization of LD and haplotype maps. Bioinformatics 2005; 21:263–265Google Scholar
28. Purcell S, Neale B, Todd-Brown K, Thomas L, Ferreira MA, Bender D, Maller J, Sklar P, de Bakker PI, Daly MJ, Sham PC: PLINK: a tool set for whole-genome association and population-based linkage analyses. Am J Hum Genet 2007; 81:559–575Google Scholar
29. Dudbridge F: Likelihood-based association analysis for nuclear families and unrelated subjects with missing genotype data. Human Hered 2008; 66:87–98Google Scholar
30. Liu W, Weir BS: Affected sib pair tests in inbred populations. Ann Hum Genet 2004; 68(pt 6):606–619Google Scholar
31. Risch N: Linkage strategies for genetically complex traits, II: the power of affected relative pairs. Am J Hum Genet 1990; 46:229–241Google Scholar
32. Goring HH, Terwilliger JD, Blangero J: Large upward bias in estimation of locus-specific effects from genomewide scans. Am J Hum Genet 2001; 69:1357–1369Google Scholar
33. Millar JK, Pickard BS, Mackie S, James R, Christie S, Buchanan SR, Malloy MP, Chubb JE, Huston E, Baillie GS, Thomson PA, Hill EV, Brandon NJ, Rain JC, Camargo LM, Whiting PJ, Houslay MD, Blackwood DH, Muir WJ, Porteous DJ: DISC1 and PDE4B are interacting genetic factors in schizophrenia that regulate cAMP signaling. Science 2005; 310:1187–1191Google Scholar
34. Pickard BS, Thomson PA, Christoforou A, Evans KL, Morris SW, Porteous DJ, Blackwood DH, Muir WJ: The PDE4B gene confers sex-specific protection against schizophrenia. Psychiatr Genet 2007; 17:129–133Google Scholar
35. Vishwanathan H, Deepa E, Cordaux R, Stoneking M, Usha Rani MV, Majumder PP: Genetic structure and affinities among tribal populations of southern India: a study of 24 autosomal DNA markers. Ann Hum Genet 2004; 68(pt 2):128–138Google Scholar
36. Paunio T, Ekelund J, Varilo T, Parker A, Hovatta I, Turunen JA, Rinard K, Foti A, Terwilliger JD, Juvonen H, Suvisaari J, Arajarvi R, Suokas J, Partonen T, Lonnqvist J, Meyer J, Peltonen L: Genome-wide scan in a nationwide study sample of schizophrenia families in Finland reveals susceptibility loci on chromosomes 2q and 5q. Hum Mol Genet 2001; 10:3037–3048Google Scholar
37. Faraone SV, Hwu HG, Liu CM, Chen WJ, Tsuang MM, Liu SK, Shieh MH, Hwang TJ, Ou-Yang WC, Chen CY, Chen CC, Lin JJ, Chou FH, Chueh CM, Liu WM, Hall MH, Su J, Van Eerdewegh P, Tsuang MT: Genome scan of Han Chinese schizophrenia families from Taiwan: confirmation of linkage to 10q22.3. Am J Psychiatry 2006; 163:1760–1766Google Scholar
38. Shaw SH, Kelly M, Smith AB, Shields G, Hopkins PJ, Loftus J, Laval SH, Vita A, De Hert M, Cardon LR, Crow TJ, Sherrington R, DeLisi LE: A genome-wide search for schizophrenia susceptibility genes. Am J Med Genet 1998; 81:364–376Google Scholar
39. Arinami T, Ohtsuki T, Ishiguro H, Ujike H, Tanaka Y, Morita Y, Mineta M, Takeichi M, Yamada S, Imamura A, Ohara K, Shibuya H, Ohara K, Suzuki Y, Muratake T, Kaneko N, Someya T, Inada T, Yoshikawa T, Toyota T, Yamada K, Kojima T, Takahashi S, Osamu O, Shinkai T, Nakamura M, Fukuzako H, Hashiguchi T, Niwa SI, Ueno T, Tachikawa H, Hori T, Asada T, Nanko S, Kunugi H, Hashimoto R, Ozaki N, Iwata N, Harano M, Arai H, Ohnuma T, Kusumi I, Koyama T, Yoneda H, Fukumaki Y, Shibata H, Kaneko S, Higuchi H, Yasui-Furukori N, Numachi Y, Itokawa M, Okazaki Y: Genomewide high-density SNP linkage analysis of 236 Japanese families supports the existence of schizophrenia susceptibility loci on chromosomes 1p, 14q, and 20p. Am J Hum Genet 2005; 77:937–944Google Scholar
40. Cordell HJ: Sample size requirements to control for stochastic variation in magnitude and location of allele-sharing linkage statistics in affected sibling pairs. Ann Hum Genet 2001; 65(pt 5):491–502Google Scholar
41. Lewis CM, Levinson DF, Wise LH, DeLisi LE, Straub RE, Hovatta I, Williams NM, Schwab SG, Pulver AE, Faraone SV, Brzustowicz LM, Kaufmann CA, Garver DL, Gurling HM, Lindholm E, Coon H, Moises HW, Byerley W, Shaw SH, Mesen A, Sherrington R, O’Neill FA, Walsh D, Kendler KS, Ekelund J, Paunio T, Lonnqvist J, Peltonen L, O’Donovan MC, Owen MJ, Wildenauer DB, Maier W, Nestadt G, Blouin JL, Antonarakis SE, Mowry BJ, Silverman JM, Crowe RR, Cloninger CR, Tsuang MT, Malaspina D, Harkavy-Friedman JM, Svrakic DM, Bassett AS, Holcomb J, Kalsi G, McQuillin A, Brynjolfson J, Sigmundsson T, Petursson H, Jazin E, Zoega T, Helgason T: Genome scan meta-analysis of schizophrenia and bipolar disorder, part II: schizophrenia. Am J Hum Genet 2003; 73:34–48Google Scholar
42. Badner JA, Gershon ES: Meta-analysis of whole-genome linkage scans of bipolar disorder and schizophrenia. Mol Psychiatry 2002; 7:405–411Google Scholar
43. Zintzaras E, Ioannidis JP: Heterogeneity testing in meta-analysis of genome searches. Genet Epidemiol 2005; 28:123–137Google Scholar
44. Pulver AE, Wolyniec PS, Housman D, Kazazian HH, Antonarakis SE, Nestadt G, Lasseter VK, McGrath JA, Dombroski B, Karayiorgou M, Ton C, Blouin JL, Kempf L: The Johns Hopkins University Collaborative Schizophrenia Study: an epidemiologic-genetic approach to test the heterogeneity hypothesis and identify schizophrenia susceptibility genes. Cold Spring Harb Symp Quant Biol 1996; 61:797–814Google Scholar
45. Lin MW, Sham P, Hwu HG, Collier D, Murray R, Powell JF: Suggestive evidence for linkage of schizophrenia to markers on chromosome 13 in Caucasian but not Oriental populations. Hum Genet 1997; 99:417–420Google Scholar
46. Blouin JL, Dombroski BA, Nath SK, Lasseter VK, Wolyniec PS, Nestadt G, Thornquist M, Ullrich G, McGrath J, Kasch L, Lamacz M, Thomas MG, Gehrig C, Radhakrishna U, Snyder SE, Balk KG, Neufeld K, Swartz KL, DeMarchi N, Papadimitriou GN, Dikeos DG, Stefanis CN, Chakravarti A, Childs B, Housman DE, Kazazian HH, Antonarakis S, Pulver AE: Schizophrenia susceptibility loci on chromosomes 13q32 and 8p21. Nat Genet 1998; 20:70–73Google Scholar
47. Brzustowicz LM, Honer WG, Chow EW, Little D, Hogan J, Hodgkinson K, Bassett AS: Linkage of familial schizophrenia to chromosome 13q32. Am J Hum Genet 1999; 65:1096–1103Google Scholar
48. Bailer U, Leisch F, Meszaros K, Lenzinger E, Willinger U, Strobl R, Gebhardt C, Gerhard E, Fuchs K, Sieghart W, Kasper S, Hornik K, Aschauer HN: Genome scan for susceptibility loci for schizophrenia. Neuropsychobiology 2000; 42:175–182Google Scholar
49. Roberts SB, MacLean CJ, Neale MC, Eaves LJ, Kendler KS: Replication of linkage studies of complex traits: an examination of variation in location estimates. Am J Hum Genet 1999; 65:876–884Google Scholar
50. DeLisi LE, Shaw SH, Crow TJ, Shields G, Smith AB, Larach VW, Wellman N, Loftus J, Nanthakumar B, Razi K, Stewart J, Comazzi M, Vita A, Heffner T, Sherrington R: A genome-wide scan for linkage to chromosomal regions in 382 sibling pairs with schizophrenia or schizoaffective disorder. Am J Psychiatry 2002; 159:803–812Google Scholar
51. Williams NM, Norton N, Williams H, Ekholm B, Hamshere ML, Lindblom Y, Chowdari KV, Cardno AG, Zammit S, Jones LA, Murphy KC, Sanders RD, McCarthy G, Gray MY, Jones G, Holmans P, Nimgaonkar V, Adolfson R, Osby U, Terenius L, Sedvall G, O’Donovan MC, Owen MJ: A systematic genomewide linkage study in 353 sib pairs with schizophrenia. Am J Hum Genet 2003; 73:1355–1367Google Scholar
52. Padmavathi R, Rajkumar R, Kumar N, Manoharan A, Kamath S: Prevalence of schizophrenia in an urban community in Madras. Indian J Psychiatry 1988; 30:233–240Google Scholar
53. Rajkumar S, Padmavati R, Thara R, Sarada Menon M: Incidence of schizophrenia in an urban community in Madras. Indian J Psychiatry 1993; 35:18–21Google Scholar
54. Thara R, Rajkuma S, Joseph A: Chennai (Madras), in India in Recovery From Schizophrenia: An International Perspective. Edited by Hopper K, Harrison G, Janca A, Sartorius N. New York, Oxford University Press, 2007Google Scholar
55. Fingerlin TE, Boehnke M, Abecasis GR: Increasing the power and efficiency of disease-marker case-control association studies through use of allele-sharing information. Am J Hum Genet 2004; 74:432–443Google Scholar