Association Between the Insulin-Like Growth Factor 2 Gene (IGF2) and Scores on the Eating Attitudes Test in Nonclinical Subjects: A Family-Based Study
Abstract
OBJECTIVE: An interesting candidate gene for eating disorders is the gene for insulin-like growth factor 2 (IGF2). Located on chromosome 11p15.5, IGF2 is a member of the insulin family of polypeptide growth factors that is involved in development and growth. Consistent with its profile of metabolic actions, an association has been reported between a single nucleotide polymorphism (SNP) in the 3′ untranslated region of the IGF2 gene (ApaI) and body mass index. This investigation extended these studies and investigated the psychological and behavioral implications of this hormone’s impact on metabolism and body composition. METHOD: The authors tested nonclinical subjects from 376 families for three IGF2 SNPs and for eating disorders, as reflected in scores on the 26-item Eating Attitudes Test, a self-report questionnaire widely used as a screening instrument. RESULTS: A highly significant association was observed between the IGF2ApaI G allele and scores on the Eating Attitudes Test overall and each of its subscales (bulimia, dieting, and oral control). Additionally, a significant association was observed between this polymorphism and body mass index. CONCLUSIONS: The current finding that the IGF2ApaI G polymorphism, which predisposes to weight gain, may also contribute to the pathology of eating disorders is intriguing. Neurotransmitter modulation of appetitive behavior is the focus of most hypotheses regarding the etiology of severe eating disorders. The current results to some measure challenge this view, and inborn metabolic tendencies to weight gain in some women may trigger constant dieting, which in predisposed individuals eventually leads to severe eating disorders.
The etiology of severe eating disorders—anorexia nervosa, bulimia nervosa, and binge eating disorder—is complex, and multiple influences confer risk for this behavior (1). As noted by Kaye and Strober (2), the stereotyped clinical presentation, sex distribution, and age at onset support the likelihood that there is some biological vulnerability to this disorder. Large twin studies show that the co-twin of a twin affected with anorexia nervosa is 26 times as likely to have a lifetime diagnosis of bulimia nervosa as is the co-twin of an unaffected twin (3), strengthening the notion that genes are important in the etiology of anorexia nervosa and bulimia nervosa.
A familiar hypothesis regarding the genetic basis of complex diseases, such as anorexia nervosa and bulimia nervosa, is that numerous polymorphisms contribute somewhat to risk. If this notion is true, then a cost-effective, complementary strategy for discovering “eating disorder” genes is to study easily accessible and large nonpatient groups rather than solely examining less available and necessarily smaller clinical groups. Common polymorphisms in the nonclinical group are predicted to partially contribute to an eating disorder phenotype that can be readily ascertained by self-report questionnaires relevant to eating behavior and estimations of body mass index. Once such genes are identified in the nonpatients, their role in pathology can be tested in the clinical group exhibiting an extreme phenotype. Studying phenotypes, or endophenotypes, is emerging as a robust strategy in unraveling the genetic architecture of complex diseases (4).
An interesting candidate gene that makes “biological sense” for a role in eating disorders and has not yet been examined, to our knowledge, is the gene for insulin-like growth factor 2. This gene, IGF2, is located on chromosome 11p15.5 (5). Insulin-like growth factor 2, also known as somatomedin A, is a single-chain polypeptide that shares an amino acid sequence homology of about 47% with insulin and about 31% with relaxin and with them comprise the insulin family of polypeptide growth factors. Their functions include mediation of growth hormone action, stimulation of growth of cultured cells, stimulation of the action of insulin, and involvement in development and growth. They appear to be autocrine regulators of cell proliferation. Consistent with this profile of metabolic actions, an association has been reported between a single nucleotide polymorphism (SNP) in the 3′ untranslated region of the IGF2 gene (ApaI) and body mass index (6) that accounts for a small percentage of the population variance. A number of studies appear to confirm this initial finding, including suggestive evidence from a genome scan for obesity (7–10). IGF2 is also expressed in fetal and adult brains (11, 12).
The transmission disequilibrium test (13) and its extension to quantitative traits (14, 15) provide an efficacious procedure for detecting linkage and association, especially in the presence of population admixture. Even though this procedure has been widely used, it is not suitable for groups composed of families with multiple siblings, which decrease the efficiency of the analysis performed. More recently, a new unified approach, the family-based association test (16), for testing association by using any type of family configuration and any type of phenotype (either qualitative or quantitative) has been developed. As our subject group was composed of families with multiple siblings, we applied this new procedure, which allowed us to use all the information contained in our study group despite the varied number of siblings in these families. In this large, nonclinical group of 376 nuclear families we used the family-based association test (16) to test the association between three IGF2 SNPs and eating behavior. Eating behavior was assessed by using the 26-item Eating Attitudes Test (17, 18), which is probably the most widely used standardized measure of symptoms and concerns characteristic of eating disorders. Numerous studies have used the Eating Attitudes Test as a screening tool. Moreover, overall scores show heritability of approximately 40% in normal female twins (19).
Method
Subjects
The respondents were primarily college students at Israeli colleges and their families, recruited by word of mouth and advertisements on campus notice boards. The group analyzed in the current study included 376 families including 1,549 persons; 12% of the families had one offspring apiece, 71% had two siblings, 11% had three siblings, and 6% had four or more siblings. The sibling ages were between 14 and 34 years (average=22.30).
Each contact person received a number of questionnaires (equal to the number of participating siblings) and two sterile test tubes per family member for DNA sampling; each test tube contained 10 cm3 of Aquafresh mouthwash. Questionnaires were completed by siblings but not parents. After complete description of the study to the subjects, written informed consent was obtained. The completed questionnaires and DNA samples were returned by mail or hand-delivered to an office. The contact person received a modest monetary incentive, and the study was approved by the local institutional review board and by the Israeli Ministry of Health Genetics Committee.
Instruments
Eating Attitudes Test
The Eating Attitudes Test is a 26-item self-report factor-analytically derived scale, originally validated on 160 women with eating disorders and 140 female nonclinical comparison subjects (18). It is reliable and valid, correlates highly with the original 40-item scale (r=0.98) (18), and screens for cases of eating disorders in both clinical and nonclinical subjects. Each item is scored on a 6-point Likert scale with answers ranging from “never” to “always.” For clinical purposes, the three least frequent categories (“never,” “rarely,” and “sometimes”) are given a score of 0, “often” is scored as 1, “usually” is scored as 2, and “always” is given a score of 3. In order to maximize variance, however, we assigned scores for each item ranging from 0 (“never”) to 5 (“always”). Scores above 20 are generally considered indicative of risk for developing eating disorders. In the group we examined, 10.9% of the subjects scored above this threshold, 14.4% of the females and only 3.0% of the males. Similar results have been observed in college groups in the United States (20).
The three Eating Attitudes Test subscales are dieting, bulimia, and oral control. The dieting subscale contains 13 items, which tap restrictive behaviors such as intake reduction for weight loss purposes, feeling guilt after eating, and preoccupation with thinness and weight loss. The bulimia subscale contains seven items, which assess binge eating, vomiting, and food preoccupation. It distinguishes not only eating disordered from comparison subjects but also women with a restricting type of eating disorder from women with a bulimic type. The oral control subscale contains six items, which assess the degree of self-control over eating and perceived external pressure to eat.
Eating Disorder Inventory subscales
The Eating Disorder Inventory-2 is a self-report measure of symptoms generally related to eating disorders (21). It contains 11 standardized subscales, each independently derived and representing a unique trait. In the present study, the subscales for body dissatisfaction and drive for thinness were used. They have excellent internal consistency, content validity, and criterion-based and construct validity and good test-retest reliability in eating disordered and healthy comparison subjects (21).
The drive for thinness subscale (seven items) assesses preoccupation with body weight, fear of gaining weight, desire to be thin, and food intake restriction. The body dissatisfaction subscale (nine items) measures overall satisfaction with the shape and size of various parts of the body. Respondents are asked to state how often, on a scale of 0 (never) to 5 (always), they think, for example, that their hips or thighs are too large.
DNA Extraction and Genotyping
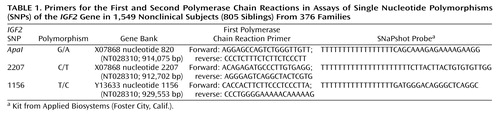
DNA was obtained from all family members and extracted by a Master Pure kit (Epicentre Biotechnologies, Madison, Wis.). SNPs were assayed by using an ABI SNaPshot kit (Applied Biosystems, Foster City, Calif.), and the products were analyzed in an ABI 310 DNA analyzer (Applied Biosystems). The primers for the first and second polymerase chain reactions are shown in Table 1. A ReddyMix master mix was used (Abgene, Surrey, U.K.) at a magnesium concentration of 1.5–2.5 mM MgCl2. The first polymerase chain reaction was carried out as follows. The sample was initially heated at 95°C for 5 minutes followed by 35 cycles of 95°C (30 seconds), 55°C (30 seconds), 72°C (90 seconds), and a final extension step of 72°C for 10 minutes. These SNPs have been described by Gaunt et al. (9).
The quality of genotyping was determined as follows. First, all families were initially screened for Mendelian consistency by using seven highly polymorphic microsatellite markers. Problematic families that were not consistent with Mendelian inheritance (<1%) were excluded from the study. Second, since all subjects in the current study were family members, genotype errors with the three IGF2 SNPs appearing as Mendelian inconsistency, which were automatically flagged by the family-based association test, were reexamined either by searching for data entry errors or by regenotyping such families for the IGF2 SNPs. Third, in all cases when the output resulted in borderline classifications, the polymerase chain reaction procedure was repeated. Fourth, quality control and estimation of the error rate (percentage of miscalled genotypes) were evaluated by reanalysis of 5% of the families. The observed error rate was estimated to be less than 0.5%. Fifth, since deviation from Hardy-Weinberg equilibrium in random samples may be indicative of problematic assays (22), the frequencies of the three IGF2 SNPs were examined for the Hardy-Weinberg equilibrium. No significant deviation from the Hardy-Weinberg equilibrium was observed (IGF2 1156: χ2=1.87, df=1, n.s.; 2207: χ2=0.71, df=1, n.s.; ApaI: χ2=0.59, df=1, n.s.). Sixth, the allele and genotype frequencies reported in our study were similar to those reported in a British population, e.g., the frequency of the ApaI AA genotype was 31% in our group and 28% in the British study (9).
Statistical Analysis
We tested for the presence of associations between the three SNPs and scores on the Eating Attitudes Test and Eating Disorder Inventory-2 by using the family-based association test (http://www.biostat.harvard.edu/~fbat/fbat.htm), which allows for inclusion of both triads and extended families in the analysis and is adjusted for population admixture (16). Pairwise linkage disequilibrium was tested by using the Graphical Overview of Linkage Disequilibrium (GOLD) program (23) (http://www.sph.umich.edu/csg/abecasis/GOLD/index.html).
Results
The two self-report measures of eating behavior were strongly correlated in these subjects (N=845): the score on the Eating Attitudes Test correlated with both the Eating Disorder Inventory-2 body dissatisfaction subscale (r=0.63, p<0.001) and drive for thinness subscale (r=0.88, p<0.001). Similar results were observed when men and women were separately analyzed. Body mass index was also correlated with Eating Attitudes Test scores, but weakly (r=0.13, p<0.001).
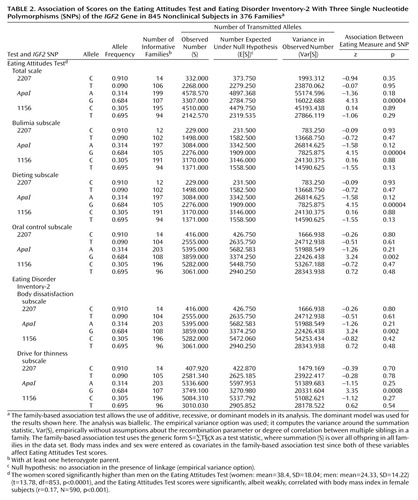
As shown in Table 2, analysis with the family-based association test showed a highly significant association between the IGF2ApaI G allele and Eating Attitudes Test scores overall as well as for each of its subscales: bulimia, dieting, and oral control. Significant association was also observed between the IGF2ApaI G allele and the scores on the body dissatisfaction and drive for thinness subscales of the Eating Disorder Inventory-2. Subjects with the G allele had higher scores. Haplotype analysis as provided for in the program for the family-based association test showed that the association with the CAT haplotype (2207-ApaI-1156) was significant for scores on the total Eating Attitudes Test (z=–3.04, p=0.003) and all three subscales: bulimia (z=3.05, p=0.002), dieting (z=3.05, p=0.002), and oral control (z=–2.01, p=0.05). This haplotype was associated with lower Eating Attitudes Test scores. Note, however, that the genetic information is primarily generated by the ApaI SNP, whereas little additional information is provided by the two other SNPs genotyped in this study, 1156 and 2207.
The data were also analyzed with a qualitative approach by setting a cutoff point on the Eating Attitudes Test of 20. Individuals scoring higher than 20 on this scale are generally considered at risk for eating disorders (20), and we categorized subjects with scores above 20 as “affected” in the family-based association test. This also indicated preferential transmission of the IGF2ApaI G allele to the group with high scores on the Eating Attitudes Test (z=3.94, p=0.00008). Hence, the quantitative and qualitative approaches to data analysis yielded similar results.
We first estimated the effect size of the IGF2ApaI G allele by comparing mean scores of all female subjects with the AA and GG genotypes on the Eating Disorder Inventory-2 drive for thinness subscale (AA: mean=12.71, SD=9.99; GG: mean=16.13, SD=9.09). This difference was significant (t=2.06, df=310, p=0.04, N=312). The effect size of GG homozygosity is small (0.36) according to Cohen’s widely used interpretation (24). Similar results in regard to effect size were obtained for the other eating-related measures. Small effect sizes have generally been observed for genes contributing to behavioral quantitative trait loci representing a variety of phenotypes. For example, in a meta-analysis of the DRD4 7-repeat allele and attention deficit hyperactivity disorder, an overall odds ratio of 1.9 (corresponding to a small effect size) was observed (25).
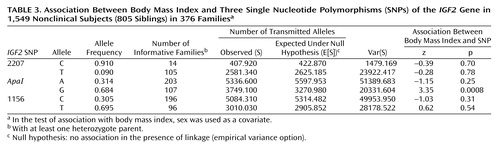
We also tested for association between the three IGF2 SNPs and body mass index (Table 3). A highly significant association was observed between the IGF2ApaI G allele and body mass index.
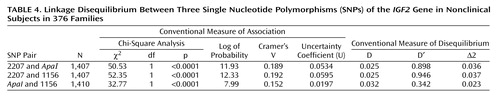
All three SNPs are in linkage disequilibrium (Table 4).
Discussion
One particular SNP, ApaI, in the IGF2 gene has been shown to have a modest influence on body mass index and an inherited predisposition to weight gain (9). The current finding that it may also contribute to the pathology of eating disorders, as evidenced by its association with scores on the Eating Attitudes Test, is intriguing. Previous studies of this gene in humans have focused on its role in metabolism and body composition. The current findings extend our knowledge of this gene’s action by exploring the impact of the common IGF2 polymorphisms on psychological processes related to eating behavior. Neurotransmitter modulation of appetitive behavior is the focus of most hypotheses regarding the etiology of severe eating disorders (26–28). However, the current results to some measure challenge this view, and we hypothesize that inborn metabolic tendencies to gain weight in some women may trigger constant dieting that in some individuals eventually leads to severe eating disorders, including anorexia nervosa, bulimia nervosa, and binge eating disorder. Not surprisingly, a gene that predisposes to modest increases in body mass index also is also associated with scores on the Eating Disorder Inventory-2 drive for thinness subscale, which measures excessive concern with dieting.
These data confirm in an exclusively Jewish population the association between the IGF2ApaI G allele and body mass index that has been observed in several investigations (6–10). In a study in the United Kingdom, the less common ApaI A allele was associated with lower body mass index (9). In the current study this same allele was also associated with lower body mass index. However, in an American study of a mixed ethnic group of 500 men and women, Caucasian subjects with the IGF2ApaI AA genotype exhibited significantly greater fat mass than did Caucasian GG subjects, but no association with body mass index was observed (8). It is interesting that the evidence provided by the U.K. studies (5, 6, 9, 10) suggests that the association between IGF2 SNPs and body mass index represents an association between a genomic region rather than a specific etiological SNP. Moreover, the weight-lowering effect of less common IGF2 alleles was apparent in all quintiles of body mass index, strengthening the notion that rare IGF2 SNPs in the U.K. study exert their effects across the whole range of body weights. Overall, these results suggest that the IGF2ApaI polymorphism’s role in body composition is influenced by both other SNPs within the IGF2 genomic region and other genes.
The mechanism by which IGF2 affects body mass index was suggested in a study employing a 100-day overfeeding protocol conducted with pairs of monozygotic twins (29). In response to caloric surplus, fasting plasma levels of insulin increased more among the subjects with the IGF2ApaI GG genotype than among those with AA or AG. The changes were independent of changes in total fatness. The ApaI G allele is also associated with significantly higher levels of IGF2 mRNA than is the A allele, showing a role for this polymorphism in the transcription of this gene (30). As expected for a hormone that in humans increases growth, the IGF2 knockout mouse presents a lighter, smaller phenotype (31) and a transgenic IGF2 mouse overexpressing insulin-like growth factor 2 is heavier than controls (32).
In the current study, the IGF2ApaI G allele was associated with a number of phenotypes (various measures of eating behavior, body mass index). The association across phenotypes reflecting direct measurements of eating behavior is not surprising since these variables (Eating Attitudes Test, its subscales, Eating Disorder Inventory-2 body dissatisfaction and drive for thinness subscales, body mass index) are correlated. The current results therefore support the notion that the association between the IGF2ApaI G allele and various measures of eating behavior and body mass index are “driven” by the G allele’s effect on body mass and composition (6–10). It is worth noting that the metabolic profile associated with the IGF2ApaI G allele precedes the onset of eating disorders and sets the stage, by its impact on adiposity and body mass index, for the onset of the clinical syndromes associated with eating disorders in some women. Although we have emphasized the risk conferred by the IGF2ApaI G allele, it should be underscored that the rare AA homozygote subjects (approximately 9% in this population) are seemingly protected by their low body mass index against the development of eating disorders.
We are aware of at least one other study, of binge eating, that showed a significant association between an eating disorder and a “metabolism” gene, the MC4R coding region (the leptin binding domain) of the proopiomelanocortin gene (POMC) (33). All carriers of MC4R mutations were given a diagnosis of binge eating disorder, suggesting to the authors that MC4R is a candidate gene in the control of eating behavior. The current report, based on an investigation of a nonclinical population, suggests that a second “metabolism” gene, IGF2, also contributes to the control of eating behavior in humans.
Anorexia nervosa, bulimia nervosa, and binge eating disorder present a complex phenotype associated with aberrant eating behaviors, body image distortions, impulse and mood disturbances, hormonal and mineral imbalances, and characteristic temperament and personality traits. Employing a strategy of decomposing the phenotype of severe eating disorders into quantitative trait loci, we show in the present study that the IGF2ApaI SNP is associated with scores on the Eating Attitudes Test, an instrument sensitive to pathological eating behavior, in a nonclinical population. Our results suggest the hypothesis that some individuals predisposed to modest increases in body mass index due to common polymorphisms in the IGF2 gene, and perhaps unduly influenced by the media message that thin is better (34, 35), embark on a course of constant dieting that slowly evolves into a pattern of abnormal eating behavior and, in a small percentage of such individuals, the full-blown clinical syndromes.
 |
 |
 |
 |
Received April 20, 2004; revision received July 28, 2004; accepted Sept. 24, 2004. From the Department of Psychology and the Scheinfeld Center for Human Genetics in the Social Sciences, Hebrew University; the Department of Psychology, Division of Behavioral Sciences, Ruppin Academic Center, Emek Hefer, Israel; and the Department of Research, Sarah Herzog Memorial Hospital, Jerusalem. Address correspondence and reprint requests to Dr. Ebstein, Scheinfeld Center for Human Genetics in the Social Sciences, Department of Psychology, Hebrew University, Jerusalem 91905, Israel; [email protected] (e-mail). Partially supported by the Israel Science Foundation, founded by the Israel Academy of Sciences and Humanities (Dr. Ebstein).
1. Garner DM: Pathogenesis of anorexia nervosa. Lancet 1993; 341:1631–1635Crossref, Medline, Google Scholar
2. Kaye WH, Strober M: Neurobiology of eating disorders, in Neurobiological Foundations of Mental Illness. Edited by Charney DE, Nestler EJ, Bunney BS. New York, Oxford University Press, 1999, pp 891–906Google Scholar
3. Walters EE, Kendler KS: Anorexia nervosa and anorexic-like syndromes in a population-based female twin sample. Am J Psychiatry 1995; 152:64–71Link, Google Scholar
4. Gottesman II, Gould TD: The endophenotype concept in psychiatry: etymology and strategic intentions. Am J Psychiatry 2003; 160:636–645Link, Google Scholar
5. O’Dell SD, Day IN: Insulin-like growth factor II (IGF-II). Int J Biochem Cell Biol 1998; 30:767–771Crossref, Medline, Google Scholar
6. O’Dell SD, Miller GJ, Cooper JA, Hindmarsh PC, Pringle PJ, Ford H, Humphries SE, Day IN: Apal polymorphism in insulin-like growth factor II (IGF2) gene and weight in middle-aged males. Int J Obes Relat Metab Disord 1997; 21:822–825Crossref, Medline, Google Scholar
7. Rice T, Chagnon YC, Perusse L, Borecki IB, Ukkola O, Rankinen T, Gagnon J, Leon AS, Skinner JS, Wilmore JH, Bouchard C, Rao DC: A genomewide linkage scan for abdominal subcutaneous and visceral fat in black and white families: the HERITAGE Family Study. Diabetes 2002; 51:848–855Crossref, Medline, Google Scholar
8. Roth SM, Schrager MA, Metter EJ, Riechman SE, Fleg JL, Hurley BF, Ferrell RE: IGF2 genotype and obesity in men and women across the adult age span. Int J Obes Relat Metab Disord 2002; 26:585–587Crossref, Medline, Google Scholar
9. Gaunt TR, Cooper JA, Miller GJ, Day IN, O’Dell SD: Positive associations between single nucleotide polymorphisms in the IGF2 gene region and body mass index in adult males. Hum Mol Genet 2001; 10:1491–1501Crossref, Medline, Google Scholar
10. O’Dell SD, Bujac SR, Miller GJ, Day IN: Associations of IGF2 ApaI RFLP and INS VNTR class I allele size with obesity. Eur J Hum Genet 1999; 7:821–827Crossref, Medline, Google Scholar
11. Hemberger M, Redies C, Krause R, Oswald J, Walter J, Fundele RH: H19 and Igf2 are expressed and differentially imprinted in neuroectoderm-derived cells in the mouse brain. Dev Genes Evol 1998; 208:393–402Crossref, Medline, Google Scholar
12. Pham NV, Nguyen MT, Hu JF, Vu TH, Hoffman AR: Dissociation of IGF2 and H19 imprinting in human brain. Brain Res 1998; 810:1–8Crossref, Medline, Google Scholar
13. Spielman RS, McGinnis RE, Ewens WJ: Transmission test for linkage disequilibrium: the insulin gene region and insulin-dependent diabetes mellitus (IDDM). Am J Hum Genet 1993; 52:506–516Medline, Google Scholar
14. Waldman ID, Robinson BF, Feigon SA: Linkage disequilibrium between the dopamine transporter gene (DAT1) and bipolar disorder: extending the transmission disequilibrium test (TDT) to examine genetic heterogeneity. Genet Epidemiol 1997; 14:699–704Crossref, Medline, Google Scholar
15. Rabinowitz D: A transmission disequilibrium test for quantitative trait loci. Hum Hered 1997; 47:342–350Crossref, Medline, Google Scholar
16. Laird NM, Horvath S, Xu X: Implementing a unified approach to family-based tests of association. Genet Epidemiol 2000; 19(suppl 1):S36-S42Google Scholar
17. Garner DM, Garfinkel PE: The Eating Attitudes Test: an index of the symptoms of anorexia nervosa. Psychol Med 1979; 9:273–279Crossref, Medline, Google Scholar
18. Garner DM, Olmsted MP, Bohr Y, Garfinkel P: The Eating Attitudes Test: psychometric features and clinical correlates. Psychol Med 1982; 12:871–878Crossref, Medline, Google Scholar
19. Rutherford J, McGuffin P, Katz RJ, Murray RM: Genetic influences on eating attitudes in a normal female twin population. Psychol Med 1993; 23:425–436Crossref, Medline, Google Scholar
20. Hoerr SL, Bokram R, Lugo B, Bivins T, Keast DR: Risk for disordered eating relates to both gender and ethnicity for college students. J Am Coll Nutr 2002; 21:307–314Crossref, Medline, Google Scholar
21. Garner DM: Eating Disorder Inventory-2: Professional Manual. Odessa, Fla, Psychological Assessment Resources, 1991Google Scholar
22. Hosking L, Lumsden S, Lewis K, Yeo A, McCarthy L, Bansal A, Riley J, Purvis I, Xu CF: Detection of genotyping errors by Hardy-Weinberg equilibrium testing. Eur J Hum Genet 2004; 12:395–399Crossref, Medline, Google Scholar
23. Abecasis GR, Cookson WO: GOLD—graphical overview of linkage disequilibrium. Bioinformatics 2000; 16:182–183Crossref, Medline, Google Scholar
24. Cohen J: Statistical Power Analysis for the Behavioral Sciences. Hillsdale, NJ, Lawrence Erlbaum Associates, 1988Google Scholar
25. Faraone SV, Doyle AE, Mick E, Biederman J: Meta-analysis of the association between the 7-repeat allele of the dopamine D4 receptor gene and attention deficit hyperactivity disorder. Am J Psychiatry 2001; 158:1052–1057Link, Google Scholar
26. Bailer UF, Kaye WH: A review of neuropeptide and neuroendocrine dysregulation in anorexia and bulimia nervosa. Curr Drug Targets CNS Neurol Disord 2003; 2:53–59Crossref, Medline, Google Scholar
27. Barbarich NC, Kaye WH, Jimerson D: Neurotransmitter and imaging studies in anorexia nervosa: new targets for treatment. Curr Drug Targets CNS Neurol Disord 2003; 2:61–72Crossref, Medline, Google Scholar
28. Vettor R, Fabris R, Pagano C, Federspil G: Neuroendocrine regulation of eating behavior. J Endocrinol Invest 2002; 25:836–854Crossref, Medline, Google Scholar
29. Ukkola O, Sun G, Bouchard C: Insulin-like growth factor 2 (IGF2) and IGF-binding protein 1 (IGFBP1) gene variants are associated with overfeeding-induced metabolic changes. Diabetologia 2001; 44:2231–2236Crossref, Medline, Google Scholar
30. Vafiadis P, Bennett ST, Todd JA, Grabs R, Polychronakos C: Divergence between genetic determinants of IGF2 transcription levels in leukocytes and of IDDM2-encoded susceptibility to type 1 diabetes. J Clin Endocrinol Metab 1998; 83:2933–2939Medline, Google Scholar
31. DeChiara TM, Robertson EJ, Efstratiadis A: Parental imprinting of the mouse insulin-like growth factor II gene. Cell 1991; 64:849–859Crossref, Medline, Google Scholar
32. Sun FL, Dean WL, Kelsey G, Allen ND, Reik W: Transactivation of Igf2 in a mouse model of Beckwith-Wiedemann syndrome. Nature 1997; 389:809–815Crossref, Medline, Google Scholar
33. Branson R, Potoczna N, Kral JG, Lentes KU, Hoehe MR, Horber FF: Binge eating as a major phenotype of melanocortin 4 receptor gene mutations. N Engl J Med 2003; 348:1096–1103Crossref, Medline, Google Scholar
34. Stice E, Schupak-Neuberg E, Shaw HE, Stein RI: Relation of media exposure to eating disorder symptomatology: an examination of mediating mechanisms. J Abnorm Psychol 1994; 103:836–840Crossref, Medline, Google Scholar
35. Stice E, Shaw HE: Adverse effects of the media-portrayed thin ideal on women and linkages to bulimic symptomatology. J Soc Clin Psychol 1994; 13:288–308Crossref, Google Scholar