Neural Substrates of Decision Making in Adults With Attention Deficit Hyperactivity Disorder
Abstract
OBJECTIVE: The characteristics of attention deficit hyperactivity disorder (ADHD) include abnormalities in reward responsivity that may interfere with decision making. The study examined reward responsivity in ADHD by comparing the neural correlates of decision making in adults with childhood-onset ADHD and in healthy adults. METHOD: The neural correlates of performance on a decision-making task and a control task were compared in 10 adults with ADHD and 12 age-matched healthy volunteers by using [15O]H2O positron emission tomography. The decision-making task tested the ability to weigh short-term rewards against long-term losses. The control task matched all components of the decision-making task except for the decision-making process and related contingency. RESULTS: The ventral and dorsolateral prefrontal cortex and the insula were activated during performance of the decision-making task in both the ADHD and healthy groups; however, activation in the ADHD group was less extended and did not involve other regions, such as anterior cingulate and hippocampus, that subserve emotion/memory processes. Direct comparison of data from the ADHD subjects and the healthy volunteers suggested that the healthy subjects engaged the hippocampal and insular regions more than did the ADHD subjects and that the ADHD subjects recruited the caudal part of the right anterior cingulate more than did the healthy subjects. CONCLUSIONS: The findings suggest that the neural circuits engaged during decision making differ in subjects with ADHD and healthy comparison subjects. This difference may explain observed deficits in motivated behaviors in ADHD. A better understanding of the nature of these deficits could ultimately be applied to refine treatment strategies for ADHD.
Individuals with attention deficit hyperactivity disorder (ADHD) respond to reinforcements, such as rewards or punishments, differently than healthy comparison subjects (for review, see reference 1). Some reports have shown that children with ADHD require stronger and more salient reinforcers to regulate their behavior than do healthy children, that they are less sensitive to changes in reinforcement contingencies (2), and that negative reinforcers are more effective than rewards in enhancing their cognitive performance (3–6). Other reports on the effects of reinforcement contingencies (7) and on the effectiveness of punishment (8) have not supported these findings.
Despite inconsistencies in findings from laboratory studies of reward processes in ADHD (for review see reference 9), the first lines of treatment for this disorder directly affect reward-related systems (10). The behavioral approach is based on increasing the frequency and immediacy of consequences to behavior, and stimulant treatment enhances dopaminergic activity, a key neurochemical substrate of reward systems. The reward-related nature of these treatments constitutes strong evidence for a role of reward processes in ADHD and supports the reward-dysfunction hypothesis as a means for understanding the etiology and treatment of ADHD.
A number of functional neuroimaging studies have examined different aspects of reward-related processes in healthy adults (11–15). Their findings, together with those from electrophysiological research in animals (16, 17), support the involvement of the ventral prefrontal cortex, dorsolateral prefrontal cortex, anterior cingulate, insula, amygdala, hippocampus, and ventral striatum.
The present study compared regional cerebral blood flow (rCBF) in these regions between adults with ADHD and healthy adults during the performance of a decision-making task (18). We hypothesized that ADHD subjects would manifest deficits in the neural circuits that subserve the evaluation of emotional attributes of stimuli. These deficits would interfere with the coding of motivation and explain the impaired response to reinforcers in ADHD.
Method
Subjects
Men and women were recruited through newspaper advertisements. All participants gave written informed consent after receiving an explanation of the study. Inclusion criteria were age between 21 and 45 years, IQ >80 (Shipley Institute of Living Scale [19]), and right-handedness. Exclusion criteria were current psychopathology (as assessed with the SCL-90 [20]), history of psychiatric disorders (as assessed with the NIMH Diagnostic Interview Schedule [21]) except for childhood-onset ADHD, and evidence of acute or chronic medical problems (as indicated by means of medical history, physical examination, and routine blood screening). All patients fulfilled the DSM-IV criteria for ADHD in childhood (as assessed retrospectively with the NIMH Diagnostic Interview Schedule) and currently in adulthood (as assessed with the NIMH Diagnostic Interview Schedule), fulfilled the Utah Criteria for ADHD in adults (22), and had a score >12 on the 10-item Conners Abbreviated Teacher’s Rating Scale (23). Patients treated with stimulants were asked to discontinue treatment for a minimum of 48 hours before scanning.
Study Design
Positron emission tomography (PET) sessions included six 1-minute scans at 12-minute intervals, each following the intravenous injection of 10 mCi of [15O]H2O to assess regional cerebral blood flow (rCBF). Before the PET study, subjects were familiarized with the task in a 1-minute practice. During each scan, participants performed the decision-making task (active task), a control task, and a visual fixation task. The fixation task, used for quality control, was not part of the analysis. Each task was performed twice, and the order of tasks was counterbalanced across subjects.
Decision-Making Task
The decision-making task (Figure 1) is a computerized gambling card game that tests the ability to choose between high gains with a risk for even higher losses and low gain with a risk for smaller losses. It was designed to assess patients who have ventromedial prefrontal lesions and exhibit poor decision making (18). Participants were instructed to accumulate as much (play) money as possible by picking one card at a time from each of four decks (A, B, C, D) until they were told to stop (after selection of the 100th card). They were also told that some decks were better than others and that they would receive one cent for each dollar accumulated (maximum possible $20). Cards could be selected from the decks in any order. Once a card was selected, the message “You get $50” (or $100) immediately appeared on the screen and remained for 1.5 seconds until the subject was prompted to play again by the message, “Pick a card.” If a loss was also attached to that choice, a message lasting 1.5 seconds was added on the screen (e.g., “You must pay $75”). At the end of the 1.5 seconds, the subject was prompted to make the next selection. Each outcome was associated with a sound that was positive for the gains and negative for the losses. The cumulative amount of money was updated on the screen after each card pick. The task was initiated 40 seconds before the injection of the tracer (i.e., an average of 85 seconds before scanning, which started when the tracer entered the brain [∼45 seconds after injection]) to ensure that subjects had selected at least 20 cards before data collection. Scanning lasted 1 minute, during the selection of the next 20 cards. Subjects continued to play until 100 cards were selected.
The decks differed along two dimensions: immediate gain and risk of penalties (Figure 1). The accumulated penalties were larger than the accumulated gains in decks A and B (disadvantageous decks), and the accumulated penalties were smaller than the accumulated gains in decks C and D (advantageous decks).
Control Task
The control task was designed to replicate the decision-making task in all aspects except for decision making. The four decks used for the control task were equal in gains and losses to those in the active task. Therefore, the tasks were similar in sensorimotor demands and in exposure to gains and losses. For the control task, however, the participants did not decide from which deck they would select the cards. Rather, they were instructed to pick cards from the decks sequentially in the fixed order of A-B-C-D-A-B-C-D, etc.
PET
PET scans were performed on a Siemens ECAT EXACT HR+ scanner (Knoxville, Tenn.). This instrument records images of 63 contiguous transaxial slices, with a 15.5-cm field of view that covers the entire brain and a 4.6-mm transaxial resolution. A thermoplastic mask, custom-made for each subject, was used to minimize head movement. Counts of radioactivity were recorded for 1 minute, starting after the tracer had reached the brain (an average 45 seconds after bolus injection). Scans were reconstructed by using a Hann filter with a 0.5 cutoff frequency. As arterial blood was not sampled, absolute rates of rCBF were not determined.
Data Analysis
Demographic, cognitive, and subjective variables
Demographic and cognitive (net score) data are described by using means and standard deviations. The net score was the total number of cards (100 cards) taken from the advantageous decks (C+D) minus the total number of cards taken from the disadvantageous decks (A+B).
Brain imaging analysis
The Statistical Parametric Mapping program (SPM 99) (24) was used for most of the processing and for the analysis of the PET data. To correct for head motion between scans, PET scans for each subject were coregistered by using the Automated Image Registration Program (25) and the SPM 99 realignment module. Scans were then spatially normalized to a standard space corresponding to the Montreal Neurologic Institute brain template (Montreal Neurologic Institute space) (25). Data were smoothed with a 10×10×10 mm Gaussian filter to reduce high-frequency noise and the effects of individual differences in gyral anatomy. A two-stage procedure was implemented for statistical analyses. In the first stage, PET scans from each participant were used to create an adjusted mean image representing the decision-making effect (the two active scans minus the two control scans). In the computation of these adjusted images, proportional scaling (regional signal/global signal) was used to control for within-session variations in the global signal. In the second stage, the single adjusted image from each participant was entered into a two-sample t test analysis or into a simple regression analysis by using a random-effects model (26). Areas of activation were identified by comparison with a standard atlas (27).
We focused our analysis on the regions that have been implicated in reward processes (12–15) and in our previous research in which a group of 20 healthy adults completed the same decision-making task (11). These regions include the ventral and medial prefrontal cortex, anterior cingulate cortex, insular cortex, nucleus accumbens, amygdala, and hippocampus. The statistical threshold for these a priori regional analyses was set at p<0.001 (uncorrected) for height and six contiguous voxels for extent (i.e., 6 times 2×2×2 mm, or 2–3 times the spatial resolution of the scanner). Although the discussion centers almost exclusively on these regions, the tables present all loci of activations for the sake of completeness.
Results
Subjects
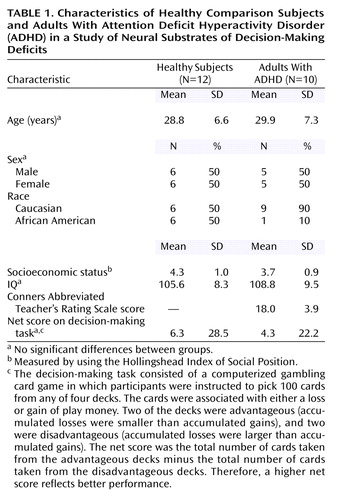
Twelve healthy comparison subjects (six women, six men; mean age=29.9 years, SD=7.3) and 10 adults with ADHD (five women, five men; mean age=28.8 years, SD=6.6) completed the study. Socioeconomic status and IQ did not differ between groups (Table 1). The group of healthy subjects included more African Americans than the ADHD group. Two patients were currently receiving stimulant treatment and discontinued their treatment for at least 48 hours before the PET study. They did not report any exacerbation of native symptoms or emergence of new symptoms after discontinuation of the stimulant. None of the other participants were in treatment. Three patients had received a diagnosis of ADHD in childhood, and two of them had been treated with stimulants; the other seven patients had not been evaluated for ADHD in childhood. Patients’ mean score on the Conners Abbreviated Teacher’s Rating Scale, a measure of current ADHD symptoms, was 18.0 (SD=3.9) (full range of the scale=0–30). A score of 12 and above reflects ADHD pathology. The ADHD group included six subjects with ADHD, combined type, and four subjects with ADHD, predominantly inattentive type. The subjects with the predominantly inattentive type of ADHD reported symptoms of impulsivity, but they failed to meet the criteria for excessive motor activity.
Performance on the decision-making task as measured by the mean scores for the two instances of task performance did not differ between the healthy group (mean net score=6.3, SD=28.5) and the ADHD group (mean net score=4.3, SD=22.2). Scores did not change significantly between the two instances of task performance (run 1 versus run 2) in either the ADHD or the comparison group.
Brain Activation
Activation in each group
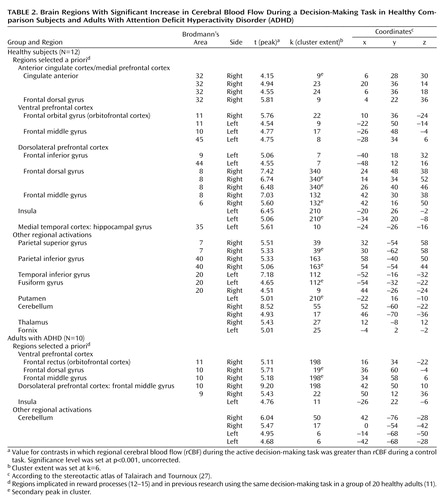
As Table 2 and Figure 2 show, both the comparison group and the ADHD group showed activation of areas in the ventral prefrontal cortex, insula, and dorsolateral prefrontal cortex, as predicted. In addition, the comparison group showed activation of the right anterior cingulate (Brodmann’s area 32) and the left hippocampal gyrus. The ADHD group did not show activation of any additional a priori regions of interest.
Comparison between groups
As Table 3 and Figure 3 show, the brain areas that were activated significantly more in the comparison group than in the ADHD group included the left hippocampal gyrus and left insula. In contrast, the brain areas that were activated in the ADHD group significantly more than in the comparison group included the caudal part of the right anterior cingulate (Brodmann’s area 24).
Correlations of ADHD Severity and Performance Scores With rCBF Activations
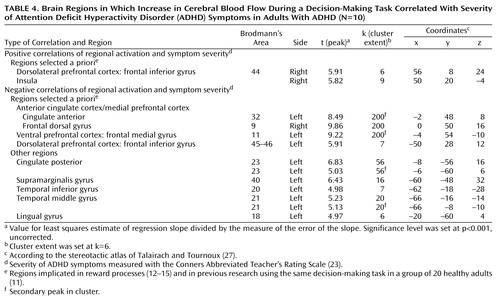
As Table 4 shows, in the ADHD group, severity of ADHD, indexed by scores on the Conners Abbreviated Teacher’s Rating Scale, was positively correlated with rCBF activations in the right dorsolateral prefrontal cortex (Brodmann’s area 44) and right insula. ADHD severity was negatively correlated with rCBF activations in the left anterior cingulate (Brodmann’s area 32), left ventral medial prefrontal cortex (Brodmann’s area 11), left lateral prefrontal cortex (Brodmann’s area 45), and right dorsal medial prefrontal cortex (Brodmann’s area 9).
In the comparison group, performance scores (net scores) were positively correlated with rCBF activations in the right anterior cingulate (Brodmann’s area 32), right and left ventral prefrontal cortex (Brodmann’s area 10, 11), right middle and dorsal prefrontal gyrus (Brodmann’s area 6, 8), left hippocampal gyrus, and left insula (Table 5). Performance scores were negatively correlated with activation in the caudal part of the right anterior cingulate (Brodmann’s area 24) and the left dorsal frontal gyrus (Brodmann’s area 6) (Table 5).
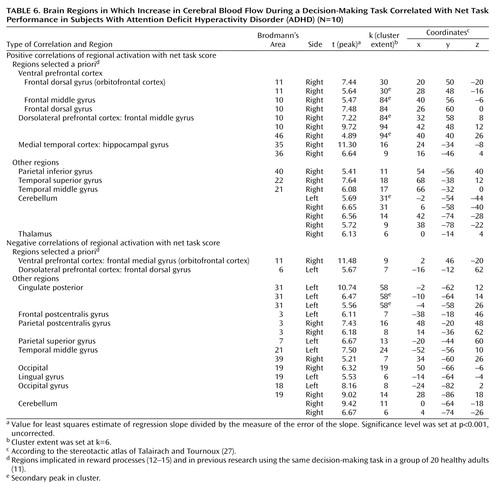
In the ADHD group, performance scores were positively correlated with rCBF in the right ventral prefrontal cortex (Brodmann’s area 10, 11), right middle frontal gyrus (Brodmann’s area 10, 46) and right hippocampus (Table 6). Performance scores were negatively correlated with activation in the right medial orbitofrontal gyrus (Brodmann’s area 11) and left dorsal prefrontal gyrus (Brodmann’s area 6) (Table 6).
Discussion
The neural circuits engaged in decision making differed in adults with ADHD compared to healthy adults. The decision-making task engaged the expected regions of the ventral prefrontal cortex, insula, and dorsolateral prefrontal cortex in both groups. However, activation was overall more extended in the comparison group than in the ADHD group (Figure 2). Furthermore, in contrast to the comparison group, the ADHD group failed to activate other expected limbic areas, i.e., the hippocampus and anterior cingulate (Brodmann’s area 32). The functional significance of these findings can be understood in a number of ways on the basis of the various roles associated with these brain structures. The following discussion represents only one of several possible interpretations of the data. The key point of our proposed model is that the deficits in decision making observed in individuals with ADHD arise from the weaker engagement of brain structures involved in complex cognitive-emotional processes in favor of structures engaged in more primary processes, such as the coding of sensorimotor aspects of stimuli.
Although primarily associated with learning and memory function (28), the hippocampus has been seen as playing a key role in several functions essential to decision making (for review see reference 29). These functions include encoding novelties of stimuli/situations (30), processing spatial information (31), and activating perceptual and emotional representations of past experience to influence output processes (32). Most relevant is the proposed role of the hippocampus in attentional monitoring of online processes (33), which can subserve the continuous recording of conditions of novelty and uncertainty and contribute to the coding of the reinforcing property of stimuli. The positive correlation of performance scores with hippocampal activation in the comparison group suggests a direct role of the hippocampus in the decision-making process tested here. The deficit in hippocampal engagement in the ADHD group, manifested both by the absence of significant hippocampal activation while subjects perform the task and by its significantly greater activation in the comparison subjects than in the ADHD subjects, may explain in part the clinical observation of overall decreased efficacy of reinforcements in this disorder (for review see references 1, 2, and 9). Alternatively, the deficit in hippocampal recruitment may translate as defective memory of the incentive value of the stimuli.
Like the hippocampus, the anterior cingulate (Brodmann’s area 32) was activated in the comparison group and not in the ADHD group. This finding is consistent with a previous report of anterior cingulate dysfunction in ADHD (34). It also supports the role of this region in attention that regulates cognitive and emotional/motivational processing (35). On the basis of cytoarchitecture, anatomical connectivity, and function, the anterior cingulate comprises a number of specialized subdivisions, which subserve functions involved in cognitive, emotional, motor, nociceptive, and visuospatial processing (36, 37). Two major subdivisions—a dorsal cognitive section and a rostroventral emotional section—have been isolated. The cingulate activation in the comparison subjects included two peaks situated at the juncture of these two subdivisions and one other peak in the dorsal cognitive territory, which has been shown to be involved in reward-based decision making (35). A more caudal area of the right anterior cingulate (Brodmann’s area 24) was the only region significantly more activated in the ADHD subjects than in the comparison subjects. This activation may reflect a compensatory recruitment of the right dorsal caudal part of the anterior cingulate in ADHD for decision making, or it may reflect a primary faulty engagement of this region, which prevents the expected neural circuits from assuming their function. Supporting the latter hypothesis is the negative correlation of this exact regional activation with performance in the comparison group, suggesting that its activation may disrupt the process of decision making in healthy subjects.
The left insula is the other region that was significantly more activated in the comparison subjects than in the ADHD subjects. Greater activation in this region has also been shown to predict better performance in healthy subjects. The insula is a multimodal sensory integration region that contributes to the integration of sensory events with emotional responses (38), and it has been shown to be recruited during negative mood states (39). Its reduced involvement in decision making in ADHD subjects concurs with the relatively weaker autonomic response reported in ADHD youths in both nonspecific skin conductance responses (40) and skin conductance responses in the context of reward paradigms (41). Overall, this interpretation of findings is consistent with ADHD subjects’ having deficits in attributing motivational value to stimuli, resulting in lower motivation and less willingness to exert effort to attain goals, both of which characterize ADHD behavior.
The lack of a difference in performance on the decision-making task between ADHD and comparison subjects most likely reflects the small sample size. This task, however, has strong face validity, as it probes the specific cognitive processes, such as sensitivity and responses to contingent stimuli (1), that are clinically altered in ADHD individuals (2, 42). We recently found impaired performance on this task in a group of 33 adolescents with externalizing behavioral disorders, including ADHD, compared to 31 healthy adolescents (43).
Finally, the activation maps associated with the task included a number of regions that were not discussed in this work because they were not part of our a priori hypotheses. Of interest, however, is the greater involvement of primary somatosensory areas (Brodmann’s area 3, 42) in the ADHD subjects than in the comparison subjects. This difference may indicate that individuals with ADHD use primary processes more readily than complex processes (involving the hippocampus and insula) in decision making, preventing effective filtering of environmental stimuli for adaptive responses.
Two caveats should be mentioned. First, the functional abnormalities might be confounded with structural differences between the ADHD subjects and healthy subjects. Previous studies have reported size differences in various brain regions (44, 45). Second, the present findings are applicable only to adults with ADHD. Studies of children are needed for generalization of the findings to this age group.
Overall, the findings support the idea that deficits in reward systems may play an important role in the pathology of ADHD. A better understanding of the nature of these deficits can be applied to refine treatment strategies.
 |
 |
 |
 |
 |
 |
Presented in part at the 40th annual meeting of the American College of Neuropsychopharmacology, Waikaloa, Hawaii, Dec. 9–13, 2001. Received Aug. 13, 2002; revision received Dec. 7, 2002; accepted Dec. 13, 2002. From the Intramural Research Program, NIMH; the Intramural Research Program, National Institute on Drug Abuse, Baltimore; the Department of Neurology, Johns Hopkins University School of Medicine, Baltimore; and the Neuropsychiatric Institute, University of California at Los Angeles, Los Angeles, Calif. Address reprint requests to Dr. Ernst, MAP NIMH, 15K North Dr., Room 118, MSC 2670, Bethesda, MD 20892-2670; [email protected] (e-mail). Supported by grant DA-11426 from the National Institute on Drug Abuse (NIDA) to Dr. Bolla, the Johns Hopkins Bayview Medical Center–General Clinical Research Center grant RR-02719, and the NIDA Intramural Research Program. The authors thank the NIDA PET Center and Maria Mouratidis for assistance in conducting the study.

Figure 1. Decision-Making Task in a Study of Neural Substrates of Decision-Making Deficits in Adults With Attention Deficit Hyperactivity Disordera
aThe decision-making task consisted of a computerized gambling card game in which participants were instructed to pick 100 cards from any of four decks. Four decks of cards (decks A, B, C, and D) are presented (left panel). In this illustration, the subject picks a card from deck A and receives $100 (middle panel), and a $1,250 loss message is added in this particular case. Some cards are associated with a loss in addition to the immediate gain, and some are not. The decks differ along two dimensions: immediate gain and risk of penalties. Every gain card from decks A and B yields $100, and every gain card from decks C and D yields $50. A certain number of cards in each of the four decks also carry a penalty, in such a way that in decks A and B (disadvantageous decks) the accumulated penalties are larger than the accumulated gains and in decks C and D (advantageous decks) the accumulated penalties are smaller than the accumulated gains. Thus, continued choice from either deck C or D leads to a net gain ($250/10 cards), whereas continued choice from either deck A or B leads to a net loss (–$250/10 cards). The optimal strategy is to minimize the overall loss by avoiding the short-term appeal of decks A and B in favor of the slower, but ultimately positive, gain of decks C and D.

Figure 2. Brain Regions With Significant Increase in Cerebral Blood Flow During a Decision-Making Task in Healthy Comparison Subjects and Adults With Attention Deficit Hyperactivity Disorder (ADHD)a
aImages are statistical parametric mapping projections in the sagittal, coronal, and horizontal planes. The threshold for the voxel height was set at p=0.001. Displays are in neurological convention (right is right). Both the comparison group and the ADHD group showed activation of areas of ventral prefrontal cortex, insula, and dorsolateral prefrontal cortex, as predicted. In addition, the comparison group showed activation of the right anterior cingulate (Brodmann’s area 32) and left hippocampal gyrus. The ADHD group did not show activation of any other a priori regions of interest.

Figure 3. Brain Regions With a Significant Difference in Increase in Cerebral Blood Flow During a Decision-Making Task Between Healthy Comparison Subjects (N=12) and Adults With Attention Deficit Hyperactivity Disorder (ADHD) (N=10)a
aImages are in the coronal and sagittal planes. The threshold for the voxel height was set at p=0.001. Greater activation in the comparison group than in the ADHD group was found in the left hippocampus (Montreal Neurologic Institute coordinates: x=–26 mm, y=–28 mm, z=–16 mm) and the left insula (Montreal Neurologic Institute coordinates: x=–20 mm, y=26 mm, z=–2 mm). Greater activation in the ADHD group than in the comparison group was found in the right anterior cingulate (Montreal Neurologic Institute coordinates: x=4 mm, y=6 mm, z=36 mm).
1. Johansen EB, Aase H, Meyer A, Sagvolden T: Attention-deficit/hyperactivity disorder (ADHD) behaviour explained by dysfunctioning reinforcement and extinction processes. Behav Brain Res 2002; 130:37-45Crossref, Medline, Google Scholar
2. Kollins SH, Shapiro SK, Newland MC, Abramowitz A: Discriminative and participant-rated effects of methylphenidate in children diagnosed with attention deficit hyperactivity disorder (ADHD). Exp Clin Psychopharmacology (Berl) 1998; 6:375-389Crossref, Medline, Google Scholar
3. Carlson CL, Mann M, Alexander DK: Effects of reinforcement on the performance and motivation of ADHD children. Cogn Ther Res 2000; 24:87-98Crossref, Google Scholar
4. Cunningham SJ, Knights RM: The performance of hyperactive and normal boys under differing reward and punishment schedules. J Pediatr Psychol 1978; 3:195-201Crossref, Google Scholar
5. Firestone P, Douglas V: The effects of reward and punishment on reaction times and autonomic activity in hyperactive and normal children. J Abnorm Child Psychol 1975; 3:201-216Crossref, Medline, Google Scholar
6. Worland J: Effects of positive and negative feedback on behavior control in hyperactive and normal boys. J Abnorm Child Psychol 1976; 4:315-326Crossref, Medline, Google Scholar
7. Oosterlaan J, Sergeant JA: Effects of reward and response cost on response inhibition in AD/HD, disruptive, anxious, and normal children. J Abnorm Child Psychol 1998; 26:161-174Crossref, Medline, Google Scholar
8. Solanto MV: The effects of reinforcement and response-cost on a delayed response task in children with attention deficit hyperactivity disorder: a research note. J Child Psychol Psychiatry 1990; 31:803-808Crossref, Medline, Google Scholar
9. Tripp G, Alsop B: Sensitivity to reward frequency in boys with attention deficit hyperactivity disorder. J Clin Child Psychol 1999; 28:366-375Crossref, Medline, Google Scholar
10. Zametkin AJ, Ernst M: Problems in the management of attention-deficit-hyperactivity disorder. N Engl J Med 1999; 340:40-46Crossref, Medline, Google Scholar
11. Ernst M, Bolla K, Mouratidis M, Contoreggi C, Matochik JA, Kurian V, Cadet JL, Kimes AS, London ED: Decision-making in a risk-taking task: a PET study. Neuropsychopharmacology 2002; 26:682-691Crossref, Medline, Google Scholar
12. Elliott R, Rees G, Dolan RJ: Ventromedial prefrontal cortex mediates guessing. Neuropsychologia 1999; 37:403-411Crossref, Medline, Google Scholar
13. Rogers RD, Owen AM, Middleton HC, Williams EJ, Pickard JD, Sahakian BJ, Robbins TW: Choosing between small, likely rewards and large, unlikely rewards activates inferior and orbital prefrontal cortex. J Neurosci 1999; 19:9029-9038Crossref, Medline, Google Scholar
14. Elliott R, Friston KJ, Dolan RJ: Dissociable neural responses in human reward systems. J Neurosci 2000; 20:6159-6165Crossref, Medline, Google Scholar
15. Knutson B, Adams CM, Fong GW, Hommer D: Anticipation of increasing monetary reward selectively recruits nucleus accumbens. J Neurosci 2001; 21:RC159Google Scholar
16. Bussey TJ, Everitt BJ, Robbins TW: Dissociable effects of cingulate and medial frontal cortex lesions on stimulus-reward learning using a novel Pavlovian autoshaping procedure for the rat: implications for the neurobiology of emotion. Behav Neurosci 1997; 111:908-919Crossref, Medline, Google Scholar
17. Schultz W: The reward signal of midbrain dopamine neurons. News Physiol Sci 1999; 14:249-255Medline, Google Scholar
18. Bechara A, Damasio AR, Damasio H, Anderson SW: Insensitivity to future consequences following damage to human prefrontal cortex. Cognition 1994; 50:7-15Crossref, Medline, Google Scholar
19. Zachary RA, Paulson MJ, Gorsuch RL: Estimating WAIS IQ from the Shipley Institute of Living Scale using continuously adjusted age norms. J Clin Psychol 1985; 41:820-831Crossref, Medline, Google Scholar
20. Derogatis LR, Rickels K, Rock AF: The SCL-90 and the MMPI: a step in the validation of a new self-report scale. Br J Psychiatry 1976; 128:280-289Crossref, Medline, Google Scholar
21. Robins LN, Helzer JE, Croughan J, Ratcliff KS: The National Institute of Mental Health Diagnostic Interview Schedule: its history, characteristics, and validity. Arch Gen Psychiatry 1981; 38:381-389Crossref, Medline, Google Scholar
22. Wender PH, Reimherr FW, Wood DR: Attention deficit disorder (‘minimal brain dysfunction’) in adults: a replication study of diagnosis and drug treatment. Arch Gen Psychiatry 1981; 38:449-456Crossref, Medline, Google Scholar
23. Conners CK, Sitarenios G, Parker JD, Epstein JN: Revision and restandardization of the Conners Teacher Rating Scale (CTRS-R): factor structure, reliability, and criterion validity. J Abnorm Child Psychol 1998; 26:279-291Crossref, Medline, Google Scholar
24. Friston KJ, Holmes AP, Worsley KJ, Poline JB, Frith CD, Frackowiak RSJ: Statistical parametric maps in functional imaging: a general linear approach. Hum Brain Mapp 1995; 2:189-210Crossref, Google Scholar
25. Woods RP, Cherry SR, Mazziotta JC: Rapid automated algorithm for aligning and reslicing PET images. J Comput Assist Tomogr 1992; 16:620-633Crossref, Medline, Google Scholar
26. Holmes A, Friston K: Generalisability, random effects and population inference. Neuroimage 1998; 7:S754Google Scholar
27. Talairach J, Tournoux P: Co-Planar Stereotaxic Atlas of the Human Brain: Three-Dimensional Proportional System. New York, Thieme Medical, 1988Google Scholar
28. Jarrard LE: What does the hippocampus really do? Behav Brain Res 1995; 71:1-10Crossref, Medline, Google Scholar
29. Wall PM, Messier C: The hippocampal formation-orbitomedial prefrontal cortex circuit in the attentional control of active memory. Behav Brain Res 2001; 127:99-117Crossref, Medline, Google Scholar
30. Shapiro ML, Eichenbaum H: Hippocampus as a memory map: synaptic plasticity and memory encoding by hippocampal neurons. Hippocampus 1999; 9:365-384Crossref, Medline, Google Scholar
31. Maguire EA, Burgess N, Donnett JG, Frackowiak RS, Frith CD, O’Keefe J: Knowing where and getting there: a human navigation network. Science 1998; 280:921-924Crossref, Medline, Google Scholar
32. Groenewegen HJ, Uylings HB: The prefrontal cortex and the integration of sensory, limbic and autonomic information. Prog Brain Res 2000; 126:3-28Crossref, Medline, Google Scholar
33. Tulving E, Habib R, Nyberg L, Lepage M, McIntosh AR: Positron emission tomography correlations in and beyond medial temporal lobes. Hippocampus 1999; 9:71-82Crossref, Medline, Google Scholar
34. Bush G, Frazier JA, Rauch SL, Seidman LJ, Whalen PJ, Jenike MA, Rosen BR, Biederman J: Anterior cingulate cortex dysfunction in attention-deficit/hyperactivity disorder revealed by fMRI and the Counting Stroop. Biol Psychiatry 1999; 45:1542-1552Crossref, Medline, Google Scholar
35. Bush G, Luu P, Posner MI: Cognitive and emotional influences in anterior cingulate cortex. Trends Cogn Sci 2000; 4:215-222Crossref, Medline, Google Scholar
36. Vogt BA, Finch DM, Olson CR: Functional heterogeneity in cingulate cortex: the anterior executive and posterior evaluative regions. Cereb Cortex 1992; 2:435-443Medline, Google Scholar
37. Devinsky O, Morrell MJ, Vogt BA: Contributions of anterior cingulate cortex to behaviour. Brain 1995; 118:279-306Crossref, Medline, Google Scholar
38. Mesulam MM, Mufson EJ: Insula of the old world monkey, III: efferent cortical output and comments on function. J Comp Neurol 1982; 212:38-52Crossref, Medline, Google Scholar
39. Mayberg HS, Liotti M, Brannan SK, McGinnis S, Mahurin RK, Jerabek PA, Silva JA, Tekell JL, Martin CC, Lancaster JL, Fox PT: Reciprocal limbic-cortical function and negative mood: converging PET findings in depression and normal sadness. Am J Psychiatry 1999; 156:675-682Abstract, Google Scholar
40. Lazzaro I, Gordon E, Li W, Lim CL, Plahn M, Whitmont S, Clarke S, Barry RJ, Dosen A, Meares R: Simultaneous EEG and EDA measures in adolescent attention deficit hyperactivity disorder. Int J Psychophysiol 1999; 34:123-134Crossref, Medline, Google Scholar
41. Iaboni F, Douglas VI, Ditto B: Psychophysiological response of ADHD children to reward and extinction. Psychophysiology 1997; 34:116-123Crossref, Medline, Google Scholar
42. Tripp G, Alsop B: Sensitivity to reward delay in children with attention deficit hyperactivity disorder (ADHD). J Child Psychol Psychiatry 2001; 42:691-698Crossref, Medline, Google Scholar
43. Ernst M, Grant SJ, London ED, Contoreggi CS, Kimes AS, Spurgeon L: Decision making in adolescents with behavior disorders and adults with substance abuse. Am J Psychiatry 2003; 160:33-40Link, Google Scholar
44. Overmeyer S, Bullmore ET, Suckling J, Simmons A, Williams SC, Santosh PJ, Taylor E: Distributed grey and white matter deficits in hyperkinetic disorder: MRI evidence for anatomical abnormality in an attentional network. Psychol Med 2001; 31:1425-1435Crossref, Medline, Google Scholar
45. Castellanos FX, Lee PP, Sharp W, Jeffries NO, Greenstein DK, Clasen LS, Blumenthal JD, James RS, Ebens CL, Walter JM, Zijdenbos A, Evans AC, Giedd JN, Rapoport JL: Developmental trajectories of brain volume abnormalities in children and adolescents with attention-deficit/hyperactivity disorder. JAMA 2002; 288:1740-1748Crossref, Medline, Google Scholar