High Choline Concentrations in the Caudate Nucleus in Antipsychotic-Naive Patients With Schizophrenia
Abstract
OBJECTIVE: Proton magnetic resonance spectroscopy (1H-MRS) studies of medicated patients with schizophrenia suggest high choline levels in the caudate nucleus. However, assessments of antipsychotic-naive patients are needed. METHOD: The authors studied 11 antipsychotic-naive schizophrenia patients and 11 normal comparison subjects with single-voxel 1H-MRS of the left caudate nucleus. Concentrations of N-acetylaspartate, choline, and creatine were determined and corrected for the proportion of cerebrospinal fluid in the voxel. RESULTS: The patients with schizophrenia had significantly higher levels of choline than the comparison subjects, while the other two metabolites did not differ between groups. CONCLUSIONS: High caudate choline levels in schizophrenia are not secondary to antipsychotic treatment.
Abnormalities of the caudate nucleus have been identified in schizophrenia—some related to treatment with antipsychotic medications and some presumably related to the disease itself. Low volume of the caudate nuclei has been observed in antipsychotic-naive patients (1–3), and the volume increases after treatment with typical antipsychotic medications (4). Lower than normal glucose metabolism in the caudate nuclei has also been observed in antipsychotic-naive (5) and antipsychotic-free (6–9) patients with schizophrenia and has been shown to increase after treatment with typical antipsychotics (10).
Proton magnetic resonance spectroscopy (1H-MRS) allows the assessment of neurometabolites, such as N-acetylaspartate, choline, and creatine, in vivo and has been used to study schizophrenia. N-Acetylaspartate is considered a marker of neuronal integrity (11), choline is involved in lipid membrane turnover and is high in inflammatory processes (12, 13), and creatine is involved in energy metabolism. 1H-MRS investigations of the caudate nucleus in schizophrenia have been few. Two studies (14, 15) have indicated high choline levels in the left caudate of chronically ill, medicated patients with schizophrenia.
Since we knew of no 1H-MRS studies of the caudate in antipsychotic-naive patients, we assessed a group of such patients and compared them to healthy subjects. We hypothesized that choline concentrations in the caudate nucleus would be higher in the schizophrenia group.
Method
Patients were recruited from the Mental Health Center at the University of New Mexico. The inclusion criteria were 1) a DSM-IV diagnosis of schizophrenia made with the Structured Clinical Interview for DSM-IV Patient Version (16) and 2) no history of treatment with an antipsychotic medication. The exclusion criteria were a diagnosis of neurological disorder, mental retardation, a history of severe head trauma, or unremitted substance use disorder (in remission for less than 6 months). Comparison subjects were excluded if they had 1) any DSM-IV axis I disorder, determined by the Structured Clinical Interview for DSM-IV Non-Patient Version (17), 2) a first-degree relative with schizophrenia or other psychotic disorder, or 3) a history of neurological disorder. All subjects gave written informed consent before entering the study and were paid for their participation. The study was approved by the local institutional review board.
The studies were completed in a 1.5-T magnetic resonance imager (Signa, GE Medical Systems, Waukesha, Wis.). The spectroscopic acquisition protocol used a spin-echo pulse sequence (TE=40 msec, TR=2000 msec, 128 averages). Spectroscopic voxels (6 cm3) were centered in the head of the left caudate nucleus to maximize gray matter by using a T1-weighted axial series (1.5-mm contiguous slices). A T2-weighted coronal series (TE=30/100 msec, TR=2800 msec, 3-mm thickness, 1-mm gap) extending from the genu to the splenium of the corpus callosum was also completed.
Concentrations of each metabolite were calculated by using the internal water signal as reference and correcting for metabolite and water T1 and T2 effects during the pulse sequence according to values in the literature (18). All data were processed by using automated routines by one operator blinded to subject group (L.M.R.). Using these procedures, we have documented good test-retest reliability for N-acetylaspartate, creatine, and choline (18).
Caudate volumes were determined from the coronal T2 series by using automated k-means segmentation, described previously (19). After segmentation the caudate was identified in each slice by a trained reader (L.M.R.), and the number of pixels was recorded. Interrater reliability, as indicated by the intraclass correlation coefficient (ICC), for two trained readers (including L.M.R.) who traced and measured the caudate nucleus in 10 subjects was ICC=0.95.
The percentage of each type of tissue (CSF, gray matter, and white matter) within each spectroscopic voxel was calculated by creating a mask corresponding to each voxel and superimposing this mask on the segmented images. Volumes were obtained for each tissue type within each spectroscopic voxel. The spectroscopic values were then corrected for CSF fraction within the voxel on the basis of the assumption that CSF has N-acetylaspartate, creatine, and choline concentrations of zero.
Uncorrected and CSF-corrected caudate concentrations of N-acetylaspartate, choline, and creatine in millimoles per liter were analyzed with Bonferroni-corrected independent t tests with alpha set at 0.0167, two-tailed.
Results
Thirteen patients and 12 comparison subjects completed the study. The schizophrenia subjects were mostly outpatients with less acute illness. Two patients and one comparison subject had poor spectra because of movement and were excluded from the analyses. There were no significant differences between the comparison and patient groups in age (mean=32.5 years, SD=8.1, versus mean=26.0 years, SD=9.2), sex distribution (male/female: 8/3 versus 10/1), handedness (right/left: 9/2 versus 11/0), or ethnicity (Hispanic/white/other: 2/7/0 versus 4/6/1), respectively. According to the Hollingshead and Redlich rating system, the comparison group had higher socioeconomic status than the patient group (mean=2.6, SD=1.0, versus mean=4.7, SD=0.5; lower rating indicates higher status) (t=6.2, df=18, p<0.01). The patient group contained more subjects with a history of past substance use disorder than the comparison group (yes/no: 5/6 versus 0/11) (χ2=6.5, df=1, p<0.05). The patients exhibited moderate to severe levels of psychopathology: their mean score on the positive symptom scale of the Positive and Negative Syndrome Scale (20) was 17.9 (SD=5.8), and their mean score on the negative symptom scale was 22.4 (SD=7.3).
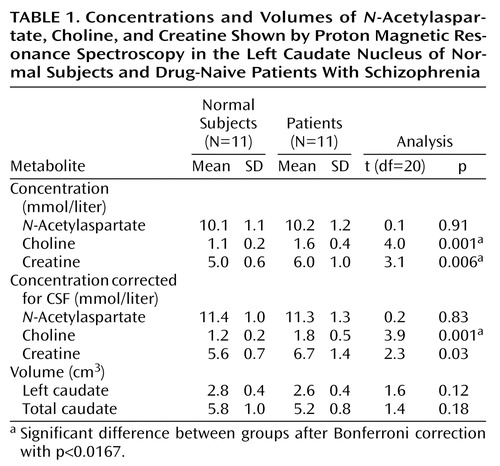
Caudate metabolite concentrations and volumes and statistics are presented in Table 1. The choline concentration was higher in the patient group for both uncorrected values and CSF-corrected values. Creatine levels were also higher in the patient group for CSF-uncorrected values, but this difference was not statistically significant after CSF correction. N-Acetylaspartate values and caudate volumes did not significantly differ between groups. Choline levels were not correlated with socioeconomic status (Spearman’s r=0.39, df=20, p>0.05), nor did they differ between the schizophrenia patients with and without a history of substance use (t=1.9, df=9, p>0.05). Demographic and clinical measures were not correlated with the neurometabolites.
Discussion
To our knowledge, this is the first 1H-MRS examination of the caudate nucleus in antipsychotic-naive persons with schizophrenia. We found higher concentrations of choline in the left caudate nucleus of patients than in comparison subjects. We corrected for CSF in the spectroscopic voxel because patients with schizophrenia have larger CSF spaces (21), and CSF has a minimal contribution to the metabolite spectroscopic signal.
Our findings are consistent with results of the two 1H-MRS studies that have evaluated the left caudate in chronically ill, medicated schizophrenia patients. High choline levels were shown in both studies by using voxel sizes and locations comparable to those in our study. Shiori et al. (14) and Fujimoto et al. (15) reported 15% and 9% higher than normal levels, respectively, compared to a 33% higher choline level in the present study. The four studies that evaluated the putamen failed to show metabolite abnormalities in chronically ill, medicated (22–24) or unmedicated (25) patients with schizophrenia.
Caudate volumes of antipsychotic-naive patients with schizophrenia have been shown to be smaller than those in healthy subjects (1–3). Although the difference in our study was not statistically significant, we did find smaller caudate volumes in our patients than in normal subjects, with an effect size (d=0.67) comparable to those in previous studies (2, 3).
This study has several limitations. The study group was small, and the spectroscopic voxel was relatively large and included noncaudate tissue. We minimized this latter limitation by correcting for CSF proportion and by covarying for white matter volume in the voxel—the result remained significant (F=13.8, df=1, 19, p=0.001). However, this partial volume effect most likely dilutes the potential contribution of the caudate to the observed neurochemical differences. Also, we examined only the left caudate because of time constraints and subject tolerance. Although findings from volumetric studies of antipsychotic-naive patients are consistent with mostly bilateral abnormalities (1–3), greater metabolic differences with [18F]fluorodeoxyglucose (FDG) positron emission tomography (PET) have been found in the left caudate (5). Therefore, bilateral 1H-MRS examinations of the caudate are necessary. Finally, the cross-sectional nature of the study allows only tentative inferences of causality.
High concentrations of choline could reflect abnormalities in phospholipid membrane formation, slow glucose metabolism, or greater than normal acetylcholine neurotransmission. It is unlikely that our findings reflect excess acetylcholine neurotransmission, since acetylcholine contributes little to the choline spectroscopic peak (26). Glucose metabolism, as detected with FDG PET, has been shown to inversely relate to choline concentration (27), and FDG PET studies have shown low metabolic rates in the caudate of antipsychotic-naive patients with schizophrenia (5). Also, postmortem findings of low mitochondrial density in the caudate astroglia of schizophrenia patients have been reported (28). Hence, we speculate that high caudate choline levels may reflect slow metabolism, predominantly in the astroglia. Finally, a dysfunction in neuronal phospholipid membrane formation, as described by Pettegrew et al. (29) in schizophrenia, could be manifested in high levels of choline.
In summary, these preliminary results suggest neurochemical caudate abnormalities in schizophrenia independent of medication effects.
 |
Received April 4, 2001; revision received July 10, 2001; accepted July 18, 2001. From the Departments of Psychiatry, Psychology, Radiology, and Neurosciences and the Clinical and Magnetic Resonance Research Center, University of New Mexico School of Medicine. Address reprint requests to Dr. Bustillo, Research Division, Department of Psychiatry, University of New Mexico, 2400 Tucker N.E., Albuquerque, NM 87131; [email protected] (e-mail). Supported by a Young Investigator Award from the National Alliance for Research in Schizophrenia and Depression to Dr. Bustillo and by National Foundation for Functional Brain Imaging grant DE-FG03-99ER62764/A002 to Dr. Bustillo. The authors thank Elma Landgraf, Mia Touchet, Christina Wolff, and Mariebeth Velasquez for their contributions to this study.
1. Corson PW, Nopoulos P, Andreasen NC, Heckel D, Arndt S: Caudate size in first-episode neuroleptic-naive schizophrenic patients measured using an artificial neural network. Biol Psychiatry 1999; 46:712-720Crossref, Medline, Google Scholar
2. Keshavan MS, Rosenberg D, Sweeney JA, Pettegrew JW: Decreased caudate volume in neuroleptic-naive psychotic patients. Am J Psychiatry 1998; 155:774-778Abstract, Google Scholar
3. Shihabuddin L, Buchsbaum MS, Hazlett EA, Haznedar MM, Harvey PD, Newman A, Schnur DB, Spiegel-Cohen J, Wei T, Machac J, Knesaurek K, Vallabhajosula S, Biren MA, Ciaravolo TM, Luu-Hsia C: Dorsal striatal size, shape, and metabolic rate in never-medicated and previously medicated schizophrenics performing a verbal learning task. Arch Gen Psychiatry 1998; 55:235-243Crossref, Medline, Google Scholar
4. Chakos MH, Lieberman JA, Bilder RM, Borenstein M, Lerner G, Bogerts B, Wu H, Kinon B, Ashtari M: Increase in caudate nuclei volumes of first-episode schizophrenic patients taking antipsychotic drugs. Am J Psychiatry 1994; 151:1430-1436Link, Google Scholar
5. Buchsbaum MS, Haier RJ, Potkin SG, Nuechterlein K, Bracha HS, Katz M, Lohr J, Wu J, Lottenberg S, Jerabek PA: Frontostriatal disorder of cerebral metabolism in never-medicated schizophrenics. Arch Gen Psychiatry 1992; 49:935-942Crossref, Medline, Google Scholar
6. Buchsbaum MS, Wu JC, DeLisi LE, Holcomb HH, Hazlett E, Cooper-Langston K, Kessler R: Positron emission tomography studies of basal ganglia and somatosensory cortex neuroleptic drug effects: differences between normal controls and schizophrenic patients: Biol Psychiatry 1987; 22:479-494Google Scholar
7. Resnick SM, Gur RE, Alavi A, Gur RC, Reivich M: Positron emission tomography and subcortical glucose metabolism in schizophrenia. Psychiatry Res 1988; 24:1-11Crossref, Medline, Google Scholar
8. Siegel BV Jr, Buchsbaum MS, Bunney WE Jr, Gottschalk LA, Haier RJ, Lohr JB, Lottenberg S, Najafi A, Nuechterlein KH, Potkin SG: Cortico-striatal-thalamic circuits and brain glucose metabolic activity in 70 unmedicated male schizophrenic patients. Am J Psychiatry 1993; 150:1325-1336Link, Google Scholar
9. Wiesel FA, Wik G, Sjogren I, Blomqvist G, Greitz T, Stone-Elander S: Regional brain glucose metabolism in drug free schizophrenic patients and clinical correlates. Acta Psychiatr Scand 1987; 76:628-641Crossref, Medline, Google Scholar
10. Buchsbaum MS, Potkin SG, Siegel BV Jr, Lohr J, Katz M, Gottschalk LA, Gulasekaram B, Marshall JF, Lottenberg S, Teng CY, Abel L, Plon L, Bunney WE Jr: Striatal metabolic rate and clinical response to neuroleptics in schizophrenia. Arch Gen Psychiatry 1992; 49:966-974Crossref, Medline, Google Scholar
11. Dautry C, Vaufrey F, Brouillet E, Bizat N, Henry PG, Conde F, Bloch G, Hantraye P: Early N-acetylaspartate depletion is a marker of neuronal dysfunction in rats and primates chronically treated with the mitochondrial toxin 3-nitropropionic acid. J Cereb Blood Flow Metab 2000; 20:789-799Crossref, Medline, Google Scholar
12. Simone IL, Tortorella C, Federico F: The contribution of (1)H-magnetic resonance spectroscopy in defining the pathophysiology of multiple sclerosis. Ital J Neurol Sci 1999; 20(5 suppl):S241-S245Google Scholar
13. Friedman SD, Stidley CA, Brooks WM, Hart BL, Sibbitt WL Jr: Brain injury and neurometabolic abnormalities in systemic lupus erythematosus. Radiology 1998; 209:79-84Crossref, Medline, Google Scholar
14. Shiori T, Hamakawa H, Kato T, Murashita J, Fujii K, Inubushi T, Takahashi S: Proton magnetic resonance spectroscopy of the basal ganglia in patients with schizophrenia: a preliminary report. Schizophr Res 1996; 22:19-26Crossref, Medline, Google Scholar
15. Fujimoto T, Nakano T, Takano T, Takeuchi K, Yamada K, Fukuzako T, Akimoto H: Proton magnetic resonance spectroscopy of basal ganglia in chronic schizophrenia. Biol Psychiatry 1996; 40:14-18Crossref, Medline, Google Scholar
16. First MB, Spitzer RL, Gibbon M, Williams JBW: Structured Clinical Interview for DSM-IV Axis I Disorders, Patient Edition (SCID-P), version 2. New York, New York State Psychiatric Institute, Biometrics Research, 1995Google Scholar
17. First MB, Spitzer RL, Gibbon M, Williams JB: Structured Clinical Interview for DSM-IV Axis I Disorders—Non-Patient Edition (SCID-I/NP), version 2.0. New York, New York State Psychiatric Institute, Biometrics Research, 1996 Google Scholar
18. Brooks WM, Friedman SD, Stidley CA: Reproducibility of 1H-MRS in vivo. Magn Res Med 1999; 40:193-197Crossref, Google Scholar
19. Petropoulos H, Brooks WM, Sibbitt WL Jr: Automated T2 quantitation in neuropsychiatric lupus erythematosus: a marker of active disease. J Magn Reson Imaging 1999; 9:39-43Crossref, Medline, Google Scholar
20. Kay SR, Fiszbein A, Opler LA: The Positive and Negative Syndrome Scale (PANSS) for schizophrenia. Schizophr Bull 1987; 13:261-276Crossref, Medline, Google Scholar
21. Woods BT: Is schizophrenia a progressive neurodevelopmental disorder? toward a unitary pathogenetic mechanism. Am J Psychiatry 1998; 155:1661-1670Link, Google Scholar
22. Heimberg C, Komoroski RA, Lawson WB, Cardwell D, Karson CN: Regional proton magnetic resonance spectroscopy in schizophrenia and exploration of drug effect. Psychiatry Res 1998; 83:105-115Crossref, Medline, Google Scholar
23. Ohara K, Isoda H, Suzuki Y, Takehara Y, Ochiai M, Takeda H, Hattori K, Igarashi Y, Ohara K: Proton magnetic resonance spectroscopy of lenticular nuclei in simple schizophrenia. Prog Neuropsychopharmacol Biol Psychiatry 2000; 24:507-519Crossref, Medline, Google Scholar
24. Bertolino A, Nawroz S, Mattay VS, Barnett AS, Duyn JH, Moonen CTW, Frank JA, Tedeschi G, Weinberger DR: Regionally specific pattern of neurochemical pathology in schizophrenia as assessed by multislice proton magnetic resonance spectroscopic imaging. Am J Psychiatry 1996; 153:1554-1563Link, Google Scholar
25. Bertolino A, Callicott JH, Elman I, Mattay VS, Tedeschi G, Frank JA, Breier A, Weinberger DR: Regionally specific neuronal pathology in untreated patients with schizophrenia: a proton magnetic resonance spectroscopic imaging study. Biol Psychiatry 1998; 43:641-648Crossref, Medline, Google Scholar
26. Bluml S, Seymour KJ, Ross BD: Developmental changes in choline- and ethanolamine-containing compounds measured with proton-decoupled 31P MRS in in vivo human brain. Magn Reson Med 1999; 42:643-654Crossref, Medline, Google Scholar
27. Duc CO, Weber AH, Trabesinger AH, Meier D, Boesiger P: Recycling the cholines, in Proceedings of the Fifth Meeting of the International Society for Magnetic Resonance in Medicine. Berkeley, Calif, ISMRM, 1997, p 1210Google Scholar
28. Uranova NA, Casanova MF, DeVaughn NM, Orlovskaya DD, Denisov DV: Ultrastructural alterations of synaptic contacts and astrocytes in postmortem caudate nucleus of schizophrenic patients. Schizophr Res 1996; 22:81-83Crossref, Medline, Google Scholar
29. Pettegrew JW, Keshavan M, Panchalingam K, Strychor S, Kaplan D, Tretta M, Allen M: Alterations in brain high-energy metabolism in first-episode, drug-naive schizophrenics. Arch Gen Psychiatry 1991; 48:563-568Crossref, Medline, Google Scholar