Evidence for a Locus on Chromosome 1 That Influences Vulnerability to Alcoholism and Affective Disorder
Abstract
OBJECTIVE: Depression (major depression or depressive syndrome) is more prevalent in alcoholic than in nonalcoholic subjects in families with multiple members with alcoholism studied as part of the Collaborative Study on the Genetics of Alcoholism (National Institute on Alcohol Abuse and Alcoholism). First-degree relatives of probands with comorbid alcoholism and depression have a higher prevalence of both disorders than relatives of probands with alcoholism alone, and both groups have a higher prevalence than the relatives of comparison subjects selected without regard to psychopathology. Data from the collaborative study were used to test three phenotypes (comorbid alcoholism and depression, alcoholism or depression, and depression) for genetic linkage. METHOD: Genome-wide sibling-pair linkage analyses were performed with the phenotypes comorbid alcoholism and depression, alcoholism or depression, and depression (major depression or depressive syndrome). Analyses were performed in two data sets (initial and replication data sets) from subject groups ascertained with identical criteria, as well as in the combined data set. RESULTS: Peak lod scores on chromosome 1 (near 120 centimorgan) for the alcoholism or depression phenotype were 5.12, 1.52, and 4.66 in the initial, replication, and combined data sets, respectively. The corresponding lod scores on chromosome 2 were 2.79, 0.20, and 3.26; on chromosome 6, they were 3.39, 0.00, and 0.92; and on chromosome 16, they were 3.13, 0.00, and 2.06. Lod scores on chromosome 2 for the comorbid alcoholism and depression phenotype in the three data sets were 0.00, 4.12, and 2.16, respectively. CONCLUSIONS: The results suggest that a gene or genes on chromosome 1 may predispose some individuals to alcoholism and others to depression (which may be alcohol induced). Loci on other chromosomes may also be of interest.
It has long been known that a direct connection exists between alcohol and mood. Alcoholic intoxication produces a “high” with attendant giddiness and a lowering of inhibitions. Hangovers and acute withdrawal produce dysphoria, with elements of anxiety and depression mixed with physical malaise. Studies of psychopathology have long observed the interaction among clinical syndromes, with clear evidence of comorbidity and a somewhat more complex interaction with familial vulnerability (1, 2).
The prevalence of alcoholism is greater in men than that in women by a factor of 3–6, depending on the definition of alcoholism used in the analyses (3, 4). The prevalence of depression is greater in women than men by a factor of 2–3 (5).
In data from the National Institute of Mental Health (NIMH) Genetics Initiative, among families with multiple members with bipolar disorder, male subjects with major affective disorder had a risk for alcoholism nearly twofold that of male subjects without affective disorder (unpublished 1996 manuscript of Nurnberger et al.). Among female subjects with major affective disorder in those families, the risk for alcoholism was sevenfold that of female subjects without affective disorder. Family studies of bipolar disorder have generally shown that the rate of alcoholism is not greater than the population rate in relatives of probands with bipolar disorder alone but is greater than the population rate in relatives of probands with comorbid bipolar disorder and alcoholism (6). In a study of the two syndromes in female twins, Kendler et al. (7) showed a genetic correlation of 0.4–0.6 between major depression and alcoholism.
In the 1970s, Winokur et al. (8) postulated a division of depressive illness into four types, depending on the familial pattern of the illness. Sporadic depressive disorder was nonfamilial; pure depressive disorder was found in families that included members with depression but no alcoholism or sociopathy; depressive-spectrum disorder was found in families in which the depressed probands had relatives with alcoholism or sociopathy; and depression in families that included members with bipolar illness was thought to be a bipolar variant. Various clinical distinctions were noted among the proband types. Perhaps the most impressive data were gathered by Schlesser et al. (9), who found that probands with pure depressive disorder were more likely to fail to suppress cortisol in dexamethasone suppression tests, compared with probands with depressive-spectrum disorder or sporadic depressive disorder. These findings were replicated by the same group in a second data set (10), although a smaller study by another group did not confirm the findings (11).
The possible relationships between alcoholism and affective disorder in families are complex and have been discussed elsewhere (1, 12). It seems likely that both syndromes are heterogeneous and that comorbid conditions are heterogeneous as well. At this point it is difficult to identify subtypes on the basis of clinical criteria alone. Genetic studies may help with this endeavor.
For the last 10 years, investigators at six sites within the Collaborative Study of the Genetics of Alcoholism (Hartford, Conn., Indianapolis, Iowa City, New York, San Diego, and St. Louis) have used a common protocol to gather clinical information and biologic data (including DNA and neurophysiologic event-related potentials) from families with multiple members with alcoholism. A genomic survey that used data from the first 105 families in the study (including 987 subjects) identified regions on chromosomes 1, 2, and 7 that appear to contain genes affecting risk for alcoholism and a possible modifying or protective locus on chromosome 4 (4). Initial analyses of data from a second set of subjects ascertained with identical criteria have also been completed (13).
Structured diagnostic assessments were completed for all subjects who were interviewed, allowing evaluation of affective disorder in patients and relatives. Familial relationships were examined and are reported here. Linkage analyses were also performed to investigate the molecular genetics of comorbid alcoholism and depression. Chromosomal regions linked to the phenotypes of comorbid alcoholism and depression, alcoholism or depression, and depression were identified. Linkage results for the phenotype of alcoholism alone are reported separately (4, 13). A summary of familial relationships between alcoholism and major depression in a subset of this data are reported elsewhere (14).
Method
As part of the Collaborative Study of the Genetics of Alcoholism, sequential admissions from alcohol treatment facilities were systematically screened to identify probands who met the DSM-III-R criteria for alcohol dependence and the Feighner criteria for alcoholism (15). Probands were required to be age 18 or older and English speaking; to be without head injury, intravenous drug use, or life-threatening disease; and to have relatives who were available for assessment. Suitable probands were interviewed with the Semi-Structured Assessment for the Genetics of Alcoholism (16), as were all available first-degree relatives. After this family study procedure, a subset of families with two additional alcoholic members besides the proband were invited to participate in a second stage of assessment, which included blood collection for DNA extraction. Written informed consent was obtained from each subject after the procedures were fully explained. Diagnoses reported here were made by algorithm-based scoring of the Semi-Structured Assessment for the Genetics of Alcoholism, and the analyses include data for only those relatives who were personally interviewed by the study team.
Comparison families were ascertained from dental clinics, motor vehicle records, or random mailings at the six sites. Each comparison family was required to include two parents and at least three children over age 14. Comparison probands were not excluded for alcoholism or other psychiatric disorders in themselves or family members. Thus, these families represent a comparison group selected without regard to psychopathology.
A genomic survey, as described by Reich et al. (4), was carried out in two laboratories (Indiana University [H.E.] and Washington University at St. Louis [A.G.]). Subsequently, additional markers were genotyped in chromosomal regions linked to the phenotypes of interest. We report here data from a total of 336 markers with an average intermarker distance of 10.5 centimorgan (cM). The two-stage genome screen was carried out first in 987 individuals from 105 families (the initial data set) and then in a separate group of 1,295 individuals from 157 families (the replication data set). All families included in the genomic survey were from the selected group with three or more members with alcoholism. Most markers were tri- or tetranucleotide repeat polymorphisms. These markers were highly informative, with an average heterozygosity of 0.72.
Probands in the initial family data set are typical of probands in the entire data set. The lifetime prevalence of nonalcohol substance dependence (excluding marijuana dependence) was 49.5% (N=52), and the prevalence of antisocial personality disorder was 16.2% (N=17). In the entire group of 8,264 interviewed subjects (probands and relatives), 53.4% (N=4,413) were female; the mean age for participating relatives was 43 years (SD=17). A total of 17.3% of the interviewees were African American (N=1,430), and 5.9% were Hispanic (N=488).
Genotypic data were stored in the GeneMaster database management system (developed by John Rice, Washington University at St. Louis) and checked for Mendelian inheritance of marker alleles with the programs CRIMAP (17) and the USERM13 option of the MENDEL suite of linkage programs (18). Maximum likelihood estimates of marker allele frequencies were obtained by using the USERM13 program. Marker order and distance were estimated by CRIMAP and by comparison to published maps.
We defined alcoholism as the presence of DSM-III-R alcohol dependence and alcoholism as defined by the Feighner criteria (15). We defined depression as the presence of either DSM-III-R major depression or depressive syndrome (a depressive condition meeting all criteria for major depression except for the exclusion of organic factors in initiating and maintaining the disorder). Individuals with both alcoholism and depression were included in the phenotype “comorbid alcoholism and depression.” Individuals with either alcoholism or depression were included in the phenotype “alcoholism or depression.” Individuals with depression with or without alcoholism were included in the phenotype “depression,” which was examined in a separate analysis.
Statistical testing for differences in prevalence of disorders between groups was performed with the chi-square test. Odds ratio and 95% confidence intervals (CIs) were calculated where appropriate. These results were calculated by using data from all families ascertained through an alcoholic proband and from comparison families where appropriate.
For genetic linkage analysis, we employed nonparametric methods that did not rely on the specification of a model of susceptibility for the phenotype. Instead, all statistical tests were based on the sharing of marker alleles that were identical by descent. An allele is considered to be identical by descent if both members of a sibling pair have inherited the marker allele from the same parent. If the marker being tested is physically close to a gene influencing alcohol dependence, then affected siblings are more likely to share the chromosomal region near the susceptibility locus than to share a random chromosomal region and, consequently, are more likely to share alleles at markers in this region. Nonparametric linkage methods test whether the observed sharing of marker alleles in affected pairs is greater than 50%, the expected proportion of alleles that would be identical by descent if no linkage exists. A significantly greater sharing of marker alleles supports the linkage of a susceptibility locus to the marker being tested.
Only families with an affected proband and two affected first-degree relatives were included in linkage analysis. The multigenerational pedigrees were divided into nuclear families. An individual could appear as a parent in one nuclear family and as a sibling in another; however, no individual appeared in the same role in more than one nuclear family, and no sibship was redundant. The ASPEX set of analysis programs (19), which evaluates multiple markers simultaneously for evidence of linkage, was employed to conduct multipoint linkage analysis. To provide the most accurate estimates of identical-by-descent allele sharing, we did initial analyses with the ASPEX sib_ibd program using data from only those affected sibling pairs whose parents had both been genotyped. To utilize more information in the data set, a confirmatory analysis was performed with the ASPEX sib_phase program, which uses data from all affected sibling pairs regardless of parental genotyping. In this analysis, identical-by-descent allele sharing was inferred on the basis of marker genotyping in the sibship as well as population allele frequencies. We performed analyses using data for all possible pairs of affected siblings (N[N–1]/2, where N is the number of affected siblings in a sibship) as well as for independent pairs only (N–1).
Results
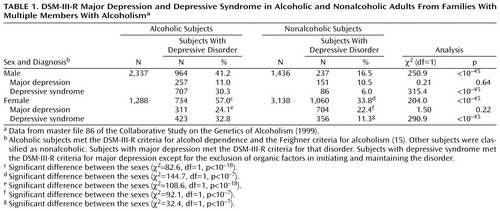
Table 1 shows the frequencies of major depression and depressive syndrome in subjects participating in the Collaborative Study on the Genetics of Alcoholism. It is interesting to note that among both male and female subjects, the likelihood of major depression was no higher for alcoholic than for nonalcoholic subjects. On the other hand, depressive syndrome was significantly more common in alcoholic subjects than in nonalcoholic subjects among both male and female subjects. Thus, the chances of phenotypic depression were greater in alcoholic male subjects (odds ratio=3.6, 95% CI=3.0–4.2) and in alcoholic female subjects (odds ratio=2.6, 95% CI=2.3–3.0).
The combination of alcoholism and depression appears to run in families. Analysis of data for first-degree relatives of singly ascertained probands with alcoholism (with or without comorbid depression) and first-degree relatives of comparison subjects (data from master file 96 of the Collaborative Study on the Genetics of Alcoholism) revealed a 15.9% prevalence of comorbid alcoholism and depression in the relatives of probands with comorbid alcoholism and depression (N=489 of 3,069), compared to an 11.7% prevalence in the relatives of probands with alcoholism alone (N=287 of 2,462) and a 3.6% prevalence in the relatives of comparison subjects (N=42 of 1,164) (χ2=120.7, df=2, p<0.0001). The prevalence of comorbid alcoholism and depression was higher in the relatives of probands with the comorbid disorders than in the relatives of probands with alcoholism alone (χ2=20.7, df=1, p<0.0001; odds ratio=1.44, 95% CI=1.23–1.68).
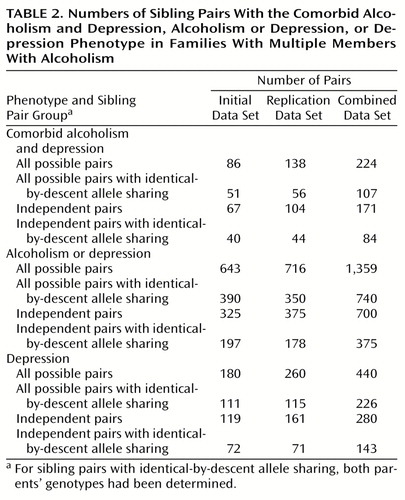
Since these data suggested some interaction of vulnerability factors, we performed nonparametric linkage analysis for sibling pairs to identify chromosomal regions linked to the three phenotypes of comorbid alcoholism and depression, alcoholism or depression, and depression. Data set sizes for each phenotype are detailed in Table 2. The comorbid alcoholism and depression phenotype may be thought of as the intersection of the alcoholism and depression data sets. The alcoholism or depression phenotype is the most inclusive, because it encompasses siblings with alcoholism only and depression only as well as siblings with both alcoholism and depression. The majority of the subjects with the comorbid alcoholism and depression phenotype were male (N=135 of 235, 57.4%), as were the majority of the subjects with the alcoholism or depression phenotype (N=334 of 604, 55.3%). The majority of the subjects with the depression phenotype were female (N=172 of 329, 52.3%). It is noteworthy that the majority of sibling pairs added to the analysis because they met criteria for the alcoholism or depression phenotype consisted of an alcoholic brother and a depressed sister (N=205 of all 394 possible added pairs, 52.0%; N=205 of all 242 possible added mixed-gender pairs, 84.7%).
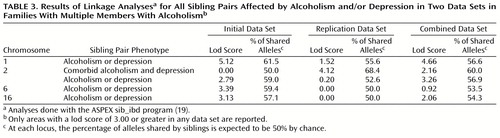
Multipoint nonparametric sibling pair linkage analyses were performed for each phenotype in the initial data set to detect regions of linkage. We performed an ASPEX sib_ibd analysis using data for all possible pairs of affected siblings. The highest lod score (logarithm of the odds ratio for linkage) (lod=5.12) was found on chromosome 1 near the markers D1S1648 and D1S1588 for the alcoholism or depression phenotype (Table 3). Maximum allele sharing among affected sibling pairs in this region was 61.5%. Allele sharing scores were consistent when the data for only independent pairs of affected siblings were included in the analysis (Table 4). The replication data set also showed a high rate of allele sharing (55.6%), although the lod score in this analysis was lower than in the initial data set (lod=1.52). Combining the data from the two data sets produced a maximum lod score of 4.66 (Table 3) at 122 cM near the marker D1S224. Another chromosomal region with suggestive evidence for linkage to the alcoholism or depression phenotype was on chromosome 2 (lod=3.26 at 100 cM in the combined data set; lod=1.76 for independent pairs of affected siblings).
The highest lod score for the comorbid alcoholism and depression phenotype was on chromosome 2 (lod=4.12 at 248 cM, near the marker D2S1371). This linkage finding was observed only in the replication data set. The combined data set showed a lod score of 2.16. Lod scores for the comorbid alcoholism and depression phenotype on chromosome 1 were not notably high.
The highest lod score for the depression phenotype was on chromosome 7 for independent pairs in the initial data set (lod=3.97 at 150 cM). A lod score of 1.86 was found for all possible pairs in the combined data set, and the score increased to 2.87 when only independent pairs were considered. Lod scores for the depression phenotype on chromosome 1 were not notably high.
The possible linkage on chromosome 1 was investigated further. Evidence for linkage spanned a chromosomal region of 60 cM (Figure 1). A confirmatory analysis with the sib_phase program that used data for all possible pairs of genotyped siblings from the combined data set identified a maximum lod score of 4.40 in this chromosomal region.
Discussion
Evidence for linkage was observed on proximal chromosome 1 for the alcoholism or depression phenotype in the initial and combined data sets. It is noteworthy that linkage in this chromosomal region was previously reported for the alcoholism phenotype (4). In that study, an analysis with the sib_ibd program that included all possible sibling pairs with alcoholism in the initial data set gave a peak lod score of 2.46 at about 175 cM, and the combined data showed a peak lod score of 2.90 (13). In that study, allele sharing in pairs with the alcoholism diagnosis was 57.7%, compared to 56.6% in pairs with the alcoholism or depression phenotype in this study. The broadening of the phenotypic definition thus resulted in an increase of 1–2 in the lod score because of the increase in the size of the data set with essentially no change in the rate of allele sharing.
It is noteworthy that the bipolar disorder data set from the NIMH Genetics Initiative showed possible linkage to this same region of chromosome 1 (20). In that data set, a peak lod score of 2.7 was found near the marker D1S224 in models using two diagnostic groupings (model II: bipolar I disorder, schizoaffective disorder/bipolar type, and bipolar II disorder; model III: bipolar I disorder, schizoaffective disorder/bipolar type, bipolar II disorder, and recurrent unipolar depression). It should be noted that a separate analysis of the Collaborative Study on the Genetics of Alcoholism data set showed that the same region was linked to a low level of response to alcohol (21).
The interpretation of lod scores in a complex disease is the subject of ongoing controversy. It is generally agreed that the lod threshold of 3.00 that is accepted as significant evidence of a linkage in a Mendelian condition is insufficient evidence for findings from genomic surveys of complex conditions. A lod score of 3.60 has been suggested for significance in these conditions (22), and a lod score of 2.20 is considered suggestive. However, even these thresholds do not account for the effects of testing multiple phenotypes and the use of multiple analytic methods. The present analysis was performed as a secondary analysis after the publication of primary results on the alcoholism phenotype (4). Three phenotypes were constructed on the basis of the data on comorbidity. Multipoint nonparametric linkage analysis was the sole method used to evaluate these phenotypes. Although caution in interpretation is needed, it appears likely that a locus on chromosome 1 accounts for some of the familial aggregation of alcoholism and depression in the Collaborative Study on the Genetics of Alcoholism data set, suggesting that a gene (or genes) is associated with different clinical phenotypes (i.e., pleiotropy).
Replication of linkage findings in a complex condition is expected to be difficult because of the following effect, which has been described by Suarez et al. (23). Where multiple genetic factors are contributory but no single factor is necessary, evidence for specific effects will sort variably in different data sets. Thus, replication of any given effect may require several studies with data sets as large as the original data set.
The fact that evidence for linkage on chromosome 1 was most prominent in the analysis of data for all possible sibling pairs implies that the effect is strongest in families with multiple affected members. We note that the allele sharing rates are consistent, however, only when the data for the independent pairs were analyzed. The most appropriate weighting for families with multiple affected siblings is not clear; an ideal weighting might be between that used for all possible pairs and that used for independent pairs.
A number of genes with potential importance for central nervous system functions have been localized to the implicated area on chromosome 1 (1p13-35). This region includes two genes for potassium channel-related proteins, as well as genes for the leptin receptor, several guanine nucleotide binding proteins, a tyrosine kinase, and a cyclic-AMP-specific phosphodiesterase (the Drosophila “dunce” protein homologue) (http://www.ncbi.nlm.nih. gov/locuslink).
We should note that the definition of depression in this study includes depression secondary to substance use as well as primary depressive illness. However, secondary and primary depressive syndromes may not be truly distinct. Many persons with alcohol problems spend many years of their lives drinking and thus have less opportunity to demonstrate independent episodes of depression. An alcoholic with true vulnerability for depression may, by the natural course of the two illnesses, have no independent episodes. We have noted that comorbid alcoholism and depression tends to aggregate in relatives of probands with this comorbidity. In a previous analysis of this data set, relatives of alcoholics with independent major depression were more likely to have major depresssion than relatives of alcoholics without major depressive disorder (14).
It is of interest that a similar signal on chromosome 1 is seen in families selected for bipolar affective disorder (20). Whether this signal is related to the presence in those families of patients with affective disorder who also have a vulnerability to alcohol problems remains to be seen.
The present analyses have not controlled for the effect of assortative mating in families with alcoholism; the effects of spousal vulnerability contribute to risk in offspring. However, this would tend to lead to false negative results but not false positive results in linkage analyses. It should also be noted that the phenotypes constructed here are a subset of the possible interactions between alcoholism and depression. One could assess alcoholism plus major depressive disorder, alcoholism or major depressive disorder and major depressive disorder alone, for instance, or study alcoholism plus depressive syndrome, excluding major depressive disorder. The choice was made initially to minimize the construction of new phenotypes to reduce type I error, but admittedly this choice reduces the specificity of the findings.
The majority of subjects with alcoholism in this data set were male, and the majority with depression were female. The alcoholism or depression phenotype added additional pairs to the linkage data set, many of which consist of a brother with alcoholism and a sister with depression. Thus, the gene effect we observe may have variable expression in men and women. This result is reminiscent of the concept of depressive spectrum disease, as postulated by Winokur et al. (8) nearly 30 years ago.
 |
 |
 |
 |
Presented at the annual meeting of the Research Society for Alcoholism, Santa Barbara, Calif., June 26–July 1, 1999. Received Feb. 8, 2000; revisions received June 16 and Sept. 26, 2000; accepted Oct. 23, 2000. From the Departments of Psychiatry, Medical and Molecular Genetics, and Biochemistry and Molecular Biology, Indiana University School of Medicine, Indianapolis; the Department of Psychiatry, University of Iowa, Iowa City; the Department of Psychiatry, Washington University at St. Louis; and the Department of Psychiatry, University of California, San Diego. Address reprint requests to Dr. Nurnberger, Department of Psychiatry, Indiana University Medical Center, 791 Union Dr., Indianapolis, IN 46202-4887; [email protected] (e-mail). The authors thank Kathleen Bucholz, Ph.D., for comments on the manuscript and Henri Begleiter, M.D., Ingrid Schmidt, and Ting Kai Li, M.D., for administrative support for the National Institute on Alcohol Abuse and Alcoholism Collaborative Study on the Genetics of Alcoholism. The Collaborative Study on the Genetics of Alcoholism (H. Begleiter, State University of New York, Health Sciences Center at Brooklyn [SUNY HSCB] principal investigator, T. Reich, Washington University at St. Louis, co-principal investigator) is supported by grant AA-08403 from the National Institute on Alcohol Abuse and Alcoholism and includes nine sites, each with its own principal and co-principal investigators: Indiana University (T.-K. Li, J. Nurnberger, Jr., P. M. Conneally, H. Edenberg); University of Iowa (R. Crowe, S. Kuperman); University of California at San Diego (M. Schuckit); University of Connecticut (V. Hesselbrock); SUNY HSCB (B. Porjesz, H. Begleiter); Washington University at St. Louis (T. Reich, C. R. Cloninger, J. Rice, A. Goate); Howard University (R. Taylor); Rutgers University (J. Tischfield); and the Southwest Foundation (L. Almasy). Also supported by grant AA-00285 from the National Institute on Alcohol Abuse and Alcoholism (T. Foroud, principal investigator).

Figure 1. Lod Scores on Chromosome 1 Resulting From Linkage Analysesa,b Including All Possible Sibling Pairs With the Alcoholism or Depression Phenotype in Families With Multiple Members With Alcoholism
aMap of markers was based on a genome screen in families with three or more members with alcoholism.
bAnalyses in the initial data set, replication data set, and combined data set were performed with the ASPEX sib_ibd program (19).
1. Merikangas KR, Gelernter CS: Comorbidity for alcoholism and depression. Psychiatr Clin North Am 1990; 13:613–632Crossref, Medline, Google Scholar
2. Merikangas KR, Risch NJ, Weismann MM: Comorbidity and co-transmission of alcoholism, anxiety, and depression. Psychol Med 1994; 24:69–80Crossref, Medline, Google Scholar
3. Reich T, Cloninger CR, Van Eerdewegh P, Rice JP, Mullaney J: Secular trends in the familial transmission of alcoholism. Alcohol Clin Exp Res 1988; 12:458–464Crossref, Medline, Google Scholar
4. Reich T, Edenberg HJ, Goate A, Williams JT, Rice JP, Van Eerdewegh P, Foroud T, Hesselbrock V, Schuckit MA, Bucholz K, Porjesz B, Li TK, Conneally PM, Nurnberger JI Jr, Tischfield JA, Crowe RR, Cloninger CR, Wu W, Shears S, Carr K, Crose C, Willig C, Begleiter H: Genome-wide search for genes affecting the risk for alcohol dependence. Am J Med Genet Neuropsychiatr Genet 1998; 81:207–215Crossref, Medline, Google Scholar
5. Weissman MM, Klerman GL: Sex difference in the epidemiology of depression. Arch Gen Psychiatry 1977; 34:98–111Crossref, Medline, Google Scholar
6. Nurnberger JI Jr, Gershon ES: Genetics of affective disorders, in Neurobiology of Mood Disorders. Edited by Post RM, Ballenger JC. New York, John Wiley & Sons, 1984, pp 76–101Google Scholar
7. Kendler KS, Heath AC, Neale MC, Kessler RC, Eaves LJ: Alcoholism and major depression in women: a twin study of the causes of comorbidity. Arch Gen Psychiatry 1993; 50:690–698Crossref, Medline, Google Scholar
8. Winokur G, Cadoret R, Dorzab J, Baker M: Depressive disease: a genetic study. Arch Gen Psychiatry 1971; 24:135–144Crossref, Medline, Google Scholar
9. Schlesser MA, Winokur G, Sherman BM: Genetic subtypes of unipolar primary depressive illness distinguished by hypothalamic-pituitary-adrenal axis activity. Lancet 1979; 1:739–741Crossref, Medline, Google Scholar
10. Schlesser MA, Winokur G, Sherman BM: Hypothalamic-pituitary-adrenal axis activity in depressive illness: its relationship to classification. Arch Gen Psychiatry 1980; 37:737–743Crossref, Medline, Google Scholar
11. Carroll BJ, Greden JF, Feinberg M, James NM, Haskett RF, Steiner M, Tarika J: Neuroendocrine dysfunction in genetic subtypes of primary unipolar depression. Psychiatry Res 1980; 2:251–258Crossref, Medline, Google Scholar
12. Nurnberger JI Jr, Berrettini W: Psychiatric Genetics. London, Chapman & Hall, 1998Google Scholar
13. Foroud T, Edenberg HJ, Goate A, Rice J, Flury L, Koller DL, Bierut LJ, Conneally PM, Nurnberger JI, Bucholz KK, Li T-K, Hesselbrock V, Crowe R, Schuckit M, Porjesz B, Begleiter H, Reich T: Alcoholism susceptibility loci: confirmation studies in a replicate dataset. Alcohol Clin Exp Res 2000; 24:933–945Crossref, Medline, Google Scholar
14. Schuckit MA, Tipp JE, Bergman M, Reich W, Hesselbrock V, Smith TL: Comparison of induced and independent major depressive disorders in 2,945 alcoholics. Am J Psychiatry 1997; 154:948–957Link, Google Scholar
15. Feighner JP, Robins E, Guze SB, Woodruff RA Jr, Winokur G, Munoz R: Diagnostic criteria for use in psychiatric research. Arch Gen Psychiatry 1972; 26:57–63Crossref, Medline, Google Scholar
16. Bucholz KK, Cadoret R, Cloninger RC, Dinwiddie SH, Hesselbrock VM, Nurnberger JI Jr, Reich T, Schmidt I, Schuckit MA: A new, semi-structured psychiatric interview for use in genetic linkage studies: a report on the reliability of the SSAGA. J Stud Alcohol 1994; 55:149–158Crossref, Medline, Google Scholar
17. Green P, Lange K, Cox DR: Documentation for CRIMAP, version 2.4. St Louis, Washington University, School of Medicine, Department of Genetics, 1990Google Scholar
18. Boehnke M: Allele frequency estimation from data on relatives. Am J Hum Genet 1991; 48:22–25Medline, Google Scholar
19. ASPEX is available at ftp://lahmed.stanford.edu/pub/aspex/index.htmlGoogle Scholar
20. Rice JP, Goate A, Williams JT, Bierut L, Dorr D, Wu W, Shears S, Gopalakrishnan G, Edenberg HJ, Foroud T, Nurnberger JI Jr, Gershon ES, Detera-Wadleigh SD, Goldin LR, Guroff JJ, McMahon FJ, Simpson S, MacKinnon D, McInnis M, Stine OC, DePaulo JR, Blehar MC, Reich T: Initial genome scan of the NIMH genetics initiative bipolar pedigrees: chromosomes 1, 6, 8, 10 and 12. Am J Med Genet Neuropsychiatr Genet 1997; 74:247–253Crossref, Medline, Google Scholar
21. Schuckit MA, Edenberg JH, Kalmijn J, Flury L, Smith TL, Reich T, Bierut L, Goate A, Foroud T, Begleiter H, Li T-K, Nurnberger JI Jr, Conneally PM, Crowe R, Kuperman S, Hesselbrock V, Porjesz B, Cloninger CR, Rice J, Tischfield J, Almasy L: A genome-wide search for genes relating to a low level of response to alcohol. Alcohol Clin Exp Res, in pressGoogle Scholar
22. Lander E, Kruglyak L: Genetic dissection of complex traits: guidelines for interpreting and reporting linkage results. Nat Genet 1995; 11:241–247Crossref, Medline, Google Scholar
23. Suarez BK, Hampe CL, Van Eerdewegh P: Problems of replicating linkage claims in psychiatry, in Genetic Approaches to Mental Disorders. Edited by Gershon ES, Cloninger CR. Washington, DC, American Psychiatric Press, 1994, pp 23–46Google Scholar