Recent Trends in Stimulant Medication Use Among U.S. Children
Abstract
Objective: Stimulant medications, such as methylphenidate and amphetamines, are commonly prescribed to treat attention deficit hyperactivity disorder. Stimulant use increased fourfold from 1987 (0.6%) to 1996 (2.4%) among subjects 18-year-old and younger in the U.S. The aim of this study was to determine whether pediatric use of stimulants continued to rise during the period 1997–2002. Method: The Medical Expenditure Panel Survey (MEPS) database for the years 1997–2001 was analyzed. The MEPS is a yearly survey of a nationally representative sample of civilian, noninstitutionalized U.S. households, conducted by the U.S. Agency for Health Care Research and Quality. Previously reported estimates from the 1996 MEPS and the 1987 National Medical Expenditure Survey, the predecessor to MEPS, were also replicated to compare recent trends to changes between 1987 and 1996. Results: The prevalence use of stimulants among subjects under 19 years of age was 2.7% (95% C.I. 2.3–3.1) in 1997 and 2.9% (95% C.I. 2.5–3.3) in 2002, with no statistically significant change during these 6 years. Likewise, when pooling data across years and comparing the rate in 1997–1998 (2.8%) with the rate in 2001–2002 (3.0%), no statistically significant changes emerged. Use was highest among 6–12 year olds (4.8% in 2002), as compared with 3.2% among 13–19 year olds and 0.3% among children under 6. An estimated 2.2 million (95% C.I. 1.9–2.6) children received stimulant medication in 2002 as compared to 2.0 million (95% C.I. 1.7–2.3) in 1997. Conclusions: The steep increase in the utilization of stimulants among children 18 years and younger that occurred over the 1987–1996 period attenuated in the following years through 2002, and has remained stable among very young children.
Stimulant medications, such as methylphenidate and amphetamines, have been used to treat children (here defined as subjects of 18 years of age or younger) with symptoms of attention deficit hyperactivity disorder (ADHD) for more than 30 years (1) . Because stimulants are drugs of potential abuse and ADHD remains a descriptive syndrome without diagnostic biological markers, controversy continues to plague the use of these medications drugs, especially for preschool-age children (2 , 3) . A steep increase in the utilization of these drugs during the period from the late 1980s to the mid-1990s has been documented by analyses of both health insurance databases and national surveys (4 , 5) . Use of stimulants increased from 0.6% in 1987 to 2.4% in 1996 among U.S. children, which was a fourfold increase during this 10-year period (4) . Stimulant utilization is known to vary considerably by gender, age, race/ethnicity, and geographical area, with a rate more than twofold higher in boys than in girls, and highest between 6 and 14 years of age, among whites, and in the U.S. South and Midwest (4 – 6) . Geographical variation makes it difficult to estimate national use from local databases.
The point prevalence of ADHD is generally estimated around 4%–5% of the child population, although higher rates have been recently reported (7 – 9) . Both underprescribing and overprescribing of stimulants have been described (10 – 12) . There are indications that, at least in some communities, a substantial portion of children receiving stimulants may not meet full criteria for ADHD (11) . These reports, together with the increase in stimulant use, also among preschool-age children, have raised concern about the extent and appropriateness of this pharmacological treatment of childhood behavioral problems.
It is unknown whether the utilization rate of stimulant medications has continued to increase in the late 1990s and early 2000s. During this period, further evidence of the effectiveness of these medications for children with ADHD was published and new long-acting formulations of methylphenidate were developed, which might have fostered use (13 , 14) . On the other hand, estimates of use based on a commercially insured sample suggest that the utilization rate among 5- to 14-year-old children was similar in 1999 (4.2%) to that reported for 1996 (4.1%) in another study (4 , 6) . However, comparisons across different databases are difficult to interpret, and no estimates of the national rate of utilization for the years after 1999 have been reported.
The purpose of the present study was to determine if the use of stimulant medication among children (i.e., subjects under 19 years of age) in the U.S. during the period 1996/1997–2002 continued to increase as had been previously reported during the 10 years up to 1996.
Method
Data Sources
The data are drawn from the 1997 through 2002 years of the Medical Expenditure Panel Survey (MEPS). The MEPS is a nationally representative household survey of health care use and costs, conducted by the Agency for Health Care Research and Quality (AHRQ), in conjunction with the National Center on Health Statistics (NCHS). The MEPS uses an overlapping panel design, combining two panels to produce estimates for each calendar year (with the exception of 1996 when the survey began). Households for each panel were interviewed five times over a 2-year period. The sample for each panel was drawn from the sample of all households responding to the National Health Interview Survey in the year prior to the panel start date in MEPS. Overall response rates for the 1997 through 2002 MEPS were 66.4% (1997), 67.9% (1998), 64.3% (1999), 65.8% (2000), 66.3% (2001), and 64.7% (2002). Our analytic sample includes all children under the age of 19 in each year. Final sample sizes were respectively 10,285 (1997); 7,282 (1998); 7,235 (1999); 7,286 (2000); 9,710 (2001); and 11,713 (2002). The larger sample sizes of children in 1997 and 2002 reflect the greater number of households surveyed in those years. The MEPS sample is poststratified to the Current Population Survey, and is representative of the civilian noninstitutionalized population in each year.
Data on prescription drug use in the MEPS was collected both directly from households and from a pharmacy follow-back survey. Stimulant use was identified through a combination of NDC codes and branded and generic medication names, as provided on the MEPS public use prescription drug files for the years 1997–2002. We define stimulants to include the following compounds in various formulations: methylphenidate, dexmethylphenidate, pemoline, amphetamine, and dextroamphetamine. Dexmethylphenidate, a reformulation of methylphenidate, received FDA approval in November 2001, but there was little reported usage in 2001 or 2002. Additional details on the household and pharmacy data collections are available on the public use data files and in a detailed methodology report produced by AHRQ (15) .
We also replicate previously reported estimates on stimulant use for the population under age 19 using data from the 1996 MEPS and the 1987 National Medical Expenditure Survey (NMES), the predecessor to MEPS, in order to compare more recent trends (1997–2002) to previously reported trends between 1987 and 1996/1997 (4) .
Data Analysis
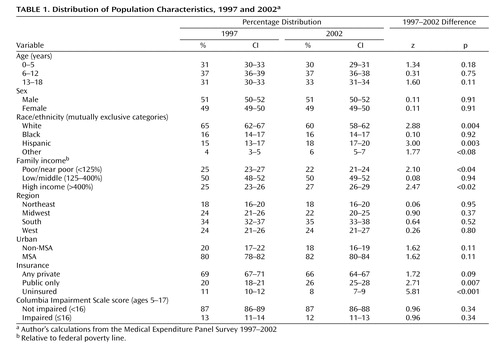
We report national estimates of the annual use of stimulants for the U.S. civilian, noninstitutionalized population of children 18 years old and younger for calendar years 1997 through 2002 using MEPS, our replicated estimates of calendar year 1996 from MEPS, and replicated estimates for 1987 use from NMES. We also report changes between 1997 and 2002 for the following population subgroups: age, sex, race/ethnicity, family income relative to the federal poverty line, census region, Metropolitan Statistical (MSAs) areas versus non-MSAs, health insurance coverage, and impairment as measured by the Columbia Impairment Scale (16) . We use 1997 instead of 1996 as the beginning time point for these subgroup analyses because the larger sample sizes in 1997 provide greater power to detect differences. Table 1 provides the distribution of these subgroups across the population aged 18 and under in 1997 and 2002.
MEPS sampling weights, which adjust for the complex sample design and nonresponse, are used throughout in the analyses. We use standard Z-score tests, computed with these weights and accounting for the complex sample design and correlation across individuals, to assess changes in stimulant use between 1997 and 2002, as well as differences between population subgroups in each year. We also tested whether the average annual increase in the decade between 1987 and 1997 was the same as the average annual increase between the 5-year period between 1997 and 2002, accounting for the design of the NMES and MEPS surveys.
Logistical regression analysis was used to further examine the sociodemographic correlates of stimulant use among children age 5–17 for whom the Columbia Impairment Scale measure was available, pooling the years 2000 through 2002 to increase power to detect differences.
We have 90% power to detect an average 0.20 percentage point change per year over a 5-year period at the .05 level. This is a smaller average increase than was observed between 1987 and 1997 (0.26 percentage points). To increase statistical power further, we performed statistical tests for changes in stimulant use rates by pooling data for consecutive years.
All statistical analyses and tests were performed using Stata version 8.2 (Stata Corporation, College Station, Tex.)
Results
The estimated prevalence of stimulant medication use for the years 1997–2002 is presented in Table 2 . The utilization rate for all age groups was 2.7% (95% C.I. 2.3–3.1) in 1997 and 2.9% (95% C.I. 2.5–3.3) in 2002, with no statistically significant changes during this 5-year period. The 2002 rate corresponds to an estimate of 2.2 million (95% C.I. 1.9–2.9) users in 2002. Use was highest among 6–12 year olds (4.8% in 2002), followed by the 13–18-year-old group (3.2%), while use among children under 6 years was 0.3%. No statistically significant increase in the prevalence of use was detected for any of the three age groups between 1997 and 2002.
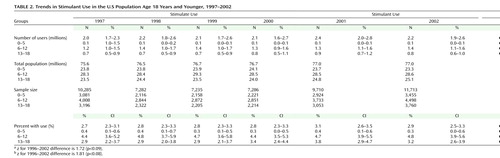
Additional tests pooling 1997 and 1998 (2.8% across all age groups) and comparing these years to 2001 and 2002 (3.0%) also showed no statistically significant change over time. However, there were some statistically significant changes when using 1996 as the base year instead of 1997. The overall rate of use of 2.4% in 1996 increased to the 2001–2002 combined rate of 3.0% (p=0.064). There was also a statistically significant increase in use among 13–18 years olds from 2.3% in 1996 to 3.5% for 2001/2002 combined.
The estimated prevalence for use of stimulant medication for the 5 years between 1997 and 2002 was compared to estimates for the decade between 1987 and 1997 (with only the year 1996 available between 1987 and 1997) in Figure 1 . The average annual increase in the estimated use in the 5 years between 1997 and 2002 was 0.05 children per 100, but this increase was not statistically significant from zero (p=0.47). In contrast, the average annual increase in the prevalence of stimulant use for the decade between 1987 and 1997 was 0.21 children per 100 (p<0.001). The change in trend in the average annual increase between 1987 and 1997 and 1997–2002 is statistically significant (p=0.04).
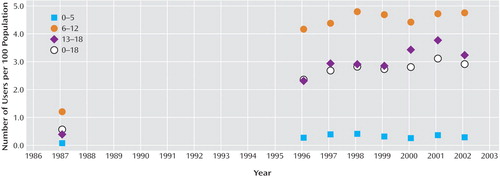
a Authors’ calculations from the 1987 National Medical Expenditure Survey and the Medical Expenditure Panel Survey (MEPS) 1996–2002.
The use of stimulant medications was higher in males (4.0% in 2001) than in females (1.7%), and in white (3.6%) than in black (2.2%) or Hispanic (1.4%) children ( Table 3 ). There was an increase in use among black children from 1997 to 2002 (1.2% in 1997 versus 2.2% in 2002, p=0.09). Family income, type of health insurance, and living in urban setting did not moderate the rate of use. Subjects without insurance had lower utilization (0.9% in 2002) than children with either public (3.3%, p<0.001) or private health insurance coverage (3.0%, p<0.001).
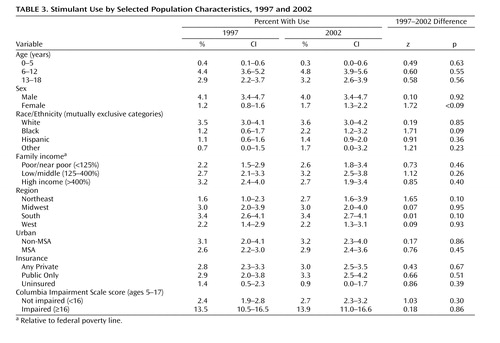
Use of stimulants was much higher among children who were reported to have functional impairment (13.9% in 2001) than among those deemed to be not impaired (2.7%, p<0.001). Results from logistic regression analysis pooling the years 2001 and 2002 confirmed these results ( Table 4 ).
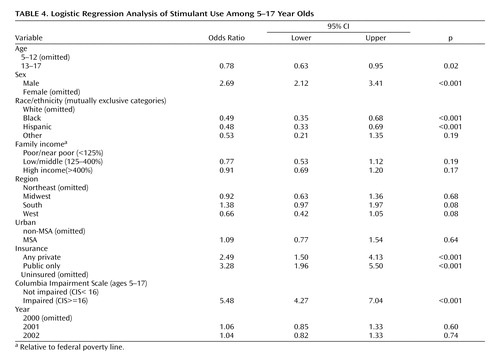
Differences among geographical regions were not statistically significant in 2002 with the exception of the higher utilization in the South (3.4%) compared with the West (2.2%, p=0.05). Differences among regions were more pronounced in 1997 ( Table 3 ), with the Northeast (1.6%) and West (2.2%) having lower utilization than the Midwest (3.0%) and South (3.4%). Treatment rates in 2002 remained the same in the Midwest (3.0%), South (3.4%), and West (2.2%). However, utilization increased markedly in the Northeast from 1.6% in 1997 to 2.7% in 2002 (p=0.101). This increase in utilization in the Northeast becomes statistically significant at the 0.05 level (p=0.025), when pooling the years 1996–1998 (1.8%, 1.6%, and 2.1% respectively) and comparing to the years 2000–2002 (2.9%, 3.4% and 3.0%, respectively). The logistic regression results ( Table 4 ) show that the Northeast continued to have lower utilization than the South (OR=1.38, p=0.073) in 2000–2002 but higher utilization than the West (OR=0.66, p=0.078). The West (p<0.001) and Midwest (p=0.01) also had lower utilization compared to the South.
Discussion
These data, which are based on the survey of a nationally representative sample, suggest that the steep rate of increase in utilization of stimulant medication among children attenuated during the 5-year period between 1997 and 2002. Utilization remained highest among children 6 to 12 years of age (4.8%, 95% C.I. 3.9–5.6, in 2002), a rate that had remained, however, stable since 1998 (4.8%, 95% C.I. 3.7–5.9).
The use among children under 6 years of age remained stable at 0.3% in 2002 as compared with 0.4% in 1997. A previous report, based on regional health insurance databases, of a 1.7-fold to 3.1-fold increase in stimulant utilization rate in preschoolers from 1991 through 1995 raised much concern of a rapidly escalating use in young children (5) . The 1997–2002 data indicate that, nationwide, a further increase in this age group has not occurred. This finding is also consistent with a recent report that pharmacological treatment of preschoolers with behavioral disturbances is rather uncommon (18) .
There was a trend toward increased utilization among black children, whose use went from 1.2% (0.6–1.7) in 1997 to 2.2% (1.2–3.2) in 2002, suggesting that the well known discrepancy in stimulant medication use across racial/ethnic groups has been attenuating. No difference in use was found between privately and publicly insured children, thus confirming that the treatment approach to ADHD does not vary based on insurance type. Not unexpectedly, however, uninsured children had a substantially lower utilization than insured children.
The level of functional impairment was measured on the Columbia Impairment Scale. Children with functional impairment had much higher use (mean 13.9% in 2002) than nonimpaired children (2.9%). Because unimpaired children are more prevalent in the general population, it is estimated that 45% (37–53% 95% C.I) of the use in 1997 and 40% (33–48%, 95% C.I.) in 2002 was accounted for by children with reported functional impairment, leaving most of the use by children without reported functional impairment. This finding is difficult to interpret because we could not determine from the database how many currently unimpaired children were functionally impaired before starting stimulant treatment. Thus, many of the children reported as without functional impairment may be children who have responded to the medication and thus be unimpaired at the time of the survey.
Consistent with previous reports, predictors of stimulant use included being male, being white, being under 13 years of age, being insured, being functionally impaired, and living in the South ( Table 4 ). These data indicate that, overall, the pattern of utilization has not substantially changed over the years. The comparison between use in 1997 and 2002, however, shows a trend for increased utilization in girls and in black children ( Table 3 ), thus suggesting that some of these differences may be attenuating.
There are several limitations in this study. The MEPS data do not contain clinical information for deriving valid determinations of a diagnosis of ADHD. Thus, these data cannot address the issue of whether stimulants are over- or underprescribed. The estimated utilization of 2.9% (95% C.I. 2.5–3.3) is well within the limit of the estimated 4%–5% point prevalence of ADHD in the general population, but we cannot determine how many users had a valid case of ADHD. Self-report surveys such as the MEPS rely on the responders’ ability and willingness to accurately recall information. Recall and reporting biases could result in under reporting and consequently underestimating use. Yet, the validity of the MEPS data is supported by their consistency with data on drug expenditures from other sources (19 , 20) . For example, the estimated 1999 use of stimulants among children 6–12 years of age based on MEPS data are consistent with that derived from a private national insurance claim database (6) .
Finally, while MEPS is a large national survey, it lacks power to detect small increases over time. Thus, stimulant use may have been increasing slightly over the period 1997 to 2002, but we cannot say for sure. However, there is enough statistical power to rule out larger increases in this period.
In conclusion, these data suggest that the increase in the utilization of stimulant medications among children 18 years and younger that occurred over the 1987–1996 period has attenuated during the following years 1997–2002.
1. American Academy of Pediatrics. Clinical practice guideline: treatment of the school-aged child with attention-deficit/hyperactivity disorder. Pediatrics 2001;108:1033–1044Google Scholar
2. Zito JM, Safer DJ, dosReis S, Gardner JF, Boles M, Lynch F: Trends in the prescribing of psychotropic medications to preschoolers. JAMA 2000; 283:1025–1030Google Scholar
3. Coyle JT: Psychotropic medications in very young children. JAMA 2000; 283:1059–1060Google Scholar
4. Olfson M, Marcus SC, Weissman MM, Jensen PS: National trends in the use of psychotropic medications by children. J Am Acad Child Adolesc Psychiatry 2002; 41:514–521Google Scholar
5. Zito JM, Safer DJ, dosReis S, Gardner JF, Magder L, Socken K, Boles M, Lynch F, Riddle MA: Psychotropic practice patters for youth. Arch Pediatr Adolesc Med 2003; 157:17–25Google Scholar
6. Cox ER, Motheral BR, Henderson RR, Mager D: Geographic variation in the prevalence of stimulant medication use among children 5 to 14 years old: results from a commercially insured US sample. Pediatrics 2003; 111:237–243Google Scholar
7. Shaffer D, Fisher P, Dulcan MK, Davies M, Piacentini J, Schwab-Stone ME, Lahey BB, Bourdon K, Jensen PS, Bird HR, Canino G, Regier DA: The nimh diagnostic interview schedule for children version 2.3 (DISC-2.3): description, acceptability, prevalence rates, and performance in the meca study. J Am Acad Child Adolesc Psychiatry 1996; 35:865–877Google Scholar
8. Szatmari P, Offord DR, Boyle MH: Ontario child health study: prevalence of attention deficit disorder with hyperactivity. J Child Psychol Psychiatry 1989; 30:219–230Google Scholar
9. Barbaresi WJ, Katusic SK, Colligan RC, Pankratz VS, Weaver AL, Weber KJ, Mrazek DA, Jacobsen SJ: How common is attention-deficit/hyperactivity disorder? Arch Pediatr Adolesc Med 2002; 156:217–224Google Scholar
10. Jensen PS, Kettle L, Roper M, Sloan MT, Dulcan MK, Hoven C, Bird HR, Bauermeister JJ, Payne JD: Are stimulants overprescribed? treatment of adhd in four U.S. communities J Am Acad Child Adolesc Psychiatry 1999; 38:797–804Google Scholar
11. Angold A, Erkanli A, Egger HL, Costello EJ: Stimulant treatment for children: a community perspective. J Am Acad Child Adolesc Psychiatry 2000; 39:975–984Google Scholar
12. Rowland AS, Umbach DM, Stallone L, Naftel AJ, Bohlig EM, Sandler DP: Prevalence of medication treatment for attention deficit-hyperactivity disorder among elementary school children in Johnston county, NC. Am J Public Health 2002; 92:231–234Google Scholar
13. The MTA Cooperative Group: A 14-month randomized clinical trial of treatment strategies for attention-deficit/hyperactivity disorder (ADHD). Arch Gen Psychiatry 1999; 56:1073–1086Google Scholar
14. Wolraich ML, Greenhill LL, Pelham W, Swanson J, Wilens T, Palumbo D, Atkins M, McBurnett K, Bukstein O, Aug G: Randomized, controlled trial of oros methylphenidate once a day in children with attention-deficit/ hyperactivity disorder. Pediatrics 2001; 108:883–892Google Scholar
15. Moeller JF, Stagnitti MN, Horan E Outpatient Prescription Drugs: Data Collection and Editing in the 1996 Medical Expenditure Survey (HC-010A). Rockville (MD): Agency for Healthcare Research and Quality, Pub. number 01–0002, 2001Google Scholar
16. Bird H, Schwab-Stone M, Andrews H, et al: Global measures of impairment for epidemiologic and clinical use with children and adolescents. J Methods in Psychiatr Res 1996; 6:295–308Google Scholar
17. Mannuzza S, Klein RG: Long-term prognosis in attention-deficit/hyperactivity disorder. Child Adolesc Psychiatr Clin N Am 2000; 9:711–726Google Scholar
18. DeBar LL, Lynch F, Powell J, Gale J: Use of psychotropic agents in preschool children. Arch Pediatr Adolesc Med 2003; 157:150–157Google Scholar
19. Selden TM, Levit KR, Cohen JW, Zuvekas SH, Moeller JF, McKusick D, Arnett RH 3rd. Reconciling medical expenditure estimates from the MEPS and the NHA, 1996. Am J Public Health. 2002;92:231–234Google Scholar
20. Zuvekas SH Prescription drugs and the changing patterns of treatment for mental disorders, 1996–2001. Health Affairs 2005 (in press).Google Scholar