Omega-3 Fatty Acid Treatment and T2 Whole Brain Relaxation Times in Bipolar Disorder
Abstract
OBJECTIVE: The authors hypothesized that changes in brain membrane composition resulting from omega-3 fatty acid administration in patients with bipolar disorder would result in greater membrane fluidity, as detected by reductions in T2 values. METHOD: Women with bipolar disorder (N=12) received omega-3 fatty acids for 4 weeks. A cohort of bipolar subjects (N=9) and a group without bipolar disorder (N=12) did not receive omega-3 fatty acids. T2 values were acquired at baseline and after 4 weeks. RESULTS: Bipolar subjects who received omega-3 fatty acids had significant decreases in T2. There was a dose-dependent effect when the bipolar omega-3 fatty acid group was subdivided into high- and low-dose cohorts. CONCLUSIONS: Omega-3 fatty acids lowered T2 values, consistent with the hypothesis that the fluidity of cell membranes was altered. Further studies are needed to clarify the significance of alterations in brain physiology induced by omega-3 fatty acids, as reflected in T2 values.
Omega-3 fatty acids have been proposed as an adjunctive treatment for bipolar disorder (1). Although the mechanism of action is unknown, the effects of omega-3 fatty acids may be mediated by their incorporation into brain cell membranes (2). Ehringer et al. (3) have demonstrated an increase in membrane permeability in phospholipid bilayers after administration of docosahexanoic acid. Membrane fluidity is a critical modulator of several cellular functions, including mitochondrial functioning, signal transduction, surface receptor binding, and membrane-protein interactions (4–7).
As neuronal membrane fluidity is increased by the presence of unsaturated fatty acids, water molecules readily access the membrane surface by means of bound or exchangeable water protons. Increased accessibility can be detected with changes in brain water proton transverse relaxation times (T2), which are highly sensitive to myelin content and the corresponding differences in water environments (8). In this study, we used magnetic resonance imaging (MRI) assessments of T2 to investigate the effects of omega-3 fatty acids in vivo. Based on the magnetic resonance spectroscopy observations of ethanol signal intensity in human brains (9), we hypothesized that brain water T2 values would decrease in bipolar subjects who receive omega-3 fatty acids because of increased membrane fluidity.
Method
Twenty-one women with a mean age of 34.0 years (SD=12.7) who met DSM-IV criteria for bipolar I disorder were recruited from the Psychopharmacology Research Laboratory of McLean Hospital and the Harvard Bipolar Research Program of Massachusetts General Hospital. Only women were included in the study group to provide a more homogeneous population. The comparison group (N=12) had a mean age of 28.3 years (SD=5.4) and was recruited from advertisements and hospital staff. Subjects diagnosed with any other axis I disorders, receiving drugs that affect lipid metabolism, or taking warfarin were excluded from the study. This protocol was approved by the institutional review board of McLean Hospital, and each subject provided written informed consent before participation.
All subjects received an MRI scan at baseline and at 4 weeks. There were three cohorts in this study:
| 1. | Bipolar subjects treated with omega-3 fatty acids (N=12) | ||||
| 2. | Bipolar subjects not receiving omega-3 fatty acids (N=9) | ||||
| 3. | Healthy comparison subjects (N=12) | ||||
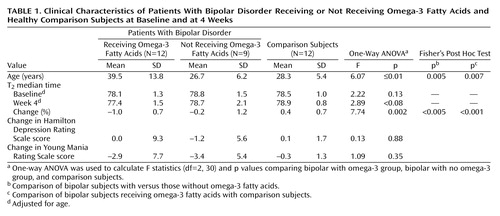
After the baseline MRI, 12 bipolar subjects (mean age=39.5 years, SD=13.8) began treatment with omega-3 fatty acids for 4 weeks. Subjects who received omega-3 fatty acids received either 1) high doses of omega-3 fatty acids for a total of 5.0–5.2 g/day of eicosapentaenoic acid, 3.0–3.4 g/day of docosahexanoic acid, and 1.7 g/day of other omega-3 fatty acids (N=6) or 2) low doses of omega-3 fatty acids for a total of 1.3 g/day of eicosapentaenoic acid and 0.7 g/day of docosahexanoic acid (N=6). Those receiving omega-3 fatty acids were assigned to treatment arms in a blinded, randomized, placebo-controlled fashion.
The 23-item Hamilton Depression Rating Scale and an 11-item Young Mania Rating Scale (10) were administered and completed by all subjects at baseline and at week 4.
Bipolar subjects were taking lithium (N=7), valproic acid (N=10), other anticonvulsants (N=2), or no medications (N=2) before their initial MRI scans. All subjects continued with the medications they had been receiving throughout the course of the study.
MRI scans were conducted by using a 1.5-T magnetic resonance scanner (Signa, General Electric Medical Systems, Milwaukee). T2 values through a single 5-mm axial plane at the level of the bilateral basal ganglia were generated by using methods described in a previously study (11). Pixels containing bone or CSF had T2 values below 40 msec or above 100 msec, respectively, and were not included in the analyses.
One-way analysis of variance (ANOVA) and Fisher’s post hoc tests were used to assess T2 change differences between bipolar patients receiving omega-3 fatty acids, bipolar patients not receiving omega-3 fatty acids, and healthy comparison groups. Age and change from baseline on the Hamilton depression scale and the Young Mania Rating Scale were compared among the three study subgroups using one-way ANOVAs.
Results
After 4 weeks of treatment, the T2 medians for the bipolar omega-3 fatty acid group had decreased significantly by 0.73 msec from baseline to week 4 (t=4.96, df=11, p<0.001). The ANOVA for T2 percentage change from baseline revealed a main effect among the bipolar omega-3 fatty acid, bipolar no omega-3 fatty acid, and comparison groups (F=7.74, df=2, 30, p<0.005). Post hoc analyses showed that the percentage change in T2 median times was significantly decreased in the bipolar omega-3 fatty acid group relative to both the bipolar subjects who did not receive omega-3 fatty acids (p<0.05) and the comparison subjects (p<0.001) (Table 1).
A dose-dependent main effect was observed when the bipolar omega-3 fatty acid group was subdivided into high-dose (8.4–9.9 g, N=6) and low-dose (2.0 g, N=6) (F=5.11, df=3, 29, p<0.006) subgroups. Post hoc tests showed that the omega-3 fatty acid high-dose group had a larger percentage change that was less than significant in T2 median times when compared with the bipolar no omega-3 fatty acid group (p=0.05). Both the omega-3 fatty acid high-dose (p<0.002) and omega-3 fatty acid low-dose (p<0.008) groups displayed significant decreases in percentage change in T2 median times relative to the comparison group.
There was a significant age difference among the groups (F=6.07, df=2, 30, p<0.01), with the bipolar omega-3 fatty acid group being significantly older than both the bipolar no omega-3 fatty acid group and the comparison group. A regression plot of age versus baseline T2 values indicated that there was a correlation between age and T2 values (R=0.42, p<0.02). Statistical analyses of T2 percentage change from baseline were repeated, with adjustment for age. The results remained unchanged.
There were no significant changes in Hamilton depression scale scores (F=0.13, df=2, 30, p=0.88) or Young Mania Rating Scale scores (F=1.09, df=2, 30, p=0.35) in the three groups from baseline to week 4. However, there was a modest but nonsignificant correlation between omega-3 fatty acid-induced reductions in T2 and Hamilton depression scale scores for the high-dose fish oil cohort (R=0.58, p=0.23).
Discussion
Brain water spin-spin relaxation time, or T2, is sensitive to the surrounding tissue environment. The magnetic dipole moments of individual protons are dephased by interactions with nearby macromolecules. Since T2 is a measure of the rate of dephasing, the packing of the lipid molecules and lateral mobility of the membrane should affect these values. Based on these assumptions, we believe that the decrease in T2 values observed for the bipolar subjects who received omega-3 fatty acids is consistent with an increase in membrane fluidity. The dose-dependent effect observed in the bipolar omega-3 group provides additional evidence that an increased intake of essential fatty acids into the diet, and the subsequent incorporation of fatty acids into the lipid membrane, is associated with an increased change in T2 values.
Prior studies have indicated that other factors may also affect T2 values. In particular, Anderson et al. (12) examined putamen and cerebellar vermis regions and demonstrated that T2 values acquired by using an identical acquisition method are inversely related to cerebral blood volume levels. Additional research using perfusion imaging methods may aid in clarifying the factors responsible for T2 change.
The increase in T2 seen in the comparison subjects was possibly due to decreased cerebral blood flow (CBF) with repeated study. Gur and colleagues (13) have shown that after a “low-anxiety” stimulus, subjects experienced decreases in CBF, while subjects undergoing a “high-anxiety” stimulus experienced a linear increase in CBF correlated with anxiety. Assuming that subjects undergo habituation to the MRI scanner after the initial scan, the changes in CBF may influence T2 values. If this phenomenon occurs in bipolar subjects, T2 would be expected to increase at the 4-week scan, rather than decrease, as the subjects became more accustomed to the scanner.
This study has several limitations. We did not detect significant changes in mood states in the bipolar subjects after omega-3 fatty acid administration. However, the small sizes of the bipolar groups and the relative brevity of the study may have made it difficult to detect changes in variable factors such as mood. Although the biological effects of omega-3 fatty acids were detectable within 4 weeks of treatment, the effects on mood state may require a longer time interval. Matching the groups by age would also have improved the study.
In summary, a decrease in T2 values was detected in bipolar subjects who received omega-3 fatty acid treatment, consistent with a treatment-induced increase in membrane fluidity. Future studies should be conducted with control for factors that may influence T2 values, such as changes in CBF or variations in mood or anxiety states.
 |
Received Aug. 8, 2002; revisions received Oct. 31, 2002, and July 21, 2003; accepted Jan. 9, 2004. From the Brain Imaging Center and the Psychopharmacology Research Laboratory, McLean Hospital, Belmont, Mass.; the Department of Psychiatry, Harvard Medical School, Boston; and the Harvard Bipolar Research Program, Massachusetts General Hospital, Boston. Address reprint requests to Ms. Hirashima, 23A Melview Ridge, Norwich, VT 05055; [email protected] (e-mail). Supported in part by the Poitras Foundation, the Stanley Foundation Bipolar Disorders Research Center at McLean Hospital, and NIMH grant MH-58681 (to Dr. Renshaw).
1. Stoll AL, Severus WE, Freeman MP, Rueter S, Zboyan HA, Diamond E, Cress KK, Marangell LB: Omega 3 fatty acids in bipolar disorder: a preliminary double-blind, placebo-controlled trial. Arch Gen Psychiatry 1999; 56:407–412Crossref, Medline, Google Scholar
2. Tappia PS, Ladha S, Clark DC, Grimble RF: The influence of membrane fluidity, TNF receptor binding, cAMP production and GTPase activity on macrophage cytokine production in rats fed a variety of fat diets. Mol Cell Biochem 1997; 166:135–143Crossref, Medline, Google Scholar
3. Ehringer W, Belcher D, Wassall SR, Stillwell W: A comparison of the effects of linolenic (18:3 omega 3) and docosahexaenoic (22:6 omega 3) acids on phospholipid bilayers. Chem Phys Lipids 1990; 54:79–88Crossref, Medline, Google Scholar
4. Scaglia F, Longo N: Primary and secondary alterations of neonatal carnitine metabolism. Semin Perinatol 1999; 23:152–161Crossref, Medline, Google Scholar
5. Brenner RR: Effect of unsaturated acids on membrane structure and enzyme kinetics. Prog Lipid Res 1984; 23:69–96Crossref, Medline, Google Scholar
6. Stubbs CD, Smith AD: The modification of mammalian membrane polyunsaturated fatty acid composition in relation to membrane fluidity and function. Biochim Biophys Acta 1984; 779:89–137Crossref, Medline, Google Scholar
7. Horrobin D: The phospholipid concept of psychiatric disorders and its relationship to the neurodevelopmental concept of schizophrenia, in Phospholipid Spectrum Disorder in Psychiatry. Edited by Peet M, Glen I, Horrobin D. Carnforth, Lancashire, UK, Marius Press, 1999, pp 3–20Google Scholar
8. Whittall KP, MacKay AL, Graeb DA, Nugent RA, Li DK, Paty DW: In vivo measurement of T2 distributions and water contents in normal human brain. Magn Reson Med 1997; 37:34–43Crossref, Medline, Google Scholar
9. Kaufman MJ, Chiu TM, Mendelson JH, Woods BT, Teoh SK, Eros-Sarnyai M, Mercer G, Mello NK: Brain alcohol detectability increase with repeated administration in humans: a proton spectroscopy study. Magn Reson Med 1996; 35:435–440Crossref, Medline, Google Scholar
10. Young RC, Biggs JT, Ziegler VE, Meyer DA: A rating scale for mania: reliability, validity and sensitivity. Br J Psychiatry 1978; 133:429–435Crossref, Medline, Google Scholar
11. Teicher MH, Anderson CM, Polcari A, Glod CA, Maas LC, Renshaw PF: Functional deficits in basal ganglia of children with attention-deficit/hyperactivity disorder shown with functional magnetic resonance imaging relaxometry. Nat Med 2000; 6:470–473Crossref, Medline, Google Scholar
12. Anderson C, Maas L, Renshaw P, Teicher M: Non-invasive T2 relaxation time measures correlate with gadolinium-based cerebral blood volume estimates in the putamen and cerebellar vermis. Abstracts of the Society for Neuroscience 2000; 26:1730Google Scholar
13. Gur RC, Gur RE, Resnick SM, Skolnick BE, Alavi A, Reivich M: The effect of anxiety on cortical cerebral blood flow and metabolism. J Cereb Blood Flow Metab 1987; 7:173–177Crossref, Medline, Google Scholar