Successful Aging
Abstract
OBJECTIVE: Until now, prospective studies of aging have begun with 50–60-year-olds, not adolescents. Premature death, childhood variables, and alcohol abuse have been often ignored, as has successful aging. METHOD: The authors reviewed the existing literature on health in late life in order to highlight that, increasingly, successful aging is not an oxymoron. The present study followed two cohorts of adolescent boys (237 college students and 332 core-city youth) for 60 years or until death. Complete physical examinations were obtained every 5 years and psychosocial data every 2 years. Predictor variables assessed before age 50 included six variables reflecting uncontrollable factors: parental social class, family cohesion, major depression, ancestral longevity, childhood temperament, and physical health at age 50 and seven variables reflecting (at least some) personal control: alcohol abuse, smoking, marital stability, exercise, body mass index, coping mechanisms, and education. The six outcome variables chosen to assess successful aging at age 70–80 included four objectively assessed variables (physical health, death and disability before age 80, social supports, and mental health) and two self-rated variables (instrumental activities of daily living and life enjoyment). RESULTS: Multivariate analysis suggested that “good” and “bad” aging from age 70–80 could be predicted by variables assessed before age 50. More hopeful still, if the seven variables under some personal control were controlled, depression was the only uncontrollable predictor variable that affected the quality of subjective and objective aging. CONCLUSIONS: One may have greater personal control over one’s biopsychosocial health after retirement than previously recognized.
This review of successful aging will be presented in two parts. First, we shall review selected findings from the past 15 years. This research dispels many myths and helps us attend to what is most salient about aging, both in terms of decline and development. Second, we will report heuristic findings from the Study of Adult Development, arguably the first prospective interdisciplinary study in the world to study physical and mental health from adolescence until old age.
What Is Known About Successful Aging
In the future, geriatric psychiatry must learn to pay as much attention to health as to disease. With his concept of “compression of morbidity,” James Fries (1) was among the first to assert that the 1955 motto of the American Gerontological Society was coming true; modern medicine was “adding life to years; not just more years to life.” In 1990 there were 4 million people age 85 and older (the old-old) in the United States. There will be 10 times that many in 2040. It is surprising that this is not so much the result of greater longevity among the elderly but of more people living to age 65. In the past century, the lifespan of 85-year-old men has increased only 1.2 years (from 4.0 years in 1900 to 5.2 years in 1987) (2); but because of medical advances and changes in lifestyle, however, these surviving octogenarians are more likely to be active. For example, by the end of his life, the average 85-year-old man will have spent only 0.56 years in an institution, and the average 85-year-old woman will have spent 1.5 years (2). Between ages 75 and 84, 73% of elderly people report no disability; and after age 85, 40% of the population remain fully functional (3). Over the last century, the number of years an individual spends in active retirement has increased 10-fold. Thus, psychiatry in the 21st century must pay attention not only to the ills of the old-old but also to the determinants of successful biopsychosocial aging.
In order that successful aging not seem an oxymoron, the concept of aging must be viewed from three dimensions: decline, change, and development. The term “aging” can connote decline, and decline is not successful. After age 20 our senses slowly fail us. By age 70 we can identify only 50% of the smells that we could recognize at 40 (4). Our vision in dim light declines steadily, until by age 80, few of us can drive at night (5); by age 90, 50% of us can no longer use public transportation (6).
But the term “aging” also conveys change, a relatively neutral meaning. Analogous to the transformation of trees from spring to winter, our hair changes from chestnut to white, our waistline becomes portly, our eyes acquire crow’s feet, and our frequency of making love shifts from three times a week to twice a month. But equally important, our ability to love and be loved does not diminish with age. At the beach we pick up grandkids instead of sweethearts, but our capacity for joy is undiminished.
Finally, the term “aging” also conveys development and maturation. Analogous to a grand cru wine evolving from bitterness to perfection, at 70 we are often more patient, more tolerant, and more accepting of affect in ourselves and others (7). We are more likely to tolerate paradox, to appreciate relativity, and to understand that every present has both a past and a future (8). Adults, like toddlers, can lose millions of neurons even as their cognitive skills evolve, and the midline laminar bundle linking the limbic brain to the frontal lobes evolves until age 50 (9). Finally, like age itself, experience can only increase with time.
The Berlin Aging Study recently concluded, “Old age is not foremost a negative and problem-ridden phase of life” (10, p. 506), and the MacArthur Study of Aging (3) also provided excellent support that our greater longevity is resulting in less, not more, years of disability. By making a careful cross-sectional study of a representative sample of 516 urban Berliners aged 70–100, the Berlin Aging Study has shattered many common beliefs about old age. The Berlin Aging Study included 43 men and 43 women in each of six 5-year age cohorts between age 70 and 100. On one hand, after age 70, almost all of the subjects suffered at least one serious illness; and many suffered up to five. Fifty percent had painful arthritis; after age 95, 50% experienced significant dementia. On the other hand, before age 95, less than 10% manifested dementia; nine out of 10 still retained life goals. In another study of still-active octogenarian men (11), 76% still had sexual partners, 17% had intercourse at least once a week, and 35% more still masturbated.
When we look at mental functioning first, the bad news is that the Berlin Aging Study’s old-old subjects (aged 85–100 years) resembled humans coping with severe stress. They experienced fewer positive emotions, more emotional loneliness, and a feeling that others controlled their lives. After age 90, only 50% felt they had a confidante. Such grim statistics, however, would be less bleak if individuals in “terminal decline” (i.e., in the 1–3-year period before death) had been excluded. The good news was that with the exception of dementia, there was not more mental illness among the elderly—even among the old-old. Like arthritis and hip fracture, even dementia should be viewed as a common, but not inevitable, consequence of longevity. If after age 85, Alzheimer’s disease is both a common disease and an enormous burden on nursing homes and relatives; nevertheless, Alzheimer’s disease affects only one-half of centenarians (12). Social networks had declined only from an average of 13 individuals at age 70 to seven at age 90.
These findings are confirmed by other studies. Most mental deterioration before age 80 reflects disease and not the normal aging process. Schaie (13) observed that “virtually none of the individuals contained in our data set showed universal decline in all of the [five] abilities monitored—even by the eighties” (p. 114). Our IQs at age 75 are roughly what they were at 20 (14). True, after 30, our ability to recall proper names steadily declines, but such anomia does not predict dementia.
Careful epidemiological study of the aged from multiple centers (10, 15) has revealed that there is no increase in depression among elderly individuals. Similarly, literature reviews have shown that happiness and life satisfaction are stable over the last half of the lifespan (16, 17). The best predictors of happiness in a septuagenarian were those high on trait extroversion and low on trait neuroticism—traits that are stable over the adult lifespan (10). After age 40, the fear of death declines steadily (18), and belief in the afterlife increases.
After age 85, however, 60% of the Berlin Aging Study women and 30% of the men needed help bathing or showering; only one in five needed nursing-home care. These figures are inflated by the fact that participants over age 95 were oversampled. Even after age 85, only one-quarter of waking life was spent “resting.”
The MacArthur Study (3) and the national survey on which the SF-36 norms are based (19) confirm the findings of the Berlin Aging Study. Although elderly people may be taking an average of three to eight different medicines and may be chronically ill in the eyes of their physicians, they often do not regard themselves as sick (10)—an important distinction. Subjectively, two out of three elderly individuals perceive their own health as superior to that of their peers, whereas only one in seven feels less healthy than their peers.
Of great interest, multivariate analysis of the Berlin Aging Study data revealed that successful aging was relatively free from the effects of social class. Certainly, because of more disease due to lessened self-care and access to medical care, the socially disadvantaged are less likely to survive until age 75. But having reached 75, the cohort-to-cohort decline in mental and physical functioning was no more rapid for the disadvantaged than for more privileged individuals. Between ages 70 and 100, there was a 30% decline in “fluid” intelligence (e.g., memory and digit symbol substitution), but the predictors of this decline were impaired visual and hearing acuity and not past social disadvantage.
When examiners used a global definition of successful aging at age 75, 80% of the Berlin Aging Study cohort were still considered in “good health” (cognitively fit, active, and involved in life) or in “average health” (relatively healthy, still independent, and satisfied with life). At age 95, this level of health was still maintained by 30% of the subjects. These figures would have been significantly better had those with “terminal decline” been excluded. For example, the average centenarian lives without major disability until age 97 (12)!
Among the healthy old-old, it is increasing fatigability and reduced vision and hearing that lead most commonly to impairment—not dementia or the often cited but largely irrelevant 10% increase in reaction time (20). Perhaps the most inevitable consequence of aging is an inexorable decline in vital capacity and in the efficiency of oxygen utilization. This decline begins at age 20 and steadily declines, reaching the 50% mark by age 75 (21).
The shifts in coping strategies of elderly people in the Berlin Aging Study between ages 70 and 95 were fascinating (10). With increasing age, spirituality and serenity increase. By “serenity” we mean faith, acceptance, and allowing someone else to take over. The strategies of “giving up” or of information seeking were more common among the young-old, whereas the more “Buddhist” strategy of perceiving life as “being without meaning” was preferred by the old-old. Coping strategies that did not change between ages 70 and 90 were humor and comparing oneself with others more severely afflicted.
The two most important psychosocial predictors of successful aging were high level of education (which probably reflects traits of self-care and planfulness as much as social class) and having an extended family network. In a hierarchical regression model, the important correlates of poor aging (defined as dependence, dissatisfaction with living, and being bedridden) were trouble walking, poor vision, age per se, depression, and dementia (10). In contrast, variables commonly construed as important to poor aging from ages 50–70 (e.g., emphysema, arthritis, loss of a partner, and diabetes) were no longer salient. Indeed, because of selective survival after age 85, only one person in two suffered from significant arteriosclerotic heart disease.
A Prospective Study of Successful Aging
In 1948 the World Health Organization defined health not as the absence of illness but as the presence of well-being—physical, mental, and social (22). In order to offer a heuristic model of successful aging for the 21st century, we shall draw on the Study of Adult Development at Harvard University, which prospectively followed two socially diverse cohorts of adolescents (a college cohort and a core-city cohort) until they became great-grandfathers. In this study the complexity of aging will be simplified by holding gender (male), nationality (United States), and skin color (white) constant. Birth cohort was confined to the period 1918–1932; nevertheless, the college cohort has enjoyed the same longevity as white males born in 2000. Contrast will be achieved by looking at similarities between, and differences within, these two demographically different cohorts. Physically and mentally healthy college septuagenarians and core-city sexagenarians, the happy-well, will be contrasted with the sad-sick and the prematurely dead.
To define well-being in old age, we chose six domains of function that permitted classifying the old along a continuum stretching from the happy-well to the sad-sick. Between the two poles, of course, were individuals whose outcome was mixed. The first domain was physician-assessed objective physical health and absence of irreversible physical disability. The second domain was subjective physical health. Do octogenarians allege that they can still carry out most instrumental tasks of daily living (e.g., yard work, climbing stairs, walking 2 miles) as before, albeit more slowly?
The third, more longitudinal, domain was length of active life. This was defined as the number of years before age 80 or age 70 that an individual had survived without either objective or subjective physical disability. The fourth domain was objective mental health. This domain reflected objective evidence of competence in four areas: work, relationships, play, and the absence of need for psychiatric care or medication. The fifth domain was subjective life satisfaction. Over the last 20 years, had the person reported subjective satisfaction in multiple facets of his or her life (e.g., marriage, job, children, and friendship)? The sixth domain was social supports. Was there objective evidence of friends? Was the individual’s satisfaction with spouse and children mutual?
Individuals who did well in all six areas until age 80 were be classified as happy-well; those who were both psychosocially unhappy and physically disabled were classified as sad-sick. Those who fell in between were classified as intermediate.
Until now we have not known how to predict successful aging. True, there have been several prospective studies of aging. Well-known examples include the Duke Longitudinal Studies of Normal Aging (23), the Baltimore Longitudinal Study of Aging (24), the Bonn Longitudinal Study (25), the Seattle Longitudinal Study of Intellectual Aging (26), and the Veterans Affairs Normative Aging Study (27). All have contributed valuable understanding about the course of old age, but each of these studies was flawed by “selective mortality” (28). By beginning late in life, these studies failed to include those who died before age 60 or 70. As Baltes and Baltes (8) pointed out, “In the field of psychological gerontology, research has not yet reached a stage where there is good causal evidence about predictor variables including knowledge about the role of risk and protective factors” (p. 16). The Study of Adult Development provides a way around some of these difficulties.
Method
The college cohort in the study included 268 Harvard sophomores selected for physical and mental health circa 1940 (29, 30). The socially disadvantaged core-city cohort included 456 nondelinquent schoolboys with a mean IQ of 95 and a mean education of 10 years (31, 32). The details of the study have been well described in previous reports (33–37).
Independent predictor variables (assessed before age 50) were the following:
1. Smoking: In pack-years from age 15–50.
2. Alcohol abuse: DSM-III criteria were used; 0=no abuse, 1=alcohol abuse or dependence.
3. Body mass index (kg/m2): At age 50, men with a body mass index >28.00 (overweight) or <22.00 (underweight)=2; men with body mass index <28.01 and >21.99 (optimal weight)=1.
4. Years of education: Used only for core-city men because the range of education for the college men was truncated.
5. Some regular exercise (college men only): Exercise that burned more than 500 kilocalories/week (38); 1=yes, 2=no.
6. Stable marriage: 1=married without divorce, separation, or serious problems until age 50; otherwise=2.
7. Maturity of defenses: Defenses are involuntary mental mechanisms that adaptively alter inner or outer reality in order to minimize distress. Mature (adaptive) defenses were defined as suppression, humor, altruism, anticipation, and sublimation; immature (maladaptive) defenses were defined as projection, schizoid fantasy, acting out, passive aggression, dissociation, and hypochondriasis. For each man, the mean maturity of defensive behaviors, largely identified from the age of 47 (SD=2) by interview, were scored on a 9-point scale consistent with the DSM-IV Defensive Functioning Scale on which 1=most adaptive and 9=most maladaptive. The method is described elsewhere (39); 1=mature defenses present scored 1–3; 2=mature defenses absent scored 4–9.
8. Depression: A clinician reviewing men’s entire records before age 50, including interviews, felt there was reasonable evidence of a major depressive disorder (40); 0=no, 1=yes.
9. Parental social class: Scaled from upper class=1 to unskilled laborer or on welfare=5 (41).
10. Warmth of childhood (until age 18 for college men; until age 14 for core-city men): Two research assistants who were blind to all later data rated five facets of the men’s childhood environmental strengths (global impression, family cohesion, and relations with mother, father, and siblings) on scales from 1–5; 5=warmest environment and 25=bleakest environment (42).
11. Ancestral longevity: For the college men, this was the mean age at death of the oldest parent or grandparent on both the mother’s and father’s sides; for the core-city men, this was the mean mother’s and father’s age at death (43).
12. Stable childhood temperament: Parental report of childhood temperament; 1=easy baby and toddler, 3=minor problems, 5=phobias, shyness, tantrums, enuresis (42).
13. Objective disability (age 50): Rated using the same 4-point scale for physician-rated objective physical health that is defined in the next section; 1=no irreversible disability, physical health rated 1–3; 2=physical health rated 4 (irreversible disability).
The six outcome domains (assessed at ages 75–80 for the college cohort and ages 65–70 for the core-city cohort, i.e., the dependent variables) were as follows:
1. Objective physical health: Every 5 years, the study sought from each man a complete physical examination, including chest X-rays, routine blood chemistries, urinalysis, and an ECG (44). A study internist who was blind to the patients’ psychosocial adjustment rated these examinations on a 4-point scale on which 1=without any irreversible illness, 2=minor irreversible illness that was neither life shortening nor disabling (e.g., treatable glaucoma, reversible hypertension, or noncrippling arthritis), 3=irreversible life-threatening illness (e.g., coronary thrombosis or diabetes), and 4=irreversible illness with significant disability (e.g., multiple sclerosis, chronic congestive heart failure). A score of 4=objective irreversible disability present.
2. Subjective physical health: A 14-point questionnaire (scored 1–14), similar to question 6 on the SF-36 (19) was administered every 2 years; it inquired whether the men could still climb two flights of stairs or walk 2 miles without resting, drive, care for the yard, and travel and shop without assistance, etc. (40). A score of 5–14=subjective disability present.
3. Years of active life: The age that a man first became irreversibly disabled, either objectively or subjectively.
4. Objective mental health (range=9 [best] to 21 [worst]): Independent raters assessed the men’s lives from age 50 until age 65 on nine items: 1) quality of marriage, 2) job success, 3) job satisfaction, 4) no early retirement, 5) vacation of 3 weeks or more, 6) social activities, 7) no use of psychiatrists, 8) no use of tranquilizers, 9) overall rater impression (36). A score of 15–21=mental health rating in worst quartile.
5. Subjective life satisfaction (range 10 [best] to 40 [worst]): At age 75 (SD=2) the college men and at age 65 (SD=2) the core-city men were asked to rate their degree of satisfaction on a 5-point scale in four life areas over the past 20 years (marriage, children, job or retirement, and friends). To this was added their best score from one out of four additional areas (hobbies, sports, community activities, or religious participation) (37). A score of 18–32=life satisfaction rating in worst third.
6. Objective social supports (range=2.5 [best] to 14.0 [worst]): Independent raters reviewed information from seven biennial questionnaires and also those from wives and children and usually one 2-hour interview. The college men were assessed on seven facets of social support: closeness to wife, children, siblings, “playmates” (e.g., bridge and golf), religious affiliation, social networks (e.g., country clubs, civic organizations), and confidantes (37). This variable was not available for the core-city group. A score of 10.5–14.0=social supports rating in worst quartile.
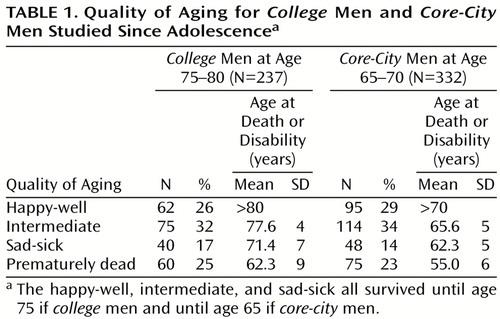
In addition, successful aging was assessed with a global measure at circa age 80 for college men and at circa age 70 for core-city men; 1=happy-well: survival to age 75 (college men) or 65 (core-city men), no objective or subjective physical disability, objective psychosocial adjustment in top three-quarters, subjective life satisfaction in top two-thirds, and (college men only) social supports in top three-quarters; (Cutoff points adjusted to capture one-quarter of each cohort.) 2=intermediate: survival with either subjective or objective physical disability but without psychosocial disability (i.e., bottom third in life satisfaction or bottom quarter in mental health or in social supports) or survival with psychosocial disability but without physical disability; 3=sad-sick: survival with 5 or more years of objective or subjective physical disability and psychosocial adjustment in bottom quarter or life satisfaction in bottom third or (college men only) social supports in bottom quartile; 4=prematurely dead: dead before age 75 (college men) or before 65 (core-city men). (Among the happy-well, one college man died between ages 75 and 79, and no happy-well core-city men died between ages 65 and 69. In contrast, among the sad-sick, seven college men and six core-city men died between ages 75 and 79.)
Results
In order to assess the predictors of successful aging, we needed relatively complete data sets at age 50. By that point, the college cohort had shrunk from 268 to 237 because of 12 deaths (six killed in action in World War II) before age 45 and 19 withdrawals. The core-city cohort had shrunk from 456 to 332 because of 33 deaths before age 45 and 91 men who had withdrawn or had incomplete data sets. The withdrawn men did not differ from the active members except that among the core-city cohort, they were more likely to come from a multiproblem childhood, have a lower IQ, and have more limited education. It was not surprising that war, homicides, suicides, and accidents accounted for the majority of deaths among the men excluded because of early mortality.
Length-of-active-life data for the youngest men in the study were missing. When this article was written (2000), 6% of the college men (N=14) were still aged 76–77, 34% (N=81) were aged 78–79, and 14% of the core-city men (N=46) were aged 68 or 69. When age was statistically controlled, the relationships presented in this article were not affected.
Table 1 illustrates that the distribution of the four categories of aging (happy-well, intermediate, sad-sick, and prematurely dead) were proportionately the same for college men at age 75 and for core-city men at age 65. Figure 1 illustrates the increase in physical disability and death for the two groups over time. The slopes are quite similar, but the college cohort reached every stage of death and disability about 10 years later than the core-city cohort. For example, at age 65, 25% of the core-city men were dead, and 20% were disabled; at age 75, 27% of the college men were dead, and 14% were disabled (Figure 1).
However, despite great differences in parental social class, prestige of college, intelligence test scores, current income, and job status, the health decline of the 25 core-city men (7.5% of all core-city men) who completed 16 or more years of education was no more rapid than that of the college men. In other words, education may have been a more robust cause of the differences between the rate of health decline in the two cohorts than other differences in socioeconomic status.
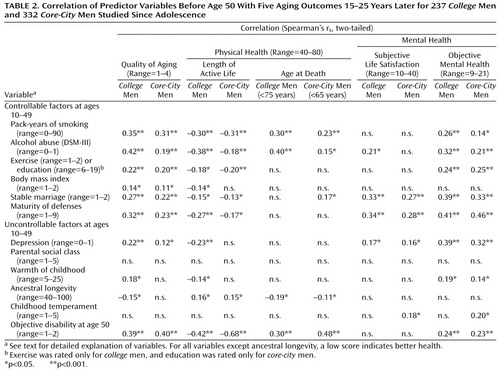
Table 2 illustrates the ability of 13 variables measured before age 50 to predict successful aging and four of its principle domains. Table 2 arranges the protective factors in terms of self-care variables over which an individual has some personal control, and those variables, such as heredity and parents, over which an individual is relatively powerless. For both the college and the core-city men, absence of alcohol and cigarette abuse (less than 30 pack-years) before age 50 were arguably the most important protective factors for successful aging. Subjective life satisfaction was the only outcome domain not significantly affected.
Although the educational range was too truncated to be relevant in the college men, and exercise was not assessed for the core-city men, both variables (which apart from their face value are each indirect measures of self-care and perseverance) appeared to be important predictors of multiple domains of successful aging. As an illustration of the predictive power of perseverance (and the adaptive defense mechanism of suppression), at age 19, 61% (38 of 62) of the college men who were classified as happy-well six decades later, but only 13% (5 of 40) of the sad-sick men were able to complete the full 5 minutes of a treadmill test (χ2=10.7, df=2, p=0.005). The findings could not be explained by physical fitness (45) at the time.
Mature (adaptive) defenses from age 20–50 were an important predictor of successful psychosocial aging, but the maturity of defenses was quite irrelevant to objective, although not to subjective, physical disability. Before age 50, almost two-thirds of the happy-well men in both groups, and only one-10th of the sad-sick men had used mature defenses, especially humor, suppression, and anticipation, rather than immature defenses, especially projection and dissociation.
As Table 2 shows, three other protective variables assessed before the age of 50 were independent predictors of successful aging. These three variables were a warm marriage, absence of major depressive disorder, and, predictably, good physical health at age 50. Body mass index, ancestral longevity, and the two childhood variables (environmental warmth and temperament) were only marginally significant in univariate analyses.
Next, an effort was made to assess the ability of the protective factors—factors over which the individual has some control—to predict the future. To control for the deleterious effect that poor health might have exerted on the six protective factors, we excluded all men who by age 50 were disabled or even chronically ill. The absence of these protective factors (with the exception of a stable marriage and mature defenses) was just as important in predicting which men would be among the prematurely dead as among the sad-sick. For example, among college men still in good health at age 50 were 66 men with fewer than four protective factors. At age 80, 50 of these 66 men were among the sad-sick or prematurely dead, and not even one man was among the happy-well. In contrast, 44 college men had all six factors present; 25 were among the happy-well, and only one was among the sad-sick. There were 69 core-city men with five or six factors present; 35 were among the happy-well, and only one was among the sad-sick.
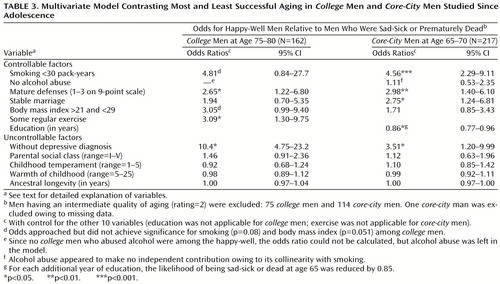
Table 3 demonstrates that each of the six protective factors over which an individual has some control predicted successful aging when the other predictive factors were statistically controlled. The confounder of poor prior physical health was controlled by excluding from the analysis reported in Table 3 all men who by age 50 were irreversibly chronically ill or disabled. (Including these men did not significantly alter the results.) The importance of alcohol abuse for the core-city cohort and the importance of smoking for the college cohort were masked by collinearity with the other variable. Among the uncontrollable factors, parental social class, unhappy childhood, and ancestral longevity were not significant. Only depressive disorder before age 50 appeared to be an independent predictor.
Years of education are more often perceived as a reflection of socioeconomic status and intelligence than as a reflection of self-care. Therefore, we used the same logistic regression procedure as in Table 3> to model the effects of parental social class (range=II–V), IQ (assessed by an individually administered WAIS in junior high school; range=61–130), and years of education to predict whether core-city men aged 65–70 were among the happy-well or the sad-sick/dead. Only education was significant (odds ratio=0.79, 95% confidence interval=0.71–0.88, p<0.0001). A surprising finding was that former cigarette and alcohol abuse explained most of the strong association between physical health and social supports.
Discussion
Although the narrowness of our cohorts limits generalization, the data are offered in a spirit of a heuristic schema of successful aging for the new millennium. The intent is not to test a specific hypothesis as much as to offer a testable model for successful aging and to highlight solutions to problems that have compromised prior studies.
First, a major problem in understanding the relevance of protective or risk factors for successful aging is selective advocacy of one factor at the expense of others. All of the 13 putative predictors in Table 2 except social class were significant, but many predictors were affected by the others. For example, the putative risk factors of low education, depression, and alcohol abuse each increased the likelihood of sustained smoking (46). Similarly, alcohol abuse not only damages the liver, heart, and immune system (47), but it increases the risk of depression and divorce. The problem becomes where to put causal emphasis. In various prior studies, each of the following factors has been treated as critical, whereas other equally important factors were ignored: cholesterol level and smoking (48), depression (49), exercise (50), social supports (51), job status (52), body mass index (3), and alcohol abuse (53). In order to separate cause from association, however, all the confounding variables must be simultaneously studied.
A second problem in aging studies is confusion about causal direction. Social supports (3) are often assigned a causal role in successful aging. However, in their classic review of the evidence that social supports cause good health, House et al. (54) acknowledged that almost no attention had been paid to social supports as a dependent variable. In our prolonged prospective study, social supports at age 70 were powerfully affected by the pre-age-50 protective factors identified in Table 3. Good social supports in old age may be in large part a result of the same earlier good habits that preserve physical health.
A third problem inherent in prior studies is that the relative importance of predictor variables changes over time (55). Unhappy childhood predicted poor health in the college cohort at age 50 but not at age 80 (44). Serum cholesterol levels are an important predictor of heart disease in young adults (48), but in our two elderly cohorts, cholesterol levels at age 50 were identical for the happy-well and for the sad-sick/dead. More representative samples also suggest that after age 70 elevated cholesterol levels are not a general risk factor (56). Shortened ancestral longevity is a risk factor for men dying between ages 40 and 60, but most people die after age 60. Thus, Rowe and Kahn (3) have reported, “Our MacArthur twin studies leave very substantial room for factors other than genetics in determining life expectancy” (p. 28). Investigators using the Swedish Twin Registry noted “that most of the variance in longevity was explained by environmental factors” (57).
A fourth problem is that until recently most major longitudinal studies of health, for example, the Framingham Study (48) and the Alameda County Study (58), have only controlled for reported alcohol consumption. Unfortunately, because of “dieting” and underreporting, alleged alcohol consumption is almost as poor an index of alcohol abuse as reported food consumption is for obesity.
As a caveat, we must acknowledge that we, too, have ignored important risk variables (e.g., minority status, nutrition [59], insurance status [60], and occupational status [52]). In addition, the cohort is very narrow: white American men born principally in the 1920s. Our findings require confirmation in other populations, especially women and men of color.
However, unlike sociological science, biological science is built on diverse studies of homogeneous subspecies, not random surveys of Noah’s ark. Thus, Table 3 may still contain a hopeful message for young adults destined by actuarial tables to live past age 80. The seven protective factors that distinguish the happy-well from the sad-sick are under at least some personal control. We have considerable control over our weight, our exercise, our education, and our abuse of cigarettes and alcohol. With hard work and/or therapy, our relationship with our spouse and our coping styles can be modified. A successful old age, Horatio, may lie not so much in our stars and genes as in ourselves.
 |
 |
 |
Received May 30, 2000; revisions received Oct. 2 and Nov. 13, 2000; accepted Dec. 20, 2000. From the Department of Psychiatry, Brigham and Women’s Hospital; the Department of Medicine, Beth Israel Deaconess Medical Center, Boston; and Harvard University Health Services, Cambridge, Mass. Address correspondence to Dr. Vaillant, Department of Psychiatry, Brigham and Women’s Hospital, 75 Francis St., Boston, MA 02115; [email protected] (e-mail). Supported by research grants MH-00364 and MH-42248 from NIMH and grant AA-00299 from the National Institute on Alcohol and Alcohol Abuse.

Figure 1. Rates of Permanent Disabilitya or Death After Age 50 for College Men, Core-City Men, and Core-City College GraduatesbStudied Since Adolescence
aIrreversible physical illness with significant disability
bThe 25 core-city men who graduated from college are shown both as an individual cohort and as part of the larger core-city cohort. The data point at age 70, marked with an open circle, includes only the oldest 21 college-educated core-city men, with a mean age of 69.5. Four men born after 1930 were excluded.
1. Fries JF: Aging, natural death, and the compression of morbidity. N Engl J Med 1980; 303:130–135Crossref, Medline, Google Scholar
2. Suzman RM, Willis DP, Menton KP: The Oldest Old. New York, Oxford University Press, 1992Google Scholar
3. Rowe JW, Kahn RL: Successful Aging. New York, Dell, 1999Google Scholar
4. Doty RL, Shaman P, Applebaum SL, Giberson R, Siksorski L, Rosenberg L: Smell identification ability: changes with age. Science 1984; 226:1441–1443Google Scholar
5. Woodruff-Pak DS: Neuropsychology of Aging. Malden, Mass, Blackwell, 1997Google Scholar
6. US Bureau of the Census: Statistical Abstract of the United States, 1990. Washington DC, US Government Printing Office, 1990Google Scholar
7. Carstensen LL: Social and emotional patterns in adulthood: support for socioemotional selectivity theory. Psychol Aging 1992; 7:331–338Crossref, Medline, Google Scholar
8. Baltes PB, Baltes MM (eds): Successful Aging: Prospectives From the Behavioral Sciences. Cambridge, UK, Cambridge University Press, 1990Google Scholar
9. Benes FM: Brain development, VII: human brain growth spans decades (image). Am J Psychiatry 1998; 155:1489Link, Google Scholar
10. Baltes PB, Mayer KV (eds): The Berlin Aging Study. Cambridge, UK, Cambridge University Press, 1999Google Scholar
11. Bortz WM 2nd, Wallace DH, Wiley D: Sexual function in 1,202 aging males: differentiating aspects. J Gerontol A Biol Sci Med Sci 1999; 54A:M237–M241Google Scholar
12. Perls TT, Silver MH: Living to 100. New York, Basic Books, 1999Google Scholar
13. Schaie KW: The optimization of cognitive functioning in old age, in Successful Aging. Edited by PB Baltes, MM Baltes. Cambridge, UK, Cambridge University Press, 1990, pp 94–117Google Scholar
14. Schaie KW: The course of adult intellectual development. Am Psychol 1994; 49:304–313Crossref, Medline, Google Scholar
15. Blazer DG, Hughes DC, George LK: The epidemiology of depression in an elderly community population. Gerontologist 1987; 27:281–287Crossref, Medline, Google Scholar
16. Diener E: Subjective well-being. Psychol Bull 1984; 95:542–575Crossref, Medline, Google Scholar
17. Diener E, Suh EM, Lucas RE, Smith HL: Subjective well-being: three decades of progress. Psychol Bull 1999; 125:276–302Crossref, Google Scholar
18. Bengston VL, Cuellar JB, Ragan PK: Stratum contrasts and similarities in attitudes toward death. J Gerontol 1977; 32:76–88Crossref, Medline, Google Scholar
19. Ware JE: SF-36 Health Survey. Boston, Nimrod Press, 1993Google Scholar
20. Wilkinson RT, Allison S: Age and simple reaction time: decade differences for 5,325 subjects. J Gerontol Psychol Sci 1989; 44:29–35Crossref, Google Scholar
21. Goldberg AP, Dengel DR, Hagberg JM: Exercise physiology and aging, in Handbook of Biology of Aging. Edited by Schneider EL, Rowe JW. San Diego, Academic Press, 1996, pp 331–354Google Scholar
22. World Health Organization: Constitution of the World Health Organization, in World Health Organization Handbook of Basic Documents, 5th ed. Geneva, WHO, 1952, pp 3–20Google Scholar
23. Busse EW, Maddox GL: The Duke Longitudinal Studies of Normal Aging:1955–1980. New York, Springer, 1988Google Scholar
24. Shock NW: Normal Human Aging, NIH Publication No. 84-2450. Washington, DC, US Government Printing Office, 1984Google Scholar
25. Thomae H: Conceptualizations of responses to stress. Eur J Personality 1987; 1:171–191Crossref, Google Scholar
26. Schaie KW: The Seattle Longitudinal Study: a 21-year exploration of psychometric intelligence in adulthood, in Longitudinal Studies of Adult Psychological Development. Edited by Schaie KW. New York, Guilford Press, 1983, pp 64–135Google Scholar
27. Bosse R, Aldwin CM, Levenson MR, Workman-Daniels K: How stressful is retirement? findings from the Normative Aging Study. J Gerontol Psychol Sci 1991; 46:9–14Crossref, Google Scholar
28. Rowe JW: Clinical research on aging: strategies and directions. Science 1977; 197:1332–1336Google Scholar
29. Heath C: What People Are. Cambridge, Mass, Harvard University Press, 1945Google Scholar
30. Vaillant GE: Adaptation to Life. Boston, Mass, Little Brown, 1977Google Scholar
31. Glueck S, Glueck E: Unraveling Juvenile Delinquency. New York, Commonwealth Fund, 1950Google Scholar
32. Glueck S, Glueck E: Delinquents and Nondelinquents in Perspective. Cambridge, Mass, Harvard University Press, 1968Google Scholar
33. Vaillant GE: Natural History of Alcoholism Revisited. Cambridge, Mass, Harvard University Press, 1995Google Scholar
34. Vaillant GE: Adaptive mental mechanisms. Am Psychol 2000; 55:89–98Crossref, Medline, Google Scholar
35. Vaillant GE, Milofsky E: Natural history of male psychological health, IX: empirical evidence for Erikson’s model of the life cycle. Am J Psychiatry 1980; 137:1348–1359Google Scholar
36. Vaillant GE, Vaillant CO: Natural history of male psychological health, XII: a 45-year study of successful aging at age 65. Am J Psychiatry 1990; 147:31–37Link, Google Scholar
37. Vaillant GE, Meyer SE, Mukamal K, Soldz S: Are social supports in late midlife a cause or a result of successful physical aging? Psychol Med 1998; 28:1159–1168Google Scholar
38. Schnurr PP, Vaillant CO, Vaillant GE: Predicting exercise in late midlife from young adult personality characteristics. Int J Aging Hum Dev 1990; 30:153–161Crossref, Medline, Google Scholar
39. Vaillant GE: Ego Mechanisms of Defense: A Guide for Clinicians and Researchers. Washington DC, American Psychiatric Press, 1992Google Scholar
40. Vaillant GE, Orav J, Meyer SE, McCullough L, Roston D: Late-life consequences of affective spectrum disorder. Int Psychogeriatr 1996; 8:13–32Crossref, Medline, Google Scholar
41. Hollingshead AB, Redlich FC: Social Class and Mental Illness: A Community Study. New York, John Wiley & Sons, 1958Google Scholar
42. Vaillant GE: The natural history of male psychological health, II: some antecedents of healthy adult adjustment. Arch Gen Psychiatry 1974; 31:15–22Crossref, Medline, Google Scholar
43. Vaillant GE: The association of ancestral longevity with successful aging. J Gerontol 1991; 46:292–298Crossref, Google Scholar
44. Vaillant GE: Natural history of male psychologic health: effects of mental health on physical health. N Engl J Med 1979; 301:1249–1254Google Scholar
45. Phillips KA, Vaillant GE, Schnurr P: Some physiologic antecedents of adult mental health. Am J Psychiatry 1987; 144:1009–1013Google Scholar
46. DiFranza JR, Guerrera MP: Alcoholism and smoking. J Stud Alcohol 1990; 51:130–135Crossref, Medline, Google Scholar
47. Irwin M, Caldwell C, Smith TL, Brown S, Schuckit M, Gillin JC: Major depressive disorder, alcoholism, and reduced natural killer cell cytotoxicity: role of severity of depressive symptoms and alcohol consumption. Arch Gen Psychiatry 1990; 47:713–719Crossref, Medline, Google Scholar
48. Dawber TR: The Framingham Study. Cambridge, Mass, Harvard University Press, 1980Google Scholar
49. Frasure-Smith N, Lesperance F, Talajic M: Depression and 18-month prognosis after myocardial infarction. Circulation 1995; 91:999–1005Google Scholar
50. Paffenbarger RS, Hyde RT, Wing AL, Lee IM, Jung DL, Kampert JB: The association of changes in physical-activity level and other lifestyle characteristics with mortality among men. N Engl J Med 1993; 328:538–545Crossref, Medline, Google Scholar
51. House JS, Robbins C, Metzner HL: The association of social relationships and activities with mortality: prospective evidence from the Tecumseh Community Health Study. Am J Epidemiol 1982; 116:123–140Crossref, Medline, Google Scholar
52. Marmot MG, Smith GD, Stansfeld S, Patel C, North F, Head J, White I, Brunner E, Feeney A: Health inequalities among British civil servants: the Whitehall II study. Lancet 1991; 337:1387–1393Google Scholar
53. Vaillant GE, Schnurr PP, Baron JA, Gerber PD: A prospective study of the effects of cigarette smoking and alcohol abuse on mortality. J Gen Intern Med 1991; 6:299–304Crossref, Medline, Google Scholar
54. House JS, Landis KR, Umberson D: Social relationships and health. Science 1988; 248:540–545Crossref, Google Scholar
55. Melström D: A longitudinal and cross-sectional gerontological population study in Gothenburg, in Aging, Health and Competence: The Next Generation of Longitudinal Research. Edited by Schroots JJF. Amsterdam, Elsevier, 1993, pp 127–141Google Scholar
56. Krumholz HM, Seeman TE, Merrill SS, Mendes de Leon CF, Vaccarino V, Silverman DI, Tsukahara R, Ostfeld AM, Berkman LF: Lack of association between cholesterol and coronary heart disease mortality and morbidity and all-cause mortality in persons older than 70 years. JAMA 1994; 272:1335–1340Google Scholar
57. Ljungquist B, Berg S, Lanke J, McClearn GE, Pedersen NL: The effect of genetic factors for longevity: a comparison of identical and fraternal twins in the Swedish Twin Registry. J Gerontol A Biol Sci Med Sci 1998; 53A:M441–M446Google Scholar
58. Berkman LF, Breslow L: Health and Ways of Living: The Alameda County Study. New York, Oxford University Press, 1983Google Scholar
59. Chandra RK: Effect of vitamin and trace element supplementation on immune responses and infection in elderly subjects. Lancet 1992; 340:1124–1127Google Scholar
60. Ware JE Jr, Bayliss MS, Rogers WH, Kosinski M, Tarlov AR: Differences in 4-year health outcomes for elderly and poor, chronically ill patients treated in HMO and fee-for-service systems: results from the Medical Outcomes Study. JAMA 1996; 276:1039–1047Google Scholar