Morphology of the Cerebral Cortex in Preclinical Huntington’s Disease
Abstract
Objective: Cortical morphology was evaluated in subjects with known gene expansion for Huntington’s disease and no manifest disease. Method: Magnetic resonance imaging scans were obtained for 24 subjects with preclinical Huntington’s disease and were compared to those for 24 matched healthy subjects by means of novel imaging methods to quantify aspects of cortical structure. Results: In relation to the comparison subjects, those with preclinical Huntington’s disease showed altered cortex morphology with enlargement of gyral crowns and abnormally thin sulci. These changes were manifested in global alterations of gyral and sulcal shape. Conclusion: These findings lend support to the notion that, in addition to the degenerative process, abnormal neural development may also be an important process in the pathoetiology of Huntington’s disease.
Huntington’s disease is described as a triad of motor, cognitive, and emotional abnormalities. The onset of this dominantly inherited disease is defined clinically by the presence of motor abnormalities, including dyskinesias, oculomotor signs, rigidity, bradykinesia, difficulty with alternating movements, gait changes, and hyperreflexia. However, many subjects experience cognitive and/or psychiatric symptoms before the onset of abnormal movements (1) . Much of the neuroimaging research done to further the understanding of the neurobiology of this disease has focused on abnormalities of the striatum, particularly the caudate and the putamen. Although fewer in number, the imaging studies that have evaluated the structure of extrastriatal regions in subjects with Huntington’s disease have consistently shown the cerebral white matter volume to be significantly lower than normal while the cerebral gray matter is relatively spared (2 – 5) .
The ability to accurately test for the expanded CAG repeat in the gene that causes Huntington’s disease has provided a unique opportunity to study the illness in the earliest stages of the disease. That is, we now have the ability to study subjects who are gene positive (i.e., have the CAG expansion) but have not yet manifested motor symptoms of the disease and have therefore not yet been clinically diagnosed as having Huntington’s disease. These subjects are known as having presymptomatic or preclinical Huntington’s disease. In a study designed to examine the morphology of the entire brain in individuals with preclinical Huntington’s disease, Thieben et al. used voxel-based morphometry and identified only two cortical regions—the insula and the intraparietal sulcus—that showed significantly lower gray matter intensity in subjects with preclinical Huntington’s disease than in healthy comparison subjects (6) . Taken together, the neuroimaging studies in patients with Huntington’s disease and those with presymptomatic illness suggest that early in the course of the disease, cortical degeneration is limited and most likely regionally specific.
In concurrent studies in our neuroimaging laboratory, results have both confirmed and extended the current body of literature on imaging in Huntington’s disease. In a study of subjects with early disease (soon after clinical diagnosis), patients had significantly lower cerebral white matter volume than matched healthy subjects, while the volume of the cerebral cortex did not differ between the two groups (3) . Moreover, in a study of subjects with preclinical Huntington’s disease, their cerebral white matter volume was substantially lower, and their cerebral cortex volume was significantly higher, than those of matched comparison subjects (7) . These findings support the theory of a possible neurodevelopmental component to the pathophysiology of Huntington’s disease in which the process of brain development is altered, producing morphologic abnormalities (enlargement of the cortex) before the onset of the neurodegenerative processes of the disease.
The cerebral cortex is a complicated structure with a high degree of gyrification, especially in contrast to other species. It presents its own distinctive and intricate measures of structure, including surface area, cortical thickness, and sulcal and gyral shape. Quantitative measures of cortical morphology can potentially provide important information in regard to both normal brain processes (development, aging) and pathologic processes. The current study was designed as a follow-up study of our previous study in preclinical Huntington’s disease (7) . Specifically, we sought to evaluate the detailed morphology of the cerebral cortex by using a unique postprocessing method that generates quantitative measures of cerebral surface anatomy. These measures were obtained in a group of subjects with preclinical Huntington’s disease previously shown to have abnormally large volumes of the cerebral cortex in relation to those of healthy comparison subjects.
Method
Subjects
The current study is an extended analysis of a previous imaging study reported by our group (7) . The previous study reported on general and regional quantitative brain measures of the cerebrum and subcortical regions. The current study used the same group of subjects and comparison subjects, using an additional image-processing method that allows for quantitative measures of cerebral cortex morphology. Participants who had previously undergone elective presymptomatic genetic testing and been found to have the Huntington’s disease gene expansion (39 or more CAG repeats) were recruited from the Huntington’s Disease Registry at the University of Iowa. Subjects were excluded if they had a diagnosis of manifest Huntington’s disease, a history of learning disorder or mental retardation, unstable medical illness, a history of alcohol or drug abuse within the previous year, or history of other CNS disease. Magnetic resonance imaging (MRI) scans of healthy subjects were obtained from a database of the Mental Health Clinical Research Center at the University of Iowa. Healthy volunteers in this database are recruited from the community by newspaper advertising and screened according to exclusion criteria that are identical to those just described for the participants with preclinical Huntington’s disease. All participants signed a written informed consent statement approved by the University of Iowa institutional review board before enrollment and completion of the study.
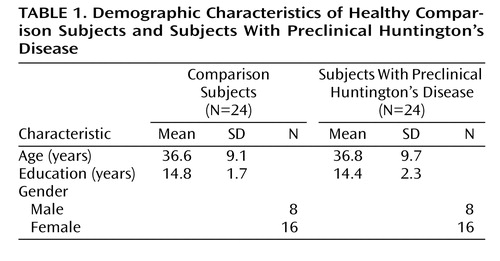
The determination of diagnosis for this study adhered to the traditional neurological definition (emergence of chorea) and was based on the motor assessment summary item from the Unified Huntington’s Disease Rating Scale (8) , administered by a neurologist (H.P.). Diagnostic confidence is rated as 0 (normal; no abnormalities), 1 (nonspecific motor abnormalities), 2 (motor abnormalities that may be signs of Huntington’s disease), 3 (motor abnormalities that are likely signs of Huntington’s disease), or 4 (motor abnormalities that are unequivocal signs of Huntington’s disease). The mean diagnostic confidence rating for the current study group was 1.1 (SD=0.8). The definition of a presymptomatic subject (symptom free) versus a subject with preclinical Huntington’s disease (before the onset of diagnosis) is an important distinction. The subjects in the current study had preclinical Huntington’s disease, a diagnosis based on the presence of a CAG repeat expansion of 39 or above and the absence of significant motor signs that would suggest current manifestation of disease. As evidenced by the average motor rating of the study group (mean=1.1), some patients had very mild, nonspecific motor symptoms, yet no patient manifested enough symptoms to fulfill the criteria for a diagnosis of Huntington’s disease. Table 1 summarizes demographic data for both study groups.
MRI Acquisition
Images were obtained on a 1.5-T GE Signa MR scanner (GE Medical Systems, Milwaukee). Three different sequences were acquired for each participant: T 1 - and T 2 -weighted images and images weighted for proton density (PD). The T 1 -weighted images, made by using a spoiled GRASS (gradient-recall acquisition in the steady state) sequence, were acquired with the following conditions for the comparison subjects: 1.5-mm coronal slices, 40° flip angle, 24-msec TR, 5-msec TE, two excitations, 26-cm field of view, and 256×192 matrix. As the comparison scans were obtained from an existing database, the scanning sequence for the subjects with preclinical Huntington’s disease differed slightly, but only for the T 1 -weighted sequence. This sequence was identical except that it was collected in an axial orientation under the following conditions: 20° flip angle, 18-msec TR, 3-msec TE, and 24-cm field of view. The PD-weighted and T 2 -weighted images were acquired for all 48 subjects with the following variables: 3.0-mm coronal slices, 36-msec TE (for PD-weighted images) or 96-msec TE (for T 2 -weighted images), 3000-msec TR, one excitation, 26-cm field of view, 256×192 matrix, and echo train length of 1. The comparability of these two sequences was studied by using a group of healthy subjects (N=5), each scanned with the sequence used for the comparison scans and again with the sequence used for the subjects with preclinical Huntington’s disease. In a simple comparison of measures (comparison sequence – preclinical Huntington’s disease sequence), surface area, depth, and sulcal curvature were, on average, slightly larger in the comparison sequence than in the sequence used for the subjects with preclinical Huntington’s disease (difference in cerebral surface area: mean=+0.22%, SD=1.35; difference in sulcal depth: mean=+0.078 mm, SD=0.222; difference in gyral depth: mean=+0.139 mm, SD=0.046; difference in sulcal curvature: mean=+4.09%, SD=3.58; difference in gyral curvature: mean=–0.55%, SD=0.91). However, the differences are small enough to consider the two sequences highly comparable.
Processing of the images after acquisition was done by using a family of software programs called BRAINS2 (9) . The T 1 -weighted images were spatially normalized and resampled to 1.0-mm 3 voxels so that the anterior-posterior axis of the brain was realigned parallel to the anterior commissure/posterior commissure line and the interhemispheric fissure aligned on the other two axes. The T 2 - and PD-weighted images were aligned to the spatially normalized T 1 -weighted image. The data sets were then segmented into gray matter, white matter, and cerebral spinal fluid, by using the multispectral data and a discriminant analysis method based on automated training class selection (10) . The images were then processed with the BRAINSURF program, which generates a visual map and quantitative measures of brain surface anatomy. The segmented image is used to extract a triangle-based polygonal model of an iso-surface, representing the parametric center of the gray matter tissue class (11) .
Measurements
The resulting three-dimensional iso-surface approximates the spatial center of the cortex and is used to provide estimates of values that are direct or indirect quantitative measurements of gyrification.
Curvature index
The gyral curvature index measures the degree of convexity with greater absolute numbers indicating tighter curvatures; thus, higher gyral curvature measures represent gyri with more “peaked” apices while lower gyral curvature indices indicate flatter or broader gyral apices. The sulcal curvature index is a measure of concavity, and absolute values of this measure also indicate increasingly tighter curves. High sulcal curvature indices represent sulcal valleys with steep walls, while lower sulcal indices represent sulcal valleys with flatter, looser bases and sloping, rather than steep, walls.
Surface area
This value is the straightforward sum of the areas of the triangles making up the surface of the brain.
Cortical depth
This measure is the minimum distance between the 100% gray matter triangle surface and the 50%/50% gray/white matter surface. This measure is an index of cortical thickness; it represents the parametric center of the cortex, or approximately one-half the cortical thickness.
The methods used to quantify these aspects of surface anatomy have been extensively evaluated and validated (11) .
Statistical Analysis
All analyses were performed by using the SAS language with SAS STAT procedures (SAS Institute, Cary, N.C.). All brain measures were analyzed by using the General Linear Models Procedure with group as an independent variable and cortical measures as the dependent variables. The measure of cerebral surface area is directly correlated with intracranial volume (Pearson correlation for the total 48 subjects: r=0.90, p<0.001). Therefore, intracranial volume was used as a covariate for the surface area measures. However, the remaining measures, cortical depth and combined sulcal/gyral curvature, are independent of intracranial volume (in this study group, Pearson correlation between intracranial volume and cortical depth: r=–0.17, p=0.24; for sulcal/gyral curvature: r=–0.06, p=0.70); therefore, no covariate was used for these measures.
Results
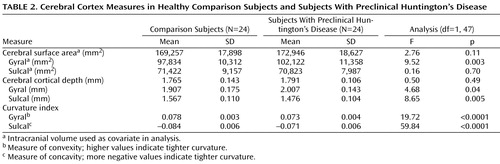
Table 2 displays the results from the analysis evaluating each cortical measure in the subjects with preclinical Huntington’s disease and in the comparison subjects. There were no significant differences between the two groups in total cerebral surface area. However, when this was divided into gyral surface area and sulcal surface area, the subjects with preclinical Huntington’s disease showed a significantly larger gyral surface area than the comparison subjects. There was no significant difference between the groups in sulcal surface area. Again, for total cortical depth, the two groups showed no significant differences, yet when regionally specific measures of gyral and sulcal depth were evaluated, both measures differed between the groups. In relation to the comparison subjects, those with preclinical Huntington’s disease had significantly thicker gyri while having significantly thinner sulci. Figure 1 is a visual representation of differences in cortical morphology between the two groups.
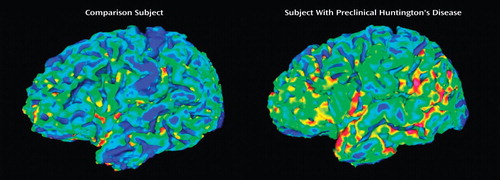
a The color represents cortical thickness; thin cortex is represented in hues of blue, and thicker cortex is represented by yellow and red.
Finally, the shape of the cerebral gyri and sulci differed substantially between groups, with the gyral and sulcal curvature indices both being smaller in the subjects with preclinical Huntington’s disease. The analysis of shape indicated that the subjects with preclinical Huntington’s disease had gyral crowns that were broader and flatter than those of the comparison subjects and sulci that were broader and flatter than those of the comparison subjects.
Discussion
In a concurrent study evaluating volumes of brain regions in the same group of subjects with preclinical Huntington’s disease and comparison subjects, the volume of the cerebral cortex was found to be significantly larger in those with preclinical Huntington’s disease than in the comparison subjects (7) . The current study extends this work by evaluating the detailed morphology of the cerebral cortex in these subjects by means of a novel image analysis technique. The findings indicate that in subjects with preclinical Huntington’s disease, the morphology of the cerebral cortex is different from that of the comparison subjects. In fact, every aspect of cortical surface anatomy was abnormal, including surface area, cortical depth, and sulcal/gyral curvature.
What is the etiology of these differences? The pathophysiology of Huntington’s disease has classically been conceptualized as degeneration of the brain. These subjects were, at the time of scanning, in a preclinical state and had not yet demonstrated the significant motor symptoms needed to fulfill the clinical diagnosis. However, cognitive and/or behavioral symptoms frequently predate the onset of motor symptoms, making the definition of “disease onset” somewhat unclear. Low basal ganglia volumes have been detected before the onset of motor symptoms, leading some to speculate that degenerative processes begin long before clinical diagnosis (12 – 14) . Yet there are several facts about the types of changes seen in the cortex of subjects with preclinical Huntington’s disease that do not support the theory that these changes are degenerative in nature. For example, with the exception of sulcal thinning, the cortex morphology of abnormally large gyral surface area and thickness are likely not due to degeneration. These findings instead suggest developmental aberration or abnormalities in the process of cortical growth and maturation. These findings are supported by a growing number of studies indicating that neurodevelopmental aberration may be a key component to the pathophysiology of Huntington’s disease. Studies showing that the mutant gene product in the disease, Huntingtin, is expressed throughout brain development (15 – 17) raise the possibility that the altered gene product is responsible for minor alterations in brain development that may be manifested in abnormalities of brain structure. In support of this theory, a couple of postmortem studies have reported neuropathological findings, including higher than normal oligodendrocyte density in both subjects with preclinical Huntington’s disease and symptomatic patients, which were likely due to abnormal development rather than degeneration (18 , 19) .
In the normal human brain, the cytoarchitecture of gyri differs substantially from that of sulci. At a cellular level, when compared to the cortex found in sulci, the crown (top of gyrus) cortex is thicker, having denser myelinated fiber tracts, denser neuropil, and more prominent cellular columns (20) . Thicker cortex in gyral crowns than in sulci has also been shown by using neuroimaging techniques (MRI) (21) . This can also be seen in the current group of healthy comparison subjects, in whom the average depth of the gyri was 1.907 mm, whereas the average depth of the sulci was 1.567 mm. The architectural differences between gyri and sulci indicate that they are structurally, connectionally, and therefore functionally different from one another. Further, their unique structures are most likely directly related to their differential functions. Stated another way, the fact that sulci and gyri differ in structure is most likely not random and therefore biologically important.
How does this relate to the pathoetiology of Huntington’s disease? From the current study, we see that the pattern of cortical morphology in the subjects with preclinical Huntington’s disease is a disruption of the normal architecture. To understand potential pathology, it is first helpful to review the normal mechanisms by which gyri and sulci are formed. Several theories have been proposed to explain how the cerebral cortex becomes folded and fissured during development, with the most recent being a tension-based theory of morphogenesis (22) . This theory proposes that tension along axons in the white matter specifies how the cortex folds in a characteristic species-specific pattern. The differential orientation of fibers in sulci versus gyri is the basis for the creation of concave and convex structures. That is, fibers in the sulci are oriented tangential to the surface and make connections to relatively distant brain regions. Tensile forces along these fibers cause an inward fold in the cortex, resulting in the fundus of a sulcus. Conversely, fibers in the gyri run vertically and form connections with local neurons in nearby gyri. Tensile forces along these neural pathways result in an outward fold, forming the crown of a gyrus.
Therefore, the tensile forces along the axons in the white matter underlying the cortex seem to play a key role in the normal development of cortical structure. This is especially important when considering the pathoetiology of Huntington’s disease, since cerebral white matter has been consistently documented as being abnormal in affected subjects (2 – 5 , 23) , in other groups with preclinical Huntington’s disease (6) , and in the current subjects with preclinical disease (7) . This hypothesis that white matter pathology is an important feature of Huntington’s disease is further supported by neuropathology studies that show abnormalities in the density of oligodendrocytes, cells intimately involved in white matter formation, in the brains of subjects with Huntington’s disease (18 , 19) .
Further supporting the view that larger cortical measures in subjects with preclinical Huntington’s disease represent abnormal neurodevelopment is the growing body of literature showing that a larger volume of brain tissue, more specifically the cerebral cortex, is a phenomenon common to several neurodevelopmental brain disorders, including autism (24 , 25) , neurofibromatosis (26) , persistent developmental stuttering (27) , nonsyndromic clefts of the lip and/or palate (28) , and attention deficit hyperactivity disorder (29) . In some of these studies, large cortex volume was found to be directly related to cognitive impairment, suggesting that the greater volume of the cortex is pathologic and not benign or compensatory growth (26 , 28) .
Studies on the function of Huntingtin, the gene that, when mutated, is responsible for Huntington’s disease, may support the theory of abnormal brain development. A current hypothesis is that the extended CAG of the Huntingtin protein results in a gain in activity that is toxic and causes the neural damage seen in Huntington’s disease. However, there is also compelling evidence that in addition to this mechanism, loss of function of normal Huntingtin may also be an important mechanism in the disease (30 , 31) . Normal Huntingtin is necessary for brain development, as embryos of knockout mice monozygous for Huntingtin die soon after birth (32) . It is also known that Huntingtin is expressed in the brain throughout development (16 , 17) and plays a vital role in neuronal survival and stability (33) . Therefore, given Huntingtin’s key role in development, a partial loss of function of this protein may potentially manifest in abnormal neural development.
One other possibility is that the larger cortex seen in the current study is due not to abnormal development, but instead to a degenerative process. For instance, in the process of disease, there could potentially be a change in the morphology of the neurons and/or glial cells as they become dysfunctional and later die. Although this theory would have to posit that the process of degeneration is exceedingly long, the notion that the cortex of individuals with preclinical Huntington’s disease swells in size as a reaction to the initial phases of a degenerative process must also be considered.
How do the current findings relate to previous reports of cortical abnormalities in subjects with preclinical Huntington’s disease? The findings of large cortical size per se have not previously been reported. However, several MRI studies of patients with Huntington’s disease have indicated that relative to white matter volume, cerebral gray matter volume is not abnormally low in relation to that of comparison subjects (2 – 5) . Gray matter that is spared in volume in Huntington’s disease subjects is a concept that is consistent with the notion that in preclinical Huntington’s disease, the cortex is larger than normal and that with disease onset, degeneration occurs, lowering the volume of the cortex but not to a level below that of normal subjects until later in the disease process.
More recent work in evaluating cortical morphology in preclinical Huntington’s disease has been much more inconsistent, with two studies (one in patients with early Huntington’s disease [5] and one in subjects with preclinical Huntington’s disease [34] ) showing widespread cortical thinning in analyses based on regions of interest and with four studies using voxel-based morphometry (both cross-sectional [ 6 , 35 , 36 ] and longitudinal [37] studies) that showed very little or only regionally specific gray matter loss in preclinical Huntington’s disease. It is important to note that although our findings show abnormally large gyral measures, it is critical to highlight that we also found widespread, significant thinning of the cerebral sulci, consistent with the reports by Rosas et al. (34) . Varying methods of image processing among all of these studies (including the current one) is a vital factor and has already been raised as a serious concern in regard to the inconsistent findings in different study groups (38) . Further work to collaborate and validate methods as well as to reproduce and confirm early findings will be vital in the future.
The limitations of this study include the small number of subjects and the slightly different imaging sequences for the comparison subjects and those with preclinical Huntington’s disease. Our findings of larger gyral measures are unique and somewhat counterintuitive. These results no doubt need replication in a larger study group. In regard to the slightly different imaging sequences for the two groups, it is important to note that the validation study of the two sequences showed that the two methods produce highly reproducible values. However, there is a consistent (albeit small) bias for the sequence for the comparison subjects to overestimate gyral surface area, gyral thickness, and sulcal curvature, and to underestimate gyral curvature, in relation to the sequence for the subjects with preclinical Huntington’s disease. Thus, if the differences between the two groups were due to the artifact of having two slightly different imaging sequences, we would expect the comparison subjects to have substantially larger gyral surfaces, greater gyral depths, larger sulcal curvatures, and smaller gyral curvatures than the subjects with preclinical Huntington’s disease. Instead we see the opposite, suggesting that the differences between the two sequences cannot account for our findings. On the other hand, the comparison sequence, in relation to that for the preclinical Huntington’s disease, overestimates sulcal depth, which is consistent with the finding that the individuals with preclinical Huntington’s disease had substantially thinner sulci, suggesting that sequence variation may contribute some to this finding.
Finally, the current study was limited to a global determination of cortical morphology with no assessment of regional specificity. Future studies will focus on using methods that can measure the cortical structure of functionally distinct regions of the cortex.
1. Mendez MF: Huntington’s disease: update and review of neuropsychiatric aspects. Int J Psychiatry Med 1994; 24:189–208Google Scholar
2. Aylward EH, Anderson NB, Bylsma FW, Wagster MV, Barta PE, Sherr M, Feeney J, Davis A, Rosenblatt A, Pearlson GD, Ross CA: Frontal lobe volume in patients with Huntington’s disease. Neurology 1998; 50:252–258Google Scholar
3. Beglinger LJ, Nopoulos P, Jorge RE, Langbehn D, Mikos A, Moser DJ, Duff K, Robinson RG, Paulsen J: White matter volume and cognitive dysfunction in early Huntington’s disease. Cogn Behav Neurol 2005; 18:102–107Google Scholar
4. Jernigan TL, Salmon DP, Butters N, Hesselink JR: Cerebral structure on MRI, part II: specific changes in Alzheimer’s and Huntington’s diseases. Biol Psychiatry 1991; 29:68–81Google Scholar
5. Rosas HD, Koroshetz WJ, Chen YI, Skeuse C, Vangel M, Cudkowicz ME, Caplan K, Marek K, Seidman LJ, Makris N, Jenkins BG, Goldstein JM: Evidence for more widespread cerebral pathology in early HD: an MRI-based morphometric analysis. Neurology 2003; 60:1615–1620Google Scholar
6. Thieben MJ, Duggins AJ, Good CD, Gomes L, Mahant N, Richards F, McCusker E, Frackowiak RS: The distribution of structural neuropathology in pre-clinical Huntington’s disease. Brain 2002; 125(part 8):1815–1828Google Scholar
7. Paulsen JS, Magnotta VA, Mikos AE, Paulson HL, Penziner E, Andreasen NC, Nopoulos PC: Brain structure in preclinical Huntington’s disease. Biol Psychiatry 2006; 59:57–63Google Scholar
8. Huntington Study Group: Unified Huntington’s Disease Rating Scale. Mov Disord 1996; 11:136–142Google Scholar
9. Magnotta V, Harris G, Andreasen NC, O’Leary DS, Yuh WT, Heckel D: Structural MR image processing using the BRAINS2 toolbox. Comput Med Imaging Graph 2002; 26:251–264Google Scholar
10. Harris G, Andreasen NC, Cizadlo T, Bailey JM, Bockholt HJ, Magnotta VA, Arndt S: Improving tissue segmentation in MRI: a three-dimensional multispectral discriminant analysis method with automated training class selection. J Comput Assist Tomogr 1999; 23:144–154Google Scholar
11. Magnotta VA, Andreasen NC, Schultz SK, Harris G, Cizadlo T, Heckel D, Nopoulos P, Flaum M: Quantitative in vivo measurement of gyrification in the human brain: changes associated with aging. Cereb Cortex 1999; 9:151–160Google Scholar
12. Aylward EH, Codori AM, Barta PE, Pearlson GD, Harris GJ, Brandt J: Basal ganglia volume and proximity to onset in presymptomatic Huntington disease. Arch Neurol 1996; 53:1293–1296Google Scholar
13. Campodonico JR, Aylward E, Codori AM, Young C, Krafft L, Magdalinski M, Ranen N, Slavney PR, Brandt J: When does Huntington’s disease begin? J Int Neuropsychol Soc 1998; 4:467–473Google Scholar
14. Harris GJ, Codori AM, Lewis RF, Schmidt E, Bedi A, Brandt J: Reduced basal ganglia blood flow and volume in pre-symptomatic, gene-tested persons at-risk for Huntington’s disease. Brain 1999; 122(part 9):1667–1678Google Scholar
15. Moreno-Flores MT, Medina M, Wandosell F: Expression of presenilin 1 in nervous system during rat development. J Comp Neurol 1999; 410:556–570Google Scholar
16. Bhide PG, Day M, Sapp E, Schwarz C, Sheth A, Kim J, Young AB, Penney J, Golden J, Aronin N, DiFiglia M: Expression of normal and mutant huntingtin in the developing brain. J Neurosci 1996; 16:5523–5535Google Scholar
17. Zeitlin S, Liu JP, Chapman DL, Papaioannou VE, Efstratiadis A: Increased apoptosis and early embryonic lethality in mice nullizygous for the Huntington’s disease gene homologue. Nat Genet 1995; 11:155–163Google Scholar
18. Myers RH, Vonsattel JP, Paskevich PA, Kiely DK, Stevens TJ, Cupples LA, Richardson EP Jr, Bird ED: Decreased neuronal and increased oligodendroglial densities in Huntington’s disease caudate nucleus. J Neuropathol Exp Neurol 1991; 50:729–742Google Scholar
19. Gomez-Tortosa E, MacDonald ME, Friend JC, Taylor SA, Weiler LJ, Cupples LA, Srinidhi J, Gusella JF, Bird ED, Vonsattel JP, Myers RH: Quantitative neuropathological changes in preclinical Huntington’s disease. Ann Neurol 2001; 49:29–34Google Scholar
20. Welker W: Why does cerebral cortex fissure and fold?, in Cerebral Cortex, vol 8B. Edited by Jones EG, Peters A. New York, Plenum, 1990, pp 3–136Google Scholar
21. White T, Andreasen NC, Nopoulos P, Magnotta V: Gyrification abnormalities in childhood- and adolescent-onset schizophrenia. Biol Psychiatry 2003; 54:418–426Google Scholar
22. Van Essen DC: A tension-based theory of morphogenesis and compact wiring in the central nervous system. Nature 1997; 385:313–318Google Scholar
23. Fennema-Notestine C, Archibald SL, Jacobson MW, Corey-Bloom J, Paulsen JS, Peavy GM, Gamst AC, Hamilton JM, Salmon DP, Jernigan TL: In vivo evidence of cerebellar atrophy and cerebral white matter loss in Huntington disease. Neurology 2004; 63:989–995Google Scholar
24. Piven J, Arndt S, Bailey J, Andreasen N: Regional brain enlargement in autism: a magnetic resonance imaging study. J Am Acad Child Adolesc Psychiatry 1996; 35:530–536Google Scholar
25. Piven J, Arndt S, Bailey J, Havercamp S, Andreasen NC, Palmer P: An MRI study of brain size in autism. Am J Psychiatry 1995; 152:1145–1149Google Scholar
26. Moore BD 3rd, Slopis JM, Jackson EF, De Winter AE, Leeds NE: Brain volume in children with neurofibromatosis type 1: relation to neuropsychological status. Neurology 2000; 54:914–920Google Scholar
27. Foundas AL, Bollich AM, Corey DM, Hurley M, Heilman KM: Anomalous anatomy of speech-language areas in adults with persistent developmental stuttering. Neurology 2001; 57:207–215Google Scholar
28. Nopoulos P, Berg S, Canady J, Richman L, Van Demark D, Andreasen NC: Structural brain abnormalities in adult males with clefts of the lip and/or palate. Genet Med 2002; 4:1–9Google Scholar
29. Sowell ER, Thompson PM, Welcome SE, Henkenius AL, Toga AW, Peterson BS: Cortical abnormalities in children and adolescents with attention-deficit hyperactivity disorder. Lancet 2003; 362:1699–1707Google Scholar
30. Cattaneo E, Rigamonti D, Goffredo D, Zuccato C, Squitieri F, Sipione S: Loss of normal huntingtin function: new developments in Huntington’s disease research. Trends Neurosci 2001; 24:182–188Google Scholar
31. Cattaneo E, Zuccato C, Tartari M: Normal huntingtin function: an alternative approach to Huntington’s disease. Nat Rev Neurosci 2005; 6:919–930Google Scholar
32. Nasir J, Floresco SB, O’Kusky JR, Diewert VM, Richman JM, Zeisler J, Borowski A, Marth JD, Phillips AG, Hayden MR: Targeted disruption of the Huntington’s disease gene results in embryonic lethality and behavioral and morphological changes in heterozygotes. Cell 1995; 81:811–823Google Scholar
33. Rigamonti D, Bauer JH, De-Fraja C, Conti L, Sipione S, Sciorati C, Clementi E, Hackam A, Hayden MR, Li Y, Cooper JK, Ross CA, Govoni S, Vincenz C, Cattaneo E: Wild-type huntingtin protects from apoptosis upstream of caspase-3. J Neurosci 2000; 20:3705–3713Google Scholar
34. Rosas HD, Hevelone ND, Zaleta AK, Greve DN, Salat DH, Fischl B: Regional cortical thinning in preclinical Huntington disease and its relationship to cognition. Neurology 2005; 65:745–747Google Scholar
35. Kassubek J, Juengling FD, Kioschies T, Henkel K, Karitzky J, Kramer B, Ecker D, Andrich J, Saft C, Kraus P, Aschoff AJ, Ludolph AC, Landwehrmeyer GB: Topography of cerebral atrophy in early Huntington’s disease: a voxel based morphometric MRI study. J Neurol Neurosurg Psychiatry 2004; 75:213–220Google Scholar
36. Mühlau M, Weindl A, Wohlschläger AM, Gaser C, Städtler M, Valet M, Zimmer C, Kassubek J, Peinemann A: Voxel-based morphometry indicates relative preservation of the limbic prefrontal cortex in early Huntington disease. J Neural Transm 2007; 114:367–372; Epub 2006 Oct 6Google Scholar
37. Kipps CM, Duggins AJ, Mahant N, Gomes L, Ashburner J, McCusker EA: Progression of structural neuropathology in preclinical Huntington’s disease: a tensor based morphometry study. J Neurol Neurosurg Psychiatry 2005; 76:650–655Google Scholar
38. Kassubek J, Gaus W, Landwehrmeyer GB: Evidence for more widespread cerebral pathology in early HD: an MRI-based morphometric analysis; reply of HD Rosas (letter). Neurology 2004; 62:523–524Google Scholar