Lateralized Caudate Metabolic Abnormalities in Adolescent Major Depressive Disorder: A Proton MR Spectroscopy Study
Abstract
Objective: Proton magnetic resonance spectroscopy ( 1 H-MRS) has been increasingly used to examine striatal neurochemistry in adult major depressive disorder. This study extends the use of this modality to pediatric major depression to test the hypothesis that adolescents with major depression have elevated concentrations of striatal choline and creatine and lower concentrations of N -acetylaspartate. Method: Fourteen adolescents (ages 12–19 years, eight female) who had major depressive disorder for at least 8 weeks and a severity score of 40 or higher on the Children’s Depression Rating Scale—Revised and 10 healthy comparison adolescents (six female) group-matched for gender, age, and handedness were enrolled. All underwent three-dimensional 3-T 1 H-MRS at high spatial resolution (0.75-cm 3 voxels). Relative levels of choline, creatine, and N -acetylaspartate in the left and right caudate, putamen, and thalamus were scaled into concentrations using phantom replacement, and levels were compared for the two cohorts. Results: Relative to comparison subjects, adolescents with major depressive disorder had significantly elevated concentrations of choline (2.11 mM versus 1.56 mM) and creatine (6.65 mM versus 5.26 mM) in the left caudate. No other neurochemical differences were observed between the groups. Conclusions: These findings most likely reflect accelerated membrane turnover and impaired metabolism in the left caudate. The results are consistent with prior imaging reports of focal and lateralized abnormalities in the caudate in adult major depression.
Rates of major depressive disorder rise dramatically in adolescence, with an estimated lifetime prevalence of 15% in adolescents by ages 15–18. Major depression is associated with significant morbidity, including deterioration in academic functioning, increased risk of substance use, and attempted and completed suicides (1 , 2) . Furthermore, adolescent major depression is a strong predictor of major depression in adulthood, which carries its own burden of disadvantage (3) . These findings highlight the need for specific neurobiological research in adolescent major depression.
Converging lines of evidence suggest that the pathophysiology of depression entails impairment of cellular resilience and neuroplasticity in specific cortical, subcortical, and limbic brain regions. The relationship between the basal ganglia and depression has been inferred from the high comorbidity between depression and Parkinson’s disease as well as Huntington’s disease, both basal ganglia-related disorders. In addition, morphometric studies (but not all) and functional neuroimaging studies have documented smaller caudate, putamen, and thalamus as well as impaired metabolism and blood flow in the striatum and thalamus in depression (4 – 10) .
Proton magnetic resonance spectroscopy ( 1 H-MRS) has provided additional evidence for the involvement of the striatum in adult major depression. 1 H-MRS provides metabolic assay of neuronal cells, cell energetics, density, membrane turnover, gliosis, and glycolysis through their respective surrogate markers, N -acetylaspartate, creatine, choline, myo -inositol, and lactate levels (11) . 1 H-MRS studies have corroborated the role of impaired cellular resilience in the basal ganglia of adults with major depression through abnormal levels of choline and N -acetylaspartate. Charles et al. (12) reported that elevated choline/creatine ratios decreased after antidepressant treatment, whereas a later study by Renshaw et al. (13) yielded opposite results. Hamakawa et al. (14) found higher choline levels and choline/creatine ratios in bipolar patients during a depressive episode. Vythilingam et al. (15) reported lower caudate N -acetylaspartate/creatine ratios and increased choline/creatine ratios in the putamen in major depression. The discrepant findings may be attributed in part to methodological issues, such as the use of single-voxel methods susceptible to partial volume effects given the small size and irregular shape of the striatum and thalamus; ratios to creatine, which increase variability (16) ; use of a lower magnetic field (1.5-T) of lower sensitivity and spatial and spectral resolutions. They may also reflect differences in participant selection criteria, such as age range, depression severity, medication status, and family history.
To our knowledge, there have been no 1 H-MRS studies of the striatum in pediatric major depression. We believe that such research is important because establishing neuromarkers early in the course of the illness is likely to minimize confounding effects of chronicity and comorbidity and facilitate identification of at-risk individuals. We hypothesized that adolescents with major depression exhibit increased striatal choline and creatine and decreased N -acetylaspartate compared with healthy comparison subjects but exhibit no differences in the thalamus. This hypothesis is based on models of major depression that entail impaired neuroplasticity and its collateral consequences of increased membrane turnover and impaired metabolism and neuronal viability (17) .
Methods
Participants
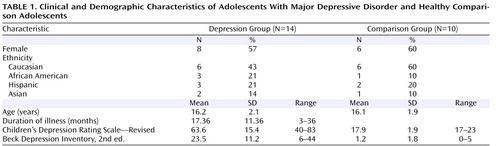
Fourteen adolescents (eight of them female) 12–19 years old (mean age=16.2 years, SD=2.1) who had symptoms of major depressive disorder for at least 8 weeks and had a score ≥40 (mean=63.6, SD=15.4) on the Children’s Depression Rating Scale—Revised were enrolled from the New York University (NYU) Child Study Center, the Department of Psychiatry at Bellevue Hospital, and the inpatient psychiatric unit at NYU Tisch Hospital, all in New York City.
Ten healthy comparison subjects (six of them female), group matched for gender, age, and handedness, were recruited from families of NYU staff. For participants age 18 and over, written informed consent was obtained; those under age 18 provided assent and a parent or guardian provided signed consent.
A child psychiatrist interviewed participants about themselves and parents about their child with the Schedule for Affective Disorders and Schizophrenia for School-Age Children—Present and Lifetime Version. Based on the interview, the psychiatrist rated each participant’s severity of depression on the Children’s Depression Rating Scale and on the severity item of the Clinical Global Impression. Participants also completed the Beck Depression Inventory, 2nd ed. Family medical and psychiatric history was obtained by reports from participants and parents.
Exclusion criteria for all participants were IQ below 80, significant medical or neurological disorder, and the usual MRI contraindications, including claustrophobia, ferrous implants, ink tattoos, metallic oral devices, large body habitus, or positive urine pregnancy test. Patients with major depressive disorder were excluded if they had a current or past DSM-IV diagnosis of bipolar disorder, schizophrenia, pervasive developmental disorder, posttraumatic stress disorder, obsessive-compulsive disorder, Tourette’s disorder, or eating disorder or if they had a substance-related disorder in the past 12 months. Comparison subjects were excluded if they had any major current or past DSM-IV diagnosis or a Children’s Depression Rating Scale score above 28.
MR Data Acquisition
All scans were done with a Trio 3-T full-body MRI scanner (Siemens AG, Erlangen, Germany) using a TEM3000 (18) transmit-receive head coil (MRI Instruments, Minneapolis). For image guidance of the MRS volume of interest, we used T 1 -weighted (echo time=4 msec, repetition time=1,130 msec) and axial T 2 -weighted (echo time=80 msec, repetition time=2,500 msec) MRI, as shown in Figure 1 , panels A–C. For both contrasts, field of view=240×240 mm 2 , matrix=512×512, and slice thickness=7.5 mm in the axial and 5 mm in the coronal and sagittal planes were used.
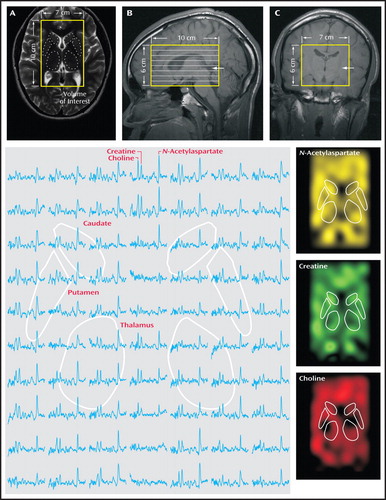
a In panel A, the 7 cm 10 cm 6 cm volume of interest is outlined on a T 2 -weighted axial image, and the striata and thalami are superimposed onto the image. In panel B, the eight inferior-superior Hadamard spectroscopic imaging-encoded slices are shown within the region of interest on a T 1 -weighted sagittal image, with the slice from panel A marked with an arrow. Panel C shows the outline of the volume of interest in a T 1 -weighted coronal image; the arrow indicates the location of the slice from panel A. The large image (bottom left) shows part of the 7 cm 10 cm spectra matrix from the volume-of-interest slice corresponding to the image in panel A, with the striata and thalami locations outlined. Spectra represent 0.75-cm 3 voxels, and all are on common frequency and intensity scales. The three images at bottom right show metabolic maps of N -acetylaspartate, choline, and creatine from the fitted peak areas of the spectra on the left.
For 1 H-MRS, our automatic shim yielded 5.0 Hz (SD=1.0) linewidth for the metabolites in every voxel. A 10-cm (anterior-posterior) × 7-cm (left-right) × 6-cm (inferior-superior) volume of interest (420 cm 3 ) was image-guided onto the anatomic structures of interest, as shown in Figure 1 . The volume of interest was excited using point-resolved spectroscopy (echo time=135 msec, repetition time=1,600 msec) and subdivided into eight inferior-superior axial slices with Hadamard spectroscopic imaging (19) . These slices were partitioned with two-dimensional chemical-shift imaging into 16 (anterior-posterior) × 16 (left-right) voxels, each a nominal 0.75 cm 3(19) . The MRS took 27 minutes and the entire protocol less than an hour. An example of an axial spectra matrix covering the caudate, putamen, and thalamus of an adolescent with major depressive disorder is shown in Figure 1 .
MRS Data Processing
The MRS data were processed offline using in-house software. Residual water was removed from the free induction decays in the time domain. The data were then voxel-shifted to align the chemical-shift imaging grid with the N -acetylaspartate volume of interest, zero-filled from 16×16×8 to 256×256×8, apodized with a 3-Hz Lorentzian, Fourier-transformed in the temporal, left-right, and anterior-posterior direction and Hadamard-reconstructed along the inferior-superior line. No spatial filters were applied. Spectra were automatically corrected for frequency and zero-order phase shifts in reference to the N -acetylaspartate peak in each voxel (19) .
Relative N -acetylaspartate, creatine, and choline levels were estimated from their peak area using parametric spectral modeling (20) . These relative levels were scaled into concentrations, [ Q], in each voxel using phantom replacement against a 3-liter sphere of 10.9 mM N -acetylaspartate in water (21) . The [ Q]’s were corrected for differences between the phantom in vitro N -acetylaspartate levels (T 1vitro / T 2vitro =1.4/0.75 s) and those reported in vivo of N -acetylaspartate (1.4/0.43 s), creatine (1.6/0.21 s) and choline (1.2/0.36 s), using the following formula (22 , 23) :
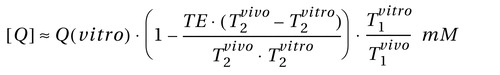
Although the assumption of a single T 1 and T 2 for each metabolite ignores possible regional variations (22) , it does not alter our analyses since we compare similar regions across subjects.
The thalamus and striatum were outlined manually on an axial T 2 -weighted image, as shown in Figure 1 , panel A. For each patient, only the one 1 H-MRS slice that best contained the bilateral striatum and thalamus was used. Our in-house software scaled and transcribed the outlined regions onto the quantitative metabolic maps and calculated for each one the volume (the sum of the circumscribed voxels), the sum of the [Q]’s from the equation above for each metabolite, and their standard deviations. Each metabolite’s concentration was obtained by dividing the sum of the [Q]’s by the appropriate volume. Note that after the 16×16 to 256×256 zero-filling, the in-plane MRS voxel resolution for the tracing (0.625 mm 2 ) was sufficient to avoid ventricular CSF and surrounding white matter. If the line delineating a structure passed anywhere inside any of these interpolated voxels, their volume and metabolic contents were added to the respective sums.
Statistical Analyses
Mixed-model regression was used to compare patients and comparison subjects with respect to the mean of each metabolite in each region (left and right caudate, putamen, and thalamus), while accounting for group differences in the volume of the given region. A separate analysis was conducted for each metabolite concentration within each region. In each case, the dependent variable consisted of the measures acquired on each side of the given region. Independent variables included subject group (index versus comparison subjects) and side (left versus right) as fixed classification factors, and the term representing the interaction between group and side (to determine whether group differences were the same on the left and right sides of the relevant brain region), and region volume as a numeric factor.
The variance-covariance structure was modeled by assuming observations to be correlated only when obtained from the same subject, and by allowing the error variance to differ across subject groups. All reported p values are two-sided type 3 significance levels from F values (df=1, 21), with statistical significance set at p<0.05.
Results
Participants
At the time of the scan, four patients were medication-naive, two had been psychotropic-free for at least 1 year, and eight had been treated with psychotropic medications for periods ranging from 2 months up to two and a half years. All patients on medication had not responded at the time of their scan. Medications included selective serotonin reuptake inhibitors (four patients were taking fluoxetine, two were taking sertraline, one was taking escitalopram, and one was taking citalopram). Additionally, three were also taking lithium, one was taking lamotrigine, and one was taking risperidone. Two patients had social phobia and one had attention deficit hyperactivity disorder. Seven patients had a parental history of major depression. None of the comparison subjects’ parents had any psychiatric disorders. Patient and comparison group characteristics are summarized in Table 1 .
Volumetry
The mean volumes of circumscribed left and right regions of interest in the patient group were as follows: thalamus, 3,214 mm 3 (SD=305) and 3,232 mm 3 (SD=368); caudate, 811 mm 3 (SD=59) and 796 mm 3 (SD=49); and putamen, 885 mm 3 (SD=84) and 903 mm 3 (SD=84). In the comparison group, the mean volumes were as follows: thalamus, 3,251 mm 3 (SD=336) versus 3,241 mm 3 (SD=311); caudate, 821 mm 3 (SD=38) versus 796 mm 3 (SD=31); and putamen, 889 mm 3 (SD=77) versus 880 mm 3 (SD=74). Neither region showed any significant difference between the sides (left versus right) or between groups.
Note that these regions of interest included edge voxels even when they fell only partly within the circumscribed region. To estimate the edge voxels’ partial-volume contribution, we considered the surface-to-volume ratio for these structures. With a voxel volume of 2.9 mm 3 and thalamic region-of-interest volumes of ∼3,230 mm 3 , ∼118 out of 1,103 voxels were at the surface, where their partial volume can be anywhere from 1% to 99%. Assuming an average partial volume of 50%, the partial volume would be ∼5.4% in the thalamus (118/110350%), ∼10.7% (30/27950%) in the caudate (average volume, 810 mm 3 ), and ∼10.2% (31/30750%) in the putamen (average volume, 890 mm 3 ).
Neurochemistry
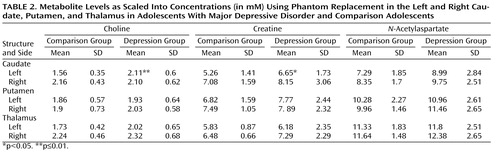
Patients’ and comparison subjects’ choline, creatine, and N -acetylaspartate concentrations from the left and right caudate, putamen, and thalamus are compiled in Table 2 . Relative to comparison subjects, adolescents with major depression had significantly elevated left caudate choline concentrations (2.11 mM versus 1.56 mM) and elevated left caudate creatine concentrations (6.65 mM versus 5.26 mM), as shown in Table 2 and Figure 2 .
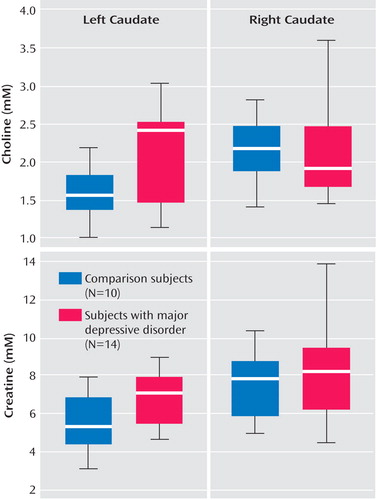
a Significant differences between groups were observed only in the left caudate.
No significant metabolite differences were found in the right caudate and in the left and right putamen and thalamus between the two groups. Similarly, the groups did not differ in metabolite concentrations averaged over the left and right caudate, putamen, or thalamus.
There were no significant differences between adolescents with major depression who were treated with psychotropic medications (N=8) and those who were medication naive or free (N=6) with respect to choline and creatine levels in the left caudate.
Because antipsychotic drugs may affect striatal chemistry and volume (24 , 25) , we repeated the comparison excluding one adolescent treated with risperidone. The groups’ left caudate choline and creatine levels remained significantly different (F=5.58, df=1, 20, p<0.03, and F=4.92, df=1, 20, p<0.04, respectively).
Analyses of each brain region to examine interaction between major depression status and laterality (side of measure) was found to be significant for choline in the caudate (p<0.05), as shown in Figure 2 .
Discussion
To our knowledge, this is the first study of striatal neurochemistry in adolescent major depressive disorder. Using three-dimensional 1 H-MRS at high spatial resolution (0.75-cm 3 voxels) and a 3-T field, we found higher choline and creatine concentrations in the left caudate of adolescents with major depression relative to comparison adolescents. The hypothesis of increased choline bilaterally in the caudate and putamen and decreased striatal N -acetylaspartate was not substantiated. Our finding is consistent with structural and functional neuroimaging studies documenting smaller caudate volumes and impaired blood flow in adults with major depression (4 , 5 , 26 , 27) , as well as decreased caudate blood flow in depressed versus nondepressed patients with Parkinson’s disease (28) .
Choline
Choline is an essential component of membrane lipids, phosphatidylcholine, and sphingomyelin (29) . The 1 H-MRS choline peak comprises mostly the quaternary N -methyl groups of glycerophosphocholine breakdown products (cytosolic compounds) and phosphocholine, the membrane precursors of phosphatidylcholine (30) . The contribution of free choline to the signal is less than 5%, and that of the acetylcholine is negligible (30) . Elevated choline is attributed to abnormal cell membrane metabolism, myelin breakdown, or changes in glia density (31) .
Elevated choline observed in the left caudate most likely reflects accelerated cell membrane turnover due to glia impairment that has been linked to major depression (32 , 33) . Two mechanisms may lead to this process: 1) myelination abnormalities secondary to oligodendrocyte dysfunction, which have been implicated in major depression (34) ; and alternatively or in addition, 2) astrocyte abnormalities (35 , 36) . Astrocytes may have a role in major depression via their role in CNS energy homeostasis.
Another possible mechanism for choline elevation involves the second messenger system. Phosphocholine, a major choline signal contributor and a metabolite of phosphatidylcholine, is an important source of diacylglycerol, the second messenger known to participate in intracellular signal transduction pathways (29 , 37 , 38) hypothesized to contribute to the pathogenesis of major depression (39) .
A third possible mechanism involving choline is in the hypothalamic-pituitary-adrenal axis, repeatedly implicated in biological studies of major depression. Glucocorticoids are proposed to affect phosphatidylcholine metabolism in neurons (40) .
Despite choline’s role as a precursor for the neurotransmitter acetylcholine, its elevation in our study could not be dominated by cholinergic overactivity, which has been hypothesized in major depression (41) . The small contribution of free choline and acetylcholine to the overall choline signal renders this possibility unlikely.
Choline has been the subject of a number of studies with diverse findings in other brain regions in pediatric major depression. Using similar three-dimensional 1 H-MRS, Farchione et al. (42) found increased choline concentrations in the left dorsolateral prefrontal cortex, whereas Caetano et al. (43) , in a later 8-cm 3 single-voxel study, reported decreased choline concentrations in the left dorsolateral prefrontal cortex. In contrast, Mirza et al. (44) , using single 3-cm 3 voxels, found no differences in choline concentrations in the anterior cingulate cortex. Other studies examined metabolite ratios, also with conflicting results. Increased choline/creatine ratios were reported in the orbitofrontal and right prefrontal cortex of adolescents with major depression (45 , 46) , and decreases were reported in the left amygdala (47) . However, different brain regions may entail different neurochemical abnormalities in depression. Our observation is consistent with one prior report of no thalamic choline abnormalities in adolescents with major depression (48) .
Creatine
This peak is a composite of overlapping creatine and phosphocreatine resonances, representing the high-energy phosphate reserves in the cytosol of neurons and glia (21 , 49) . Creatine’s elevation in 1 H-MRS has been attributed to altered metabolism (50) . Our elevated creatine finding is consistent with altered metabolism, as suggested by earlier studies that found both decreased (4 , 5 , 51 – 53) and increased (7 , 54) basal ganglia/caudate blood flow and glucose metabolism in major depression. Indeed, 31 P-MRS, capable of quantifying nucleoside triphosphates, has further implicated basal ganglia metabolism in major depression (55 , 56) .
Since most studies of mood disorders report ratios to creatine, rather than creatine concentrations, this metabolite is infrequently examined as a separate entity and thus far has never been examined in the caudate. The few studies that quantified creatine concentration in pediatric major depression focused on other brain regions; they reported decreases in the anterior cingulate cortex in adolescent major depression (44) and no abnormalities in the dorsolateral prefrontal cortex (42 , 43) . In adult major depression, the only study of creatine concentrations in the basal ganglia used low-spatial-resolution (27 cm 3 ) single-voxel MRS and did not identify any abnormality (14) . Similarly, while we did not find an elevation in creatine levels in the striatum as a whole, our high spatial resolution enabled us to detect a focal elevation lateralized to the left caudate, underscoring the advantage of high field, sensitivity, and resolution. On the other hand, our finding of no thalamic creatine abnormalities in adolescents with major depression is consistent with one prior study (57) .
The finding of elevated creatine levels in the major depression group emphasizes the limitation of using creatine as reference for metabolite measurement. Specifically, the creatine elevation could obscure a concomitant choline increase in a choline/creatine ratio. Similarly, a normal N -acetylaspartate level could be erroneously interpreted as a decline when the examined metric is the N -acetylaspartate/creatine ratio. Neither would be encountered when the analyzed metrics are scaled into concentrations using phantom replacement.
N- acetylaspartate
N -acetylaspartate is the second most abundant amino acid derivative in the mammalian brain (11 , 58) . It is almost exclusive to neurons and their processes and is therefore regarded as a surrogate marker for their viability (59 , 60) . Our hypothesis that N -acetylaspartate levels would be decreased in adolescents with depression was not supported by our data. The increase of choline and creatine without a concomitant N -acetylaspartate decline, as observed here, suggests accelerated membrane turnover but without neurodegeneration. While preliminary, this finding is concordant with those of other studies of pediatric major depression that found no N -acetylaspartate decline, albeit in different brain regions (42 – 45 , 47) . In contrast, N -acetylaspartate loss was reported in the caudate in adults with major depression in a small (N=7) study that analyzed N -acetylaspartate/creatine ratios (15) .
Lateralization of Caudate Metabolic Abnormalities in Major Depression
The lateralization of caudate neurochemical abnormalities in adolescent major depression fits with mounting evidence implicating the left hemisphere in depression (61) . In a study focusing specifically on the basal ganglia (9) , volume differences between depressed and comparison subjects in the left putamen and globus pallidus correlated with illness length and frequency of depressive episodes. In other studies, patients with left caudate lesions were found to be more likely to have major depression than those with right basal ganglia or thalamic lesions (62) , and patients with left subcortical strokes, especially in the left caudate, had a significantly higher incidence of major depression than those with posterior subcortical or right basal ganglia lesions (61 , 63) .
Additional evidence for a role of the left caudate in depression is inferred from symptomatic correlation. Pillay et al. (64) found a negative correlation between baseline depressive symptoms and left caudate volume. In adults with major depression, change in left caudate regional cerebral blood flow correlated with the emergence of depressive symptoms after interruption of paroxetine treatment (65) . In cancer patients, increased left caudate glucose metabolism at baseline was associated with depressive symptoms 2 years later compared with patients who did not develop depression (54) . Taken together, these findings emphasize the potential role of metabolic probes for early identification of major depressive disorder, perhaps even before the onset of clinical symptoms.
Although our findings of focal lateralized caudate abnormalities are consistent with prior studies of adult major depression, they should be considered preliminary in light of several limiting factors. First, the cohort size was relatively modest. Furthermore, because of the small sample size, we did not correct for multiple hypotheses, leading to possible type I errors. Second, most patients with major depression were on medication at the time of the scan. One treatment-response study (66) identified significant change in the choline/creatine ratio only in a small sample of patients who responded to treatment (N=8) compared with those who did not respond (N=7). All the adolescents with major depression in our study were depressed at the time of their scan, and the eight patients taking psychotropic medications had not responded. Additionally, there were no metabolite differences between adolescents with major depression who were treated and those not treated. Nonetheless, since a medication effect cannot be ruled out, our findings should be viewed as preliminary.
We also did not examine the contribution of family history. This is of importance in light of strong evidence for familial transmission in adolescent major depression, which has fostered interest in familial major depression as a potentially distinct subgroup (10) . While we did collect information regarding family history from parents, we did not conduct a comprehensive diagnostic interview, such as the Structured Clinical Interview for DSM-IV-TR.
An additional limitation was the use of intermediate rather than short echo-time 1 H-MRS. Using short echo-time 1 H-MRS would have enabled us to quantify myo -inositol, which reflects glia function. We chose to use intermediate echo-time 1 H-MRS, as it provides a better baseline and is superior with respect to reduction of macromolecule contamination.
In summary, our preliminary findings suggest focal left lateralization of caudate neurochemical abnormalities in adolescents with major depression, manifesting in increased choline and creatine, which suggests that membrane breakdown and impaired metabolism may play an early role in the disorder. Future studies should use larger cohorts and should strive to focus on specific clinical subgroups. Use of inclusion criteria such as familial major depression and psychotropic-naive status may improve the detection of neurobiological findings by decreasing phenotypic heterogeneity.
1. Brent DA: Depression and suicide in children and adolescents. Pediatr Rev 1993; 14:380–388Google Scholar
2. Birmaher B, Ryan ND, Williamson DE, Brent DA, Kaufman J, Dahl RE, Perel J, Nelson B: Childhood and adolescent depression: a review of the past 10 years, part I. J Am Acad Child Adolesc Psychiatry 1996; 35:1427–1439Google Scholar
3. Weissman MM, Wolk S, Goldstein RB, Moreau D, Adams P, Greenwald S, Klier CM, Ryan ND, Dahl RE, Wickramaratne P: Depressed adolescents grown up. JAMA 1999; 281:1707–1713Google Scholar
4. Buchsbaum MS, Wu J, DeLisi LE, Holcomb H, Kessler R, Johnson J, King AC, Hazlett E, Langston K, Post RM: Frontal cortex and basal ganglia metabolic rates assessed by positron emission tomography with [18F]2-deoxyglucose in affective illness. J Affect Disord 1986; 10:137–152Google Scholar
5. Baxter LR Jr, Phelps ME, Mazziotta JC, Schwartz JM, Gerner RH, Selin CE, Sumida RM: Cerebral metabolic rates for glucose in mood disorders: studies with positron emission tomography and fluorodeoxyglucose F 18. Arch Gen Psychiatry 1985; 42:441–447Google Scholar
6. Mayberg HS: Limbic-cortical dysregulation: a proposed model of depression. J Neuropsychiatry Clin Neurosci 1997; 9:471–481Google Scholar
7. Tremblay LK, Naranjo CA, Graham SJ, Herrmann N, Mayberg HS, Hevenor S, Busto UE: Functional neuroanatomical substrates of altered reward processing in major depressive disorder revealed by a dopaminergic probe. Arch Gen Psychiatry 2005; 62:1228–1236Google Scholar
8. Baumann B, Danos P, Krell D, Diekmann S, Leschinger A, Stauch R, Wurthmann C, Bernstein HG, Bogerts B: Reduced volume of limbic system-affiliated basal ganglia in mood disorders: preliminary data from a postmortem study. J Neuropsychiatry Clin Neurosci 1999; 11:71–78Google Scholar
9. Lacerda AL, Nicoletti MA, Brambilla P, Sassi RB, Mallinger AG, Frank E, Kupfer DJ, Keshavan MS, Soares JC: Anatomical MRI study of basal ganglia in major depressive disorder. Psychiatry Res 2003; 124:129–140Google Scholar
10. Drevets WC: Neuroimaging studies of mood disorders. Biol Psychiatry 2000; 48:813–829Google Scholar
11. Danielsen EA, Ross B: Magnetic Resonance Spectroscopy Diagnosis of Neurological Diseases. New York, Marcel Dekker, 1999Google Scholar
12. Charles HC, Lazeyras F, Krishnan KR, Boyko OB, Payne M, Moore D: Brain choline in depression: in vivo detection of potential pharmacodynamic effects of antidepressant therapy using hydrogen localized spectroscopy. Prog Neuropsychopharmacol Biol Psychiatry 1994; 18:1121–1127Google Scholar
13. Renshaw PF, Lafer B, Babb SM, Fava M, Stoll AL, Christensen JD, Moore CM, Yurgelun-Todd DA, Bonello CM, Pillay SS, Rothschild AJ, Nierenberg AA, Rosenbaum JF, Cohen BM: Basal ganglia choline levels in depression and response to fluoxetine treatment: an in vivo proton magnetic resonance spectroscopy study. Biol Psychiatry 1997; 41:837–843Google Scholar
14. Hamakawa H, Kato T, Murashita J, Kato N: Quantitative proton magnetic resonance spectroscopy of the basal ganglia in patients with affective disorders. Eur Arch Psychiatry Clin Neurosci 1998; 248:53–58Google Scholar
15. Vythilingam M, Charles HC, Tupler LA, Blitchington T, Kelly L, Krishnan KR: Focal and lateralized subcortical abnormalities in unipolar major depressive disorder: an automated multivoxel proton magnetic resonance spectroscopy study. Biol Psychiatry 2003; 54:744–750Google Scholar
16. Li BS, Wang H, Gonen O: Metabolite ratios to assumed stable creatine level may confound the quantification of proton brain MR spectroscopy. Magn Reson Imaging 2003; 21:923–928Google Scholar
17. Manji HK, Drevets WC, Charney DS: The cellular neurobiology of depression. Nat Med 2001; 7:541–547Google Scholar
18. Vaughan JT, Hetherington HP, Otu JO, Pan JW, Pohost GM: High frequency volume coils for clinical NMR imaging and spectroscopy. Magn Reson Med 1994; 32:206–218Google Scholar
19. Goelman G, Liu S, Hess D, Gonen O: Optimizing the efficiency of high-field multivoxel spectroscopic imaging by multiplexing in space and time. Magn Reson Med 2006; 56:34–40Google Scholar
20. Soher BJ, Young K, Govindaraju V, Maudsley AA: Automated spectral analysis III: application to in vivo proton MR spectroscopy and spectroscopic imaging. Magn Reson Med 1998; 40:822–831Google Scholar
21. Inglese M, Li BS, Rusinek H, Babb JS, Grossman RI, Gonen O: Diffusely elevated cerebral choline and creatine in relapsing-remitting multiple sclerosis. Magn Reson Med 2003; 50:190–195Google Scholar
22. Traber F, Block W, Lamerichs R, Gieseke J, Schild HH: 1H metabolite relaxation times at 3.0 tesla: measurements of T1 and T2 values in normal brain and determination of regional differences in transverse relaxation. J Magn Reson Imaging 2004; 19:537–545Google Scholar
23. Ethofer T, Mader I, Seeger U, Helms G, Erb M, Grodd W, Ludolph A, Klose U: Comparison of longitudinal metabolite relaxation times in different regions of the human brain at 1.5 and 3 Tesla. Magn Reson Med 2003; 50:1296–1301Google Scholar
24. Chakos MH, Lieberman JA, Bilder RM, Borenstein M, Lerner G, Bogerts B, Wu H, Kinon B, Ashtari M: Increase in caudate nuclei volumes of first-episode schizophrenic patients taking antipsychotic drugs. Am J Psychiatry 1994; 151:1430–1436Google Scholar
25. Harte MK, Bachus SB, Reynolds GP: Increased N-acetylaspartate in rat striatum following long-term administration of haloperidol. Schizophr Res 2005; 75:303–308Google Scholar
26. Krishnan KR, McDonald WM, Escalona PR, Doraiswamy PM, Na C, Husain MM, Figiel GS, Boyko OB, Ellinwood EH, Nemeroff CB: Magnetic resonance imaging of the caudate nuclei in depression: preliminary observations. Arch Gen Psychiatry 1992; 49:553–557Google Scholar
27. Mendez MF, Adams NL, Lewandowski KS: Neurobehavioral changes associated with caudate lesions. Neurol 1989; 39:349–354Google Scholar
28. Mayberg HS, Starkstein SE, Sadzot B, Preziosi T, Andrezejewski PL, Dannals RF, Wagner HN Jr, Robinson RG: Selective hypometabolism in the inferior frontal lobe in depressed patients with Parkinson’s disease. Ann Neurol 1990; 28:57–64Google Scholar
29. Loffelholz K, Klein J, Koppen A: Choline, a precursor of acetylcholine and phospholipids in the brain. Prog Brain Res 1993; 98:197–200Google Scholar
30. Miller DH, Albert PS, Barkhof F, Francis G, Frank JA, Hodgkinson S, Lublin FD, Paty DW, Reingold SC, Simon J: Guidelines for the use of magnetic resonance techniques in monitoring the treatment of multiple sclerosis: US National MS Society Task Force. Ann Neurol 1996; 39:6–16Google Scholar
31. Urenjak J, Williams SR, Gadian DG, Noble M: Proton nuclear magnetic resonance spectroscopy unambiguously identifies different neural cell types. J Neurosci 1993; 13:981–989Google Scholar
32. Hamidi M, Drevets WC, Price JL: Glial reduction in amygdala in major depressive disorder is due to oligodendrocytes. Biol Psychiatry 2004; 55:563–569Google Scholar
33. Ongur D, Drevets WC, Price JL: Glial reduction in the subgenual prefrontal cortex in mood disorders. Proc Natl Acad Sci USA 1998; 95:13290–13295Google Scholar
34. Uranova NA, Vostrikov VM, Orlovskaya DD, Rachmanova VI: Oligodendroglial density in the prefrontal cortex in schizophrenia and mood disorders: a study from the Stanley Neuropathology Consortium. Schizophr Res 2004; 67:269–275Google Scholar
35. Miller BL, Chang L, Booth R, Ernst T, Cornford M, Nikas D, McBride D, Jenden DJ: In vivo 1H MRS choline: correlation with in vitro chemistry/histology. Life Sci 1996; 58:1929–1935Google Scholar
36. Fillenz M, Lowry JP, Boutelle MG, Fray AE: The role of astrocytes and noradrenaline in neuronal glucose metabolism. Acta Physiol Scand 1999; 167:275–284Google Scholar
37. Exton JH: Signaling through phosphatidylcholine breakdown. J Biol Chem 1990; 265:1–4Google Scholar
38. Exton JH: Phosphatidylcholine breakdown and signal transduction. Biochim Biophys Acta 1994; 1212:26–42Google Scholar
39. Manji HK, Chen G: Post-receptor signaling pathways in the pathophysiology and treatment of mood disorders. Curr Psychiatry Rep 2000; 2:479–489Google Scholar
40. Akompong T, Spencer RL, McEwen BS: Glucocorticoids inhibit soluble phospholipase C activity and cytosolic guanine nucleotide regulatory protein-alpha-i immunoreactivity in spleen. Endocrinology 1993; 133:1963–1970Google Scholar
41. Davis JM, Janowsky D: Proceedings: cholinergic and adrenergic balance in mania and schizophrenia. Psychopharmacol Bull 1974; 10:49–50Google Scholar
42. Farchione TR, Moore GJ, Rosenberg DR: Proton magnetic resonance spectroscopic imaging in pediatric major depression. Biol Psychiatry 2002; 52:86–92Google Scholar
43. Caetano SC, Fonseca M, Olvera RL, Nicoletti M, Hatch JP, Stanley JA, Hunter K, Lafer B, Pliszka SR, Soares JC: Proton spectroscopy study of the left dorsolateral prefrontal cortex in pediatric depressed patients. Neurosci Lett 2005; 384:321–326Google Scholar
44. Mirza Y, Tang J, Russell A, Banerjee SP, Bhandari R, Ivey J, Rose M, Moore GJ, Rosenberg DR: Reduced anterior cingulate cortex glutamatergic concentrations in childhood major depression. J Am Acad Child Adolesc Psychiatry 2004; 43:341–348Google Scholar
45. Steingard RJ, Yurgelun-Todd DA, Hennen J, Moore JC, Moore CM, Vakili K, Young AD, Katic A, Beardslee WR, Renshaw PF: Increased orbitofrontal cortex levels of choline in depressed adolescents as detected by in vivo proton magnetic resonance spectroscopy. Biol Psychiatry 2000; 48:1053–1061Google Scholar
46. MacMaster FP, Kusumakar V: Choline in pediatric depression. McGill J Med 2006; 9:27–29Google Scholar
47. Kusumakar V, MacMaster FP, Gates L, Sparkes SJ, Khan SC: Left medial temporal cytosolic choline in early onset depression. Can J Psychiatry 2001; 46:959–964Google Scholar
48. Smith EA, Russell A, Lorch E, Banerjee SP, Rose M, Ivey J, Bhandari R, Moore GJ, Rosenberg DR: Increased medial thalamic choline found in pediatric patients with obsessive-compulsive disorder versus major depression or healthy control subjects: a magnetic resonance spectroscopy study. Biol Psychiatry 2003; 54:1399–1405Google Scholar
49. Kemp GJ: Non-invasive methods for studying brain energy metabolism: what they show and what it means. Dev Neurosci 2000; 22:418–428Google Scholar
50. Mader I, Roser W, Kappos L, Hagberg G, Seelig J, Radue EW, Steinbrich W: Serial proton MR spectroscopy of contrast-enhancing multiple sclerosis plaques: absolute metabolic values over 2 years during a clinical pharmacological study. Am J Neuroradiol 2000; 21:1220–1227Google Scholar
51. Drevets WC, Raichle ME: Neuroanatomical circuits in depression: implications for treatment mechanisms. Psychopharmacol Bull 1992; 28:261–274Google Scholar
52. Smith KA, Morris JS, Friston KJ, Cowen PJ, Dolan RJ: Brain mechanisms associated with depressive relapse and associated cognitive impairment following acute tryptophan depletion. Br J Psychiatry 1999; 174:525–529Google Scholar
53. Neumeister A, Drevets WC, Belfer I, Luckenbaugh DA, Henry S, Bonne O, Herscovitch P, Goldman D, Charney DS: Effects of a alpha2C-adrenoreceptor gene polymorphism on neural responses to facial expressions in depression. Neuropsychopharmacology 2006; 31:1750–1756Google Scholar
54. Kumano H, Ida I, Oshima A, Takahashi K, Yuuki N, Amanuma M, Oriuchi N, Endo K, Matsuda H, Mikuni M: Brain metabolic changes associated with predispotion to onset of major depressive disorder and adjustment disorder in cancer patients: a preliminary PET study. J Psychiatr Res 2007; 41:591–599Google Scholar
55. Renshaw PF, Parow AM, Hirashima F, Ke Y, Moore CM, Frederick BdeB, Fava M, Hennen J, Cohen BM: Multinuclear magnetic resonance spectroscopy studies of brain purines in major depression. Am J Psychiatry 2001; 158:2048–2055Google Scholar
56. Moore CM, Christensen JD, Lafer B, Fava M, Renshaw PF: Lower levels of nucleoside triphosphate in the basal ganglia of depressed subjects: a phosphorous-31 magnetic resonance spectroscopy study. Am J Psychiatry 1997; 154:116–118Google Scholar
57. Mirza Y, O’Neill J, Smith EA, Russell A, Smith JM, Banerjee SP, Bhandari R, Boyd C, Rose M, Ivey J, Renshaw PF, Rosenberg DR: Increased medial thalamic creatine-phosphocreatine found by proton magnetic resonance spectroscopy in children with obsessive-compulsive disorder versus major depression and healthy controls. J Child Neurol 2006; 21:106–111Google Scholar
58. Baslow MH: Functions of N-acetyl-L-aspartate and N-acetyl-L-aspartylglutamate in the vertebrate brain: role in glial cell-specific signaling. J Neurochem 2000; 75:453–459Google Scholar
59. Simmons ML, Frondoza CG, Coyle JT: Immunocytochemical localization of N-acetyl-aspartate with monoclonal antibodies. Neuroscience 1991; 45:37–45Google Scholar
60. Moffett JR, Namboodiri MA, Cangro CB, Neale JH: Immunohistochemical localization of N-acetylaspartate in rat brain. Neuroreport 1991; 2:131–134Google Scholar
61. Vataja R, Leppavuori A, Pohjasvaara T, Mantyla R, Aronen HJ, Salonen O, Kaste M, Erkinjuntti T: Poststroke depression and lesion location revisited. J Neuropsychiatry Clin Neurosci 2004; 16:156–162Google Scholar
62. Starkstein SE, Robinson RG: Affective disorders and cerebral vascular disease. Br J Psychiatry 1989; 154:170–182Google Scholar
63. Starkstein SE, Parikh RM, Robinson RG: Post-stroke depression and recovery after stroke. Lancet 1987; 1:743Google Scholar
64. Pillay SS, Renshaw PF, Bonello CM, Lafer BC, Fava M, Yurgelun-Todd D: A quantitative magnetic resonance imaging study of caudate and lenticular nucleus gray matter volume in primary unipolar major depression: relationship to treatment response and clinical severity. Psychiatry Res 1998; 84:61–74Google Scholar
65. Henry ME, Kaufman MJ, Hennen J, Michelson D, Schmidt ME, Stoddard E, Vukovic AJ, Barreira PJ, Cohen BM, Renshaw PF: Cerebral blood volume and clinical changes on the third day of placebo substitution for SSRI treatment. Biol Psychiatry 2003; 53:100–105Google Scholar
66. Sonawalla SB, Renshaw PF, Moore CM, Alpert JE, Nierenberg AA, Rosenbaum JF, Fava M: Compounds containing cytosolic choline in the basal ganglia: a potential biological marker of true drug response to fluoxetine. Am J Psychiatry 1999; 156:1638–1640Google Scholar