Volumetric Analysis and Three-Dimensional Glucose Metabolic Mapping of the Striatum and Thalamus in Patients With Autism Spectrum Disorders
Abstract
Objective: In patients with autism, behavioral deficits as well as neuroimaging studies of the anterior cingulate cortex suggest ventral rather than dorsal striatal and thalamic abnormalities in structure and function. The authors used imaging studies to map volumetric and metabolic differences within the entire dorsoventral extent of the striatum and thalamus. Method: Magnetic resonance imaging (MRI) and positron emission tomography (PET) were used to measure volumes and metabolic activity in the thalamus, caudate, and putamen in 17 patients with autism or Asperger’s disorder and 17 age- and sex-matched comparison subjects. Subjects performed a serial verbal learning test during the [ 18 F]-fluorodeoxyglucose uptake period. The regions of interest were outlined on contiguous axial MRI slices. After PET/MRI coregistration, region-of-interest coordinates were applied to the PET scan for each individual. Between-group differences in metabolism were assessed by three-dimensional statistical probability mapping. Results: The patients with autism spectrum disorders had greater volumes of the right caudate nucleus than comparison subjects as well as a reversal of the expected left-greater-than-right hemispheric asymmetry. Patients also had lower relative glucose metabolic rates bilaterally in the ventral caudate, putamen, and thalamus. Patients with autism had lower metabolic activity in the ventral thalamus than those with Asperger’s disorder, but they did not differ from comparison subjects in metabolic activity in the caudate nucleus. Conclusions: These results are consistent with a deficit in the anterior cingulate-ventral striatum-anterior thalamic pathway in patients with autism spectrum disorders. The results also suggest an important role for the caudate in helping support working-memory demands.
In postmortem studies of patients with autism, abnormalities are found in the limbic cortex, the cerebellum, and the white matter of the brain, but not in the frontal cortex, the basal ganglia, or the thalamus (1) . Subtle changes in frontal cortical organization (2 , 3) and greater cerebral gray matter volume (4) have also been observed. By contrast, clinical observations in patients with autism reveal stereotypies (5 – 7) , gross motor function abnormalities (8) , reward system deficits, and impairment in auditory, tactile, and visual sensory stimuli processing (9 , 10) , which are suggestive of functional impairments in the caudate, the putamen, and the thalamus. Disordered reward systems have been reported to have an influence on stereotypies (11) and sensory stimulation (12) in autism, which is also consistent with a possible striatal deficit. Lastly, the serotonin- and dopamine-rich striatum is affected by atypical antipsychotics and serotonin reuptake inhibitors (13) , which are frequently used in the treatment of autism.
Among magnetic resonance imaging (MRI) studies comparing patients with autism and comparison subjects, one study reported a larger caudate (14) with no change in putamen size in the autistic group, whereas other studies found no difference between patients and comparison subjects in the size of the striatum (15 – 19) . One computerized tomography study reported smaller caudate volumes in autistic patients relative to comparison subjects (20) , and a study of a twin pair discordant for autism found a smaller caudate in the affected twin (21) . Studies of the thalamus in autism were also divided, with one study finding lower volumes in autistic patients (22) and two studies finding no significant differences between patients and comparison subjects (18 , 20) .
Early functional imaging studies (23 – 25) found widespread cortical and subcortical metabolic abnormalities in autistic patients, as well as possible abnormalities in the basal ganglia and thalamus, but these positron emission tomography (PET) studies did not use MRI coregistration for precise location of the suspected metabolic variations. Decreased serotonin synthesis has been reported in the thalamus and frontal lobe of autistic children (26) , and decreased activity has been reported in the same pathway in autistic adults performing a verbal task (27) .
We reported previously (28 , 29) that we found no volumetric or metabolic differences between patients with autism spectrum disorders and comparison subjects in the hippocampus and amygdala. However, in the same cohort, the autism spectrum patients had smaller right anterior cingulate volumes and lower glucose metabolic rates bilaterally in the anterior cingulate during performance of a verbal memory task. The cortico-striato-thalamic loop has been posited as critical in sensory regulation (30) , and the pattern of abnormalities we observed suggested the need to examine the next way stations in the circuit. Pathways from the anterior cingulate pass via the ventral striatum to the thalamus (31) , and the anterior cingulate appears to be closely connected to the anterior thalamus (32 – 34) . In the neural circuits proposed by Alexander et al. (31 , 35 , 36) —loops involving frontal lobe, cingulate, striatum, and thalamus—a distinction is made between the dorsal and ventral striatum. This distinction appears to be of potential interest in autism.
Functional differences between the ventral and dorsal portions of the striatum have been explored both in neuroimaging studies of healthy volunteers and in animal studies. In a functional MRI (fMRI) study of normal adults, the ventral striatum was associated with the prediction of future rewards and the dorsal striatum with the maintenance of information (37) . In rats, ventral lesions have been linked to deficits in delayed matching-to-sample performance that do not occur with dorsal or medial lesions (38) . Ventral areas may also be important for information held in working memory, and dorsal areas appear to be linked to responding on the basis of external stimuli (39) .
Our aim in this study was to further investigate the dorsal-ventral anatomic distinction, which has not been a focus of previous studies of the striatum in autism. Using data from the same cohort we reported on earlier (29) , we outlined structures on contiguous axial slices of high-resolution MR images and reconstructed regions of interest to yield three-dimensional maps of volumetric and metabolic differences within the entire dorsoventral extent of these structures. We hypothesized that caudate volumes would be larger in patients with autism spectrum disorders than in comparison subjects, as we reported previously (29) . Because functional images were acquired during the performance of a verbal learning task, we also expected to observe differences between patients and comparison subjects in relative glucose metabolic rate in the anterior cingulate-striatum-thalamus circuit.
Method
Subjects
Seventeen patients (15 men and two women; mean age=27.7, SD=11.3, range=17–55) with autism spectrum disorders were recruited for the study. Ten had a diagnosis of autism, and seven had a diagnosis of Asperger’s disorder. We have already reported on findings in the cingulate, amygdala, and hippocampus from this cohort (29) . Patients were screened for other neurological disorders, including seizures and head trauma. Written informed consent was obtained from each subject in accordance with institutional review board requirements. All patients were diagnosed by experienced child psychiatrists using clinical diagnostic interviews based on DSM-IV criteria. The Autism Diagnostic Interview (40) was administered to the parents of 13 of the patients to confirm the diagnosis of an autism spectrum disorder; for the other four patients, parents were either deceased or otherwise unavailable for interview. All patients met DSM-IV criteria for autism or Asperger’s disorder; no patients with Rett’s syndrome or childhood disintegrative disorders were included. All patients were verbally fluent, and the mean full-scale IQ for the group was 97.1 (SD=25.3, range=55–125).
When our autism neuroimaging program began in 1994, a structured interview to distinguish Asperger’s disorder from autism was not yet available, so all subgroup diagnoses were made by an experienced clinician (C.C.). One patient was being treated with nortriptyline at the time of the scan, but the others had not taken psychoactive medications for at least several months.
Healthy volunteers were recruited from the community in the vicinity of Mount Sinai Medical School (15 men and two women; mean age=28.8, SD=9.4, range=20–56; mean IQ=111.5, SD=14.3, range=88–136). They were screened for neurological and psychiatric illnesses, family history of axis I psychiatric illnesses in first-degree relatives, and presence of psychoactive substances in the urine at the time of the imaging scan. Subjects in the comparison group were age- and sex-matched to the patient group.
Imaging
Axial MR scans were acquired with a 1.5-Tesla GE Signa-5x system using spoiled three-dimensional volume gradient-recall acquisition in the steady state (TR=24, TE=5, flip angle=40 degrees, contiguous 1.2-mm slices). PET scans using [ 18 F]fluorodeoxyglucose (FDG) as a ligand were acquired with a GE-2048 head-dedicated scanner in the research group’s laboratory, operated by the authors (M.S.B. and M.M.H.). All scanning parameters and image-acquisition methods were kept constant during the study period. As a control of mental activity during the FDG uptake period, subjects performed a variant of the California Verbal Learning Test (41) , modified for use in an imaging experiment (a 16-word list was presented on a screen, with a 2-second interword interval and four semantic categories) (42) . The test yielded scores for mean number of words correct, perseverations, intrusions, and semantic categorization. Subjects were then moved to the PET scanner (full width at half maximum=4.2–4.5 mm), and scans with 3–5 million counts/slice were acquired.
Tracing of the Caudate, Putamen, and Thalamus
Two trained researchers without knowledge of subjects’ diagnoses outlined the caudate, putamen, and thalamus on axial MRI slices ( Figure 1 ) as described in other studies (44 , 45) . For each structure, both an absolute volume in mm 3 and a relative value, the ratio of the structure’s volume to the subject’s body surface area, were calculated. Volumes were calculated by summing the areas of the structures’ outlines on consecutive slices. First, the number of pixels within each outline for each structure was computed through a software program, and that number was multiplied by the number of slices containing outlines of that structure to calculate the total number of contiguous pixels. Each pixel corresponds to a 0.89 mm × 0.89 mm square and the thickness of each MR slice is 1.2 mm, so we multiplied the total number of pixels by the constant 0.95 (0.89 2 ×1.2) to calculate the volume of each structure in mm 3 .
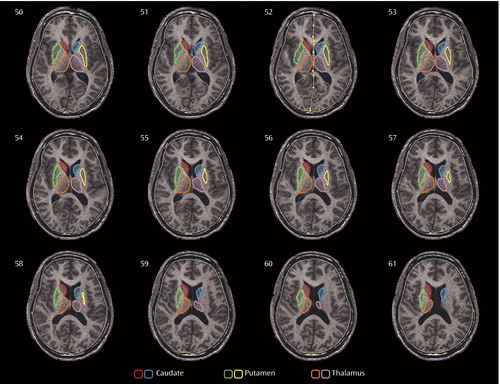
a The caudate (red, blue), putamen (green, yellow), and thalamus (orange, pink) are traced on every consecutive slice. The outlining for the caudate and putamen began on the ventral-most slice (at approximately 31% of the head height from the canthomeatal line [43]), where the two structures are separated by a body of white matter. By using these strict criteria, we excluded the ventral-most part of both structures from the volumetric and metabolic analyses; however, our method allowed us to examine the two structures separately. The outlining was carried out dorsally, to the dorsal-most extent. For the thalamus, tracing began at the most ventral part of the structure (approximately 34% of the head height) and was carried out dorsally to the axial slice where the structure disappears (approximately 53% of head height). To evaluate reliability between the two researchers tracing the structures, we computed the total number of pixels each researcher outlined for each structure on MR images from five subjects at the 25th, 50th, and 75th percentiles of the height of the structures. The intertracer intraclass coefficients for the area measurements were 0.92 for the caudate, 0.90 for the putamen, and 0.87 for the thalamus.
Statistical Methods
For volumetric analyses, all the absolute volumes of the regions of interest were entered to an analysis of variance (ANOVA) to assess group differences between patients with autism spectrum disorders and comparison subjects. Where there were significant group differences, analyses of covariance (ANCOVAs) were carried out with total brain volume and body surface area as covariates. Because there is some evidence of larger overall brain size in autism (46) , we added body surface area as the covariate that best correlates with total brain weight (47) to avoid confounding in the statistical removal of brain size. Simple group ANOVAs and t tests were carried out to assess differences between subgroups.
After PET/MRI coregistration, region-of-interest coordinates were applied to the PET scan for each individual, and metabolic three-dimensional significance probability maps (SPM) (48) of t tests comparing the groups for the three structures were reconstructed (29) . Between-group differences in the metabolism of the caudate, putamen, and thalamus were assessed by three-dimensional SPM mapping with resampling to guard against type I error. To establish the threshold for significance in a t test analysis of 17 normal and 17 autistic subjects, we created a pool of 34 normal subjects by combining an additional 17 normal subjects (12 men, five women; mean age=35.6 years, SD=8.8, range=21–53) with the 17 subjects in our study comparison group. From this pool, we randomly drew two samples of 17 subjects each, a procedure adopted to match our earlier reports (28 , 29) . Whereas the study comparison subjects went through the same research protocol as the autistic spectrum disorder patients, the additional subjects in this comparison subject pool were enrolled in other protocols. They had the same PET scan uptake task, drug screening, psychiatric interview, and medical screening as the study comparison subjects but were not matched by age or sex and did not have IQ testing.
We also carried out ANOVAs on the relative glucose metabolic rates in the regions of interest. We divided each structure into four axial dorsoventral quarters; the bottom 25% of the slices were assigned to segment 1 and the top 25% to segment 4. Repeated-measures ANOVA was carried out to assess group differences (two-by-two-by-four—diagnostic group by hemisphere by region-of-interest segment). Where there were group differences in the volume of the regions of interest, ANCOVA was also carried out to assess metabolic differences; the volume of the structure was used as a covariate, and post hoc t tests were performed to identify effects.
Results
MRI Volume Analysis
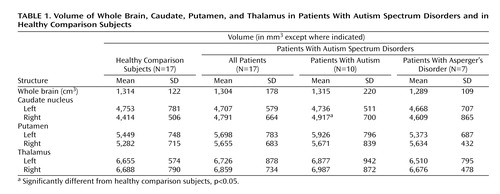
The patients with autism spectrum disorders had larger right caudate volumes than the comparison group and exhibited a reversal of the expected hemispheric asymmetry (group by hemisphere, F=6.65, df=1, 32, p=0.0147). This finding was unchanged when brain volume was partialed out, and its statistical significance increased when body surface area was entered as a covariate (F=9.00, df=1, 31, p=0.0053). When an ANOVA on caudate volume was carried out with three groups—patients with autism, patients with Asperger’s disorder, and comparison subjects), the hemisphere-by-group interaction was significant (F=3.86, df=2, 31, p=0.0319). The greatest difference was observed in volume of the right caudate between the autistic subgroup and the comparison subjects (4,917 mm 3 and 4,414 mm 3 , respectively; t=2.16, df=25, p=0.04). There were no significant group differences or group-by-hemisphere interactions for volume of the thalamus or putamen ( Table 1 ). Combining all three structures in a three-way ANOVA yielded a nearly significant hemisphere-by-group interaction (F=4.11, df=1, 32, p=0.051).
Functional Activity: Three-Dimensional Statistical Parametric Mapping
The patients with autism spectrum disorders had significantly lower relative metabolic rates in the ventral caudate nucleus bilaterally than comparison subjects but higher relative glucose metabolic rates in the left dorsal caudate ( Figure 2 ). A similar dorsoventral pattern is seen in the putamen and thalamus ( Figure 3 ).
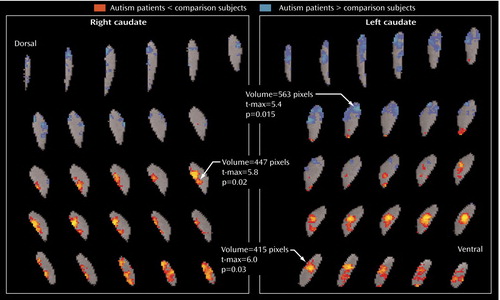
a The threshold for colored pixels is a p value of 0.05 (two-tailed, uncorrected). All regions of interest were adjusted to the mean normal number of slices by interpolation. For each individual, the region of interest was then warped to an averaged contour of the normal group (29). For each random sample, pixel-by-pixel t tests were performed. The image was thresholded at the p<0.05 level (t=2.04, df=32, p<0.05). In each cluster of pixels above the threshold, the number of contiguous pixels was counted, and the volume of the largest cluster (number of contiguous pixels multiplied by the average t value height above t=2.04, p<0.05) was determined (i.e., 100 pixels with a mean t value of 2.68 yield a volume of 64). An empirical table was generated of cluster volume by generating 5,000 random samples of 34 normal subjects and obtaining the single largest cluster for each random draw. Volumes for 95% were obtained, permitting a test of whether any given pixel cluster volume might have occurred by chance if subject groups differed no more than random sets of healthy volunteers. Patients with autism spectrum disorders (N=17) had lower relative glucose metabolic rates than age- and sex-matched comparison subjects in the ventral caudate bilaterally (right caudate: volume=447 pixels, t-max=5.8, t=2.04, df=32, p<0.05; left caudate: volume=415 pixels, t-max=6.0, t=2.04, df=32, p<0.05). However, the autism spectrum disorders group had higher relative metabolic rates in the left dorsal caudate (volume=563 pixels, t-max=5.4, t=2.04, df=32, p<0.05).
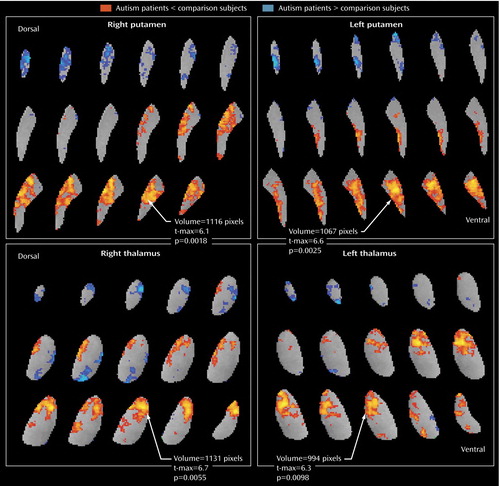
a Autism spectrum disorder patients have lower relative metabolic activity in the putamen bilaterally than age- and sex-matched comparison subjects (right putamen: volume=1,116 pixels, t-max=6.1, t=2.04, df=32, p<0.01; left putamen: volume=1,067 pixels, t-max=6.6, t=2.04, df=32, p<0.01). Similarly, the autism spectrum disorder patients have lower metabolic activity than control subjects in the anterior thalamus bilaterally (right thalamus: volume=1,131 pixels, t-max=6.7, t=2.04, df=32, p<0.01; left thalamus: volume=994 pixels, t-max=6.3, t=2.04, df=32, p<0.01). As for the caudate, the more dorsal regions tended to show more activity in autism patients than in comparison subjects, but these clusters (blue) did not reach rigorous resampling criteria for significance.
In subgroup analyses, the autistic patients did not differ significantly from comparison subjects in relative metabolic rates of the caudate. The Asperger’s subgroup, however, had significantly lower relative metabolic rates in the right ventral caudate (volume=492 pixels, t-max=6.7, t=2.074, df=22, p<0.05) and higher rates in the left dorsal caudate (volume=428 pixels, t-max=6.0, t=2.074, df=22, p<0.05) than comparison subjects ( Figure 4 ). Both autism spectrum subgroups showed lower relative metabolic rates bilaterally in the putamen. In the thalamus, autistic patients had lower relative metabolic rates than comparison subjects (volume=653 pixels, t-max=5.8, t=2.06, df=25, p<0.05), and Asperger’s patients had lower rates than comparison subjects in the anterior aspect (volume=980 pixels, t-max=7.2, t=2.074, df=22, p<0.05) and higher rates in the region of the pulvinar (extending partly into the medial dorsal) nucleus of the thalamus (volume=1,011 pixels, t-max=7.3, t=2.074, df=22, p<0.05) ( Figure 5 ).
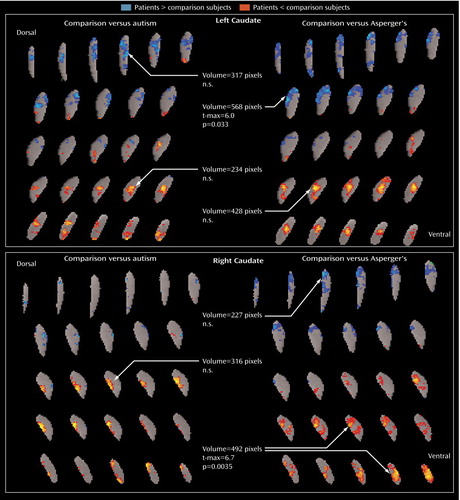
a The Asperger’s subgroup had lower metabolic activity in the right ventral caudate than age- and sex-matched comparison subjects (volume=492 pixels, t-max=6.7, t=2.074, df=32, p<0.05), and greater activity in the left dorsal caudate (volume=428 pixels, t-max=6.0, t=2.074, df=32, p<0.05). Both the autism subgroup and the Asperger’s subgroup had lower metabolic activity bilaterally in putamen.
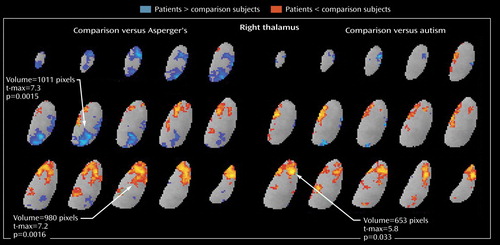
a Autistic patients had lower relative metabolic rates than age- and sex-matched comparison subjects (volume=653, t-max=5.8, t=2.06, df=25, p<0.05), and Asperger’s patients had lower relative metabolic rates in the anterior aspect of the thalamus (volume=980, t-max=7.2, t=2.074, df=22, p<0.05) and higher relative rates in the medial dorsal aspect (volume=1,011, t-max=7.3, t=2.074, df=22, p<0.05).
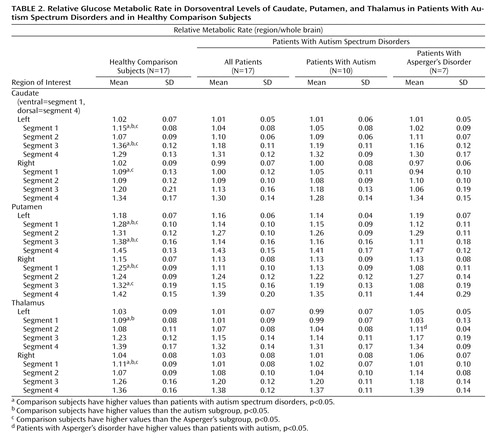
Functional Activity: Region-of-Interest-Based ANOVA
The patients with autism spectrum disorders had significantly lower relative metabolic rates in the ventral caudate bilaterally than comparison subjects (group-by-segment interaction, F=5.63, Huynh-Feldt adjusted df=1.63, 52.27, p=0.0095), a finding that was unchanged when caudate volumes were partialed in ANCOVA. The relative metabolic rates were lower bilaterally in the ventral-most caudate (segment 1) in the autism spectrum disorders group (right: 1.09 versus 1.00 [t=2.12, df=32, p=0.042], left: 1.15 versus 1.04 [t=3.83, df=32, p=0.0006]) ( Table 2 ). ANOVA on the relative metabolic rates of the segments of the putamen confirmed the SPM results showing bilateral reduction of relative glucose metabolic rates in the autism spectrum disorders group (segment-by-group interaction, F=9.97, Huynh-Feldt adjusted df=2.17, 69.57, p=0.0001), but the difference between groups in relative metabolic rates of the thalamus was not quite significant (F=2.62, Huynh-Feldt adjusted df=1.69, 54.21, p=0.09). A three-group ANOVA with comparison subjects, subjects with autism, and subjects with Asperger’s disorder confirmed group differences (caudate segment by group, F=3.78, df=3.46, 53.59, p=0.012). In two-group simple ANOVAs on structures, the autistic subgroup showed larger metabolic differences on the left ventral caudate (group-by-hemisphere-by-segment interaction, F=3.90, p=0.032), and the Asperger’s subgroup showed bilateral metabolic alterations mainly in the ventral caudate (group-by-segment interaction, F=5.67, p=0.009). Confirming the SPM findings, both autism spectrum disorder subgroups showed lower relative metabolic rates than comparison subjects in the putamen bilaterally (group-by-segment interaction, autism vs. comparison subjects, F=4.73, p=0.009; Asperger’s patients vs. comparison subjects, F=11.44, p<0.001). Comparisons of patients with autism and Asperger’s disorder by ANOVA or exploratory segment t tests ( Table 2 ) did not reveal statistically significant differences.
For the thalamus, the ANOVA produced only effects that were not quite significant, but it did so for the same findings that were significantly confirmed with the three-dimensional mapping. The two-group ANOVA showed a region-of-interest segment by group interaction (F=2.62, df=1.69, 54.21, p=0.09) that missed significance, although the significant multivariate analysis (F=5.38, df=3, 30, p=0.0044) supported the ventral thalamic decrease. With the same ANOVA design, there were no metabolic differences between the autism subgroup and the comparison group in the thalamus, and a finding of lower relative metabolic rates bilaterally in the ventral thalamus in the Asperger’s patients than in the comparison subjects was nearly significant (group-by-segment interaction, F=3.12, p=0.07). Comparisons of the autism and Asperger’s groups with ANOVA were not significant, although exploratory t tests found that in segment 2 (ventral) metabolic activity was lower in the autism subgroup than in the Asperger’s subgroup.
Structure Volume and Correlations of Relative Metabolic Rates With Age and Task Performance
Comparison subjects recalled more words correctly than patients with autism spectrum disorders (mean=13.9, SD=1.3, compared with mean=11.0, SD=3.9; t=2.78, df=18.2, p=0.012) and were more likely to use a strategy of semantic categorization (mean=8.8, SD=2.6, compared with mean=5.3, SD=3.7; t=3.16, df=31, p=0.0035). While the comparison subjects showed an age-related increase in relative glucose metabolic rates in the left caudate (r=0.56, p<0.05) and thalamus (r=0.56, p<0.05), no significant correlation between age and relative metabolic rates was observed in autism spectrum disorder patients. Neither group showed significant correlations between age and structure volumes. The comparison subjects had higher relative metabolic rates in the right thalamus and right putamen, and these were associated with the number of correct words recalled (r=0.61, p<0.01 for both structures), whereas no significant correlations between activity and performance were seen in the patient group. Use of semantic categorization in word recall correlated with relative metabolic rates of the right thalamus (r=0.61, p<0.01) and right putamen (r=0.63, p<0.01) in comparison subjects, but not in the patient group. Neither group showed any significant correlations between volumetric structure and task performance.
Discussion
Findings of larger brain volumes in autistic patients compared with healthy subjects have been reported in some (e.g., reference 49 ) but not all (e.g., reference 50 ) studies investigating this issue. Recent studies have found that total brain volume is higher in autistic patients when they are young children but that among adults, brain volumes are indistinguishable between patients and comparison subjects (51 – 54) . In our cohort of adult patients, no group differences were observed in total brain volume (29) , which allowed us to examine the volumes of structures both in absolute terms (measured in mm 3 ) and relative to total brain volume to remove individual differences in body size.
The absolute volume of the right caudate was significantly greater in the autistic subgroup than in the comparison subjects, but the greater volume was not significant for the entire autism spectrum disorders group. The effect size for the right caudate for all 17 patients was 0.64, similar to the 0.61 effect size we calculated from data presented in an earlier report showing significantly larger caudate volumes among patients (14) . However, with our group size of 17, we had a power of only 42% to detect this size effect, whereas the other study, with N=35, had a power of 74%.
Using data from a study in which nonsignificant caudate enlargement was reported (16) , we again calculated a caudate effect size of 0.61, but the power in that study was only 41%. In a third study (17) , in which nonsignificant enlargement was reported in the right caudate in patients with Asperger’s disorder, the effect size was only 0.14 (comparable to our effect size of 0.28 for this subgroup), although correction for intracranial volume reduced the effect size to 0.0 in their data. A fourth study (18) had a very small negative effect size for the right caudate (–0.02). In our data, the finding of right caudate enlargement in the autism spectrum disorders group was not affected by partialing brain volume, and it gained significance when body surface area was used as a covariate. As others have reported in MRI studies (14 , 18) , we found no group differences in volumes of the putamen or thalamus.
The finding of larger caudate volumes cannot be explained by exposure to antipsychotic medication; only two of the autism spectrum disorder patients had a history of exposure to antipsychotics, and neither had used antipsychotics within the previous year. Previously, our group reported correlations between higher-order repetitive behavior and right caudate enlargement in a group of autism spectrum patients, most of whom are included in this study. Caudate enlargement has also been reported in patients with somatization disorder (56) and in patients with schizophrenia who have been treated with antipsychotics (45) . In the absence of treatment with antipsychotics and differences in total brain volume, the enlargement of the right caudate in the autistic subgroup, coupled with an altered metabolic pattern in the caudate and thalamus, suggests a disturbance in striatothalamic circuitry. This finding requires replication, however, because of the small sample size (N=10).
These striatothalamic alterations, along with the failure of the ventral striatum to activate while subjects are performing a task involving verbal memory and semantic categorization, point to a deficit in frontal-cingulate-striatal-thalamic interconnections (57) . A task that involved specific rule-based semantic categorization in normal subjects (57) activated the caudate ventrally (z=–4), while a similarity-based categorization (a comparison with previously encountered examples) evoked caudate activation at a slightly higher level (z=0). Both of these points are relatively ventral, since our tracing extends 2 cm higher (z=20–24). These findings suggest the importance of the caudate for resource-demanding tasks, helping support working-memory demands. This interpretation of the role of the caudate in semantic memory is consistent with the heavy memory load imposed by the verbal memory task in this study.
The area of metabolic hypoactivity that we observed in the thalamus appears to be in the anterior nucleus, which is closely connected to the anterior cingulate cortex (32 – 34) . We reported lower glucose metabolism in the anterior cingulate for the same cohort (28 , 29) , and another group reported that bipolar patients who performed poorly on the California Verbal Learning Test, which is closely analogous to the task used here, were found to have a lower gray matter density in the anterior cingulate (58) . In the present study, two findings combine to suggest an impairment in the function of this circuit in autistic patients. First, in our comparison group, the ability to semantically categorize the word list was correlated with the relative metabolic rates of both the thalamus and the putamen, whereas the patients with autism spectrum disorders showed no such correlations, which is consistent with disturbed coupling. Interestingly, unilateral lesions of the anterior thalamus in monkeys impair assessment of semantic knowledge (59) . The left anterior thalamus has also been reported to show greater activation during encoding of complex semantic distinctions in human fMRI studies (60) . Second, the finding of low metabolic activity in the anterior cingulate, ventral (but not dorsal) striatum, and anterior thalamus but not the pulvinar, temporal cortex, hippocampus, or amygdala, and in medial but not dorsolateral cortex (61) , links these structures. Our findings are not inconsistent with previous reports on the functional alteration of the dentato-thalamo-cortical pathway in autism (62) .
Activation of the pulvinar may be a compensatory mechanism to moderate deficits in patients with Asperger’s disorder. While both the patients with autism and those with Asperger’s disorder had low relative metabolic rates in the anterior thalamic nucleus, rates in the medial dorsal nuclei and the pulvinar were even higher in the Asperger’s subgroup than in the comparison group. Asperger’s patients did not differ from comparison subjects in their ability to semantically categorize the word list, possibly because they are able to use other circuitries successfully (e.g., the mediodorsal thalamic nuclei-frontal cortex or the pulvinar-temporal lobe). This pulvinar-mediodorsal activity (the blue areas in Figure 5 ) may reflect an important compensatory response involved in ameliorating anterior thalamic deficits.
The metabolic activity of the dorsal and ventral caudate nucleus differed markedly between our autism spectrum disorder patients and our comparison subjects. The patient group had lower relative glucose metabolic rates ventrally but higher rates dorsally, which is consistent with the differential roles of the ventral and dorsal striatum, as reviewed above. Dorsal activation, by contrast, might have been expected in a sensory task, such as the continuous performance task or a reaction-time task. Alternatively, if reward aspects are the most important, autistic patients might exhibit both ventral and dorsal deficits when continuous performance or reaction-time tasks are performed but only ventral deficits in tasks that engage ventral cognitive circuits. Also interesting to note is that the Asperger’s patients had higher metabolic activity than comparison subjects in the left dorsal caudate, which is similar to the metabolic pattern seen in obsessive-compulsive disorder, especially in patients who respond to serotonin reuptake inhibitors (63 , 64) .
Limitations of this study include its relatively small sample size, the overrepresentation of verbally competent patients, the lack of Autism Diagnostic Observation Schedule data on our patient group, and the resolution limits of [ 18 F]fluorodeoxyglucose. While this study had adequate power to detect large effects (85% power to detect an effect size of 1.0), its power to detect subgroup differences was much lower. The patients who participated in this study are representative of approximately 25% of the autism spectrum, and they all have verbal communication skills, relatively high cognitive functions, and no severe neurological impairments. Thus, the findings of this study cannot be generalized to the entire autism spectrum. Also, our division of patients into the autism and Asperger’s subgroups is limited by the lack of structured criteria for this distinction in adults, and our groupings may merely reflect illness severity. The differences between these groups in cognitive abilities were statistically significant, but we did not match patients and comparison subjects on IQ. Although previous studies have not reported lower metabolic activity in the basal ganglia in patients with mental retardation (65) , our findings could have been confounded by the group differences in IQ. Cognitive abilities in autism and Asperger’s disorder also may show complex patterns of individual deficits, and much larger groups would be necessary to separate global deficits from specific cognitive strengths and weaknesses. Lastly, our PET resolution full width at half maximum of 4.5 mm in-plane and 6.5 mm axially is not large relative to portions of the caudate and thalamus. The caudate, 30 mm high and 10 mm at its widest extent ventrally (z=1) (66) , is larger than the amygdala. The anterior thalamic areas probably also include anterior parts of the medial dorsal and ventrolateral nuclei. Enlargement of the third ventricle, as reported elsewhere (67) , might also contribute to diminished anterior activity through partial volume effects, but given that the edge shadow of this structure does not appear in Figure 3 and Figure 5 , such an explanation is less likely.
1. Bauman M, Kemper T: Structural brain anatomy in autism: what is the evidence? in The Neurobiology of Autism, 2nd ed. Edited by Bauman ML, Kemper TL. Baltimore, Johns Hopkins University Press, 1994, pp 121–135Google Scholar
2. Casanova MF, Buxhoeveden DP, Switala AE, Roy E: Neuronal density and architecture (Gray Level Index) in the brains of autistic patients. J Child Neurol 2002; 17:515–521Google Scholar
3. Hardan AY, Jou RJ, Keshavan MS, Varma R, Minshew NJ: Increased frontal cortical folding in autism: a preliminary MRI study. Psychiatry Res 2004; 131:263–268Google Scholar
4. Lotspeich LJ, Kwon H, Schumann CM, Fryer SL, Goodlin-Jones BL, Buonocore MH, Lammers CR, Amaral DG, Reiss AL: Investigation of neuroanatomical differences between autism and Asperger syndrome. Arch Gen Psychiatry 2004; 61:291–298Google Scholar
5. Hollander E, King A, Delaney K, Smith CJ, Silverman JM: Obsessive-compulsive behaviors in parents of multiplex autism families. Psychiatry Res 2003; 117:11–16Google Scholar
6. Brasic JR: Movements in autistic disorder. Med Hypotheses 1999; 53:48–49Google Scholar
7. Rapin I, Katzman R: Neurobiology of autism. Ann Neurol 1998; 43:7–14Google Scholar
8. Hallett M, Lebiedowska MK, Thomas SL, Stanhope SJ, Denckla MB, Rumsey J: Locomotion of autistic adults. Arch Neurol 1993; 50:1304–1308Google Scholar
9. Minshew NJ, Goldstein G, Siegel DJ: Neuropsychologic functioning in autism: profile of a complex information processing disorder. J Int Neuropsychol Soc 1997; 3:303–316Google Scholar
10. Gustafsson L: Inadequate cortical feature maps: a neural circuit theory of autism. Biol Psychiatry 1997; 42:1138–1147Google Scholar
11. Ahearn WH, Clark KM, Gardenier NC, Chung BI, Dube WV: Persistence of stereotypic behavior: examining the effects of external reinforcers. J Appl Behav Anal 2003; 36:439–448Google Scholar
12. Ingersoll B, Schreibman L, Tran QH: Effect of sensory feedback on immediate object imitation in children with autism. J Autism Dev Disord 2003; 33:673–683Google Scholar
13. Buitelaar JK, Willemsen-Swinkels SH: Medication treatment in subjects with autistic spectrum disorders. Eur Child Adolesc Psychiatry 2000; 9(suppl 1):I85–I97Google Scholar
14. Sears LL, Vest C, Mohamed S, Bailey J, Ranson BJ, Piven J: An MRI study of the basal ganglia in autism. Prog Neuropsychopharmacol Biol Psychiatry 1999; 23:613–624Google Scholar
15. Hardan AY, Kilpatrick M, Keshavan MS, Minshew NJ: Motor performance and anatomic magnetic resonance imaging (MRI) of the basal ganglia in autism. J Child Neurol 2003; 18:317–324Google Scholar
16. Herbert MR, Ziegler DA, Deutsch CK, O’Brien LM, Lange N, Bakardjiev A, Hodgson J, Adrien KT, Steele S, Makris N, Kennedy D, Harris GJ, Caviness VS Jr: Dissociations of cerebral cortex, subcortical and cerebral white matter volumes in autistic boys. Brain 2003; 126(part 5):1182–1192Google Scholar
17. McAlonan GM, Daly E, Kumari V, Critchley HD, van Amelsvoort T, Suckling J, Simmons A, Sigmundsson T, Greenwood K, Russell A, Schmitz N, Happe F, Howlin P, Murphy DG: Brain anatomy and sensorimotor gating in Asperger’s syndrome. Brain 2002; 125(part 7):1594–1606Google Scholar
18. Gaffney GR, Kuperman S, Tsai LY, Minchin S: Forebrain structure in infantile autism. J Am Acad Child Adolesc Psychiatry 1989; 28:534–537Google Scholar
19. Aylward EH, Schwartz J, Machlin S, Pearlson G: Bicaudate ratio as a measure of caudate volume on MR images. AJNR Am J Neuroradiol 1991; 12:1217–1222Google Scholar
20. Jacobson R, Le Couteur A, Howlin P, Rutter M: Selective subcortical abnormalities in autism. Psychol Med 1988; 18:39–48Google Scholar
21. Kates WR, Mostofsky SH, Zimmerman AW, Mazzocco MM, Landa R, Warsofsky IS, Kaufmann WE, Reiss AL: Neuroanatomical and neurocognitive differences in a pair of monozygous twins discordant for strictly defined autism. Ann Neurol 1998; 43:782–791Google Scholar
22. Tsatsanis KD, Rourke BP, Klin A, Volkmar FR, Cicchetti D, Schultz RT: Reduced thalamic volume in high-functioning individuals with autism. Biol Psychiatry 2003; 53:121–129Google Scholar
23. Siegel BV Jr, Asarnow R, Tanguay P, Call JD, Abel L, Ho A, Lott I, Buchsbaum MS: Regional cerebral glucose metabolism and attention in adults with a history of childhood autism. J Neuropsychiatry Clin Neurosci 1992; 4:406–414Google Scholar
24. Buchsbaum MS, Siegel BV Jr, Wu JC, Hazlett E, Sicotte N, Haier R, Tanguay P, Asarnow R, Cadorette R, Donoghue D, et al: Attention performance in autism and regional brain metabolic rate assessed by positron emission tomography. J Autism Dev Disord 1992; 22:115–125Google Scholar
25. Rumsey JM, Duara R, Grady C, Rapoport JL, Margolin RA, Rapoport SI, Cutler NR: Brain metabolism in autism. Arch Gen Psychiatry 1985; 42:448–455Google Scholar
26. Chugani DC, Muzik O, Rothermel R, Behen M, Chakraborty P, Manger T, da Silva EA, Chugani HT: Altered serotonin synthesis in the dentatothalamocortical pathway in autistic boys. Ann Neurol 1997; 42:666–669Google Scholar
27. Muller RA, Behen ME, Rothermel RD, Chugani DC, Muzik O, Mangner TJ, Chugani HT: Brain mapping of language and auditory perception in high-functioning autistic adults: a PET study. J Autism Dev Disord 1999; 29:19–31Google Scholar
28. Haznedar MM, Buchsbaum MS, Metzger M, Solimando A, Spiegel-Cohen J, Hollander E: Anterior cingulate gyrus volume and glucose metabolism in autistic disorder. Am J Psychiatry 1997; 154:1047–1050Google Scholar
29. Haznedar MM, Buchsbaum MS, Wei T-C, Hof PR, Cartwright C, Bienstock CA, Hollander E: Limbic circuitry in patients with autism spectrum disorders studied with positron emission tomography and magnetic resonance imaging. Am J Psychiatry 2000; 157:1994–2001Google Scholar
30. Carlsson A: A paradigm shift in brain research. Science 2001; 294:1021–1024Google Scholar
31. Alexander GE, DeLong MR, Strick PL: Parallel organization of functionally segregated circuits linking basal ganglia and cortex. Annu Rev Neurosci 1986; 9:357–381Google Scholar
32. Bentivoglio M, Kultas-Ilinsky K, Ilinsky I: Limbic thalamus: structure, intrinsic organization, and connections, in Neurobiology of Cingulate Cortex and Limbic Thalamus. Edited by Vogt B, Gabriel M. Boston, Birkhauser, 1993, pp 71–122Google Scholar
33. Vertes RP: Analysis of projections from the medial prefrontal cortex to the thalamus in the rat, with emphasis on nucleus reuniens. J Comp Neurol 2002; 442:163–187Google Scholar
34. Gemmell C, O’Mara SM: Plasticity in the projection from the anterior thalamic nuclei to the anterior cingulate cortex in the rat in vivo: paired-pulse facilitation, long-term potentiation, and short-term depression. Neuroscience 2002; 109:401–406Google Scholar
35. Penny J, Young A: Speculations on the functional anatomy of basal ganglia dysfunction. Annu Rev Neurosci 1983; 6:73–94Google Scholar
36. Swerdlow N, Koob G: Dopamine, schizophrenia, mania, and depression: towards a unified hypothesis of cortico-striato-pallido-thalamic function. Behav Brain Sci 1987; 10:197–245Google Scholar
37. O’Doherty J, Dayan P, Schultz J, Deichmann R, Friston K, Dolan RJ: Dissociable roles of ventral and dorsal striatum in instrumental conditioning. Science 2004; 304:452–454Google Scholar
38. Burk JA, Mair RG: Effects of dorsal and ventral striatal lesions on delayed matching trained with retractable levers. Behav Brain Res 2001; 122:67–78Google Scholar
39. Mair RG, Koch JK, Newman JB, Howard JR, Burk JA: A double dissociation within striatum between serial reaction time and radial maze delayed nonmatching performance in rats. J Neurosci 2002; 22:6756–6765Google Scholar
40. Le Couteur A, Rutter M, Lord C, Rios P, Robertson S, Holdgrafer M, McLennan J: Autism Diagnostic Interview: a standardized investigator-based instrument. J Autism Dev Disord 1989; 19:363–387Google Scholar
41. Delis D, Kramer J, Kaplan E, Ober B: The California Verbal Learning Test. San Antonio, Tex, Psychological Corp, 1987Google Scholar
42. Hazlett E, Buchsbaum M, Mohs R, Spiegel-Cohen J, Wei T-C, Azueta R, Haznedar M, Singer M, Shihabuddin L, Luu-Hisa C: Age-related shift in brain region allocation during successful memory performance. Neurobiol Aging 1998; 19:437–445Google Scholar
43. Matsui T, Hirano A: An Atlas of the Human Brain for Computerized Tomography. Tokyo, Igaku-Shoin, 1978Google Scholar
44. Kemether EM, Buchsbaum MS, Byne W, Hazlett EA, Haznedar M, Brickman AM, Platholi J, Bloom R: Magnetic resonance imaging of mediodorsal, pulvinar, and centromedian nuclei of the thalamus in patients with schizophrenia. Arch Gen Psychiatry 2003; 60:983–991Google Scholar
45. Buchsbaum MS, Shihabuddin L, Brickman AM, Miozzo R, Prikryl R, Shaw R, Davis K: Caudate and putamen volumes in good and poor outcome patients with schizophrenia. Schizophr Res 2003; 64:53–62Google Scholar
46. Piven J, Arndt S, Bailey J, Havercamp S, Andreasen NC, Palmer P: An MRI study of brain size in autism. Am J Psychiatry 1995; 152:1145–1149Google Scholar
47. Ho KC, Roessmann U, Straumfjord JV, Monroe G: Analysis of brain weight, II: adult brain weight in relation to body height, weight, and surface area. Arch Pathol Lab Med 1980; 104:640–645Google Scholar
48. Bartels P, Subach J: Significance probability mappings and automated interpretation of complex pictorial scenes, in Digital Processing of Biomedical Imagery. Edited by Preston E, Onoe M. New York, Academic Press, 1976, pp 101–114Google Scholar
49. Brambilla P, Hardan A, di Nemi SU, Perez J, Soares JC, Barale F: Brain anatomy and development in autism: review of structural MRI studies. Brain Res Bull 2003; 61:557–569Google Scholar
50. Courchesne E, Muller RA, Saitoh O: Brain weight in autism: normal in the majority of cases, megalencephalic in rare cases. Neurology 1999; 52:1057–1059Google Scholar
51. Courchesne E, Carper R, Akshoomoff N: Evidence of brain overgrowth in the first year of life in autism. JAMA 2003; 290:337–344Google Scholar
52. Aylward EH, Minshew NJ, Field K, Sparks BF, Singh N: Effects of age on brain volume and head circumference in autism. Neurology 2002; 59:175–183Google Scholar
53. Courchesne E, Karns CM, Davis HR, Ziccardi R, Carper RA, Tigue ZD, Chisum HJ, Moses P, Pierce K, Lord C, Lincoln AJ, Pizzo S, Schreibman L, Haas RH, Akshoomoff NA, Courchesne RY: Unusual brain growth patterns in early life in patients with autistic disorder: an MRI study. Neurology 2001; 57:245–254Google Scholar
54. Carper RA, Moses P, Tigue ZD, Courchesne E: Cerebral lobes in autism: early hyperplasia and abnormal age effects. Neuroimage 2002; 16:1038–1051Google Scholar
55. Hollander E, Anagnostou E, Chaplin W, Esposito K, Haznedar MM, Licalzi E, Wasserman S, Soorya L, Buchsbaum M: Striatal volume on magnetic resonance imaging and repetitive behaviors in autism. Biol Psychiatry 2005; 58:226–232Google Scholar
56. Hakala M, Karlsson H, Kurki T, Aalto S, Koponen S, Vahlberg T, Niemi PM: Volumes of the caudate nuclei in women with somatization disorder and healthy women. Psychiatry Res 2004; 131:71–78Google Scholar
57. Grossman M, Smith EE, Koenig P, Glosser G, DeVita C, Moore P, McMillan C: The neural basis for categorization in semantic memory. Neuroimage 2002; 17:1549–1561Google Scholar
58. Doris A, Belton E, Ebmeier KP, Glabus MF, Marshall I: Reduction of cingulate gray matter density in poor outcome bipolar illness. Psychiatry Res 2004; 130:153–159Google Scholar
59. Ridley RM, Baker HF, Mills DA, Green ME, Cummings RM: Topographical memory impairments after unilateral lesions of the anterior thalamus and contralateral inferotemporal cortex. Neuropsychologia 2004; 42:1178–1191Google Scholar
60. Mandzia JL, Black SE, McAndrews MP, Grady C, Graham S: fMRI differences in encoding and retrieval of pictures due to encoding strategy in the elderly. Hum Brain Mapp 2004; 21:1–14Google Scholar
61. Hazlett EA, Buchsbaum MS, Hsieh P, Haznedar MM, Platholi J, LiCalzi EM, Cartwright C, Hollander E: Regional glucose metabolism within cortical Brodmann areas in healthy individuals and autistic patients. Neuropsychobiology 2004; 49:115–125Google Scholar
62. Muller RA, Chugani DC, Behen ME, Rothermel RD, Muzik O, Chakraborty PK, Chugani HT: Impairment of dentato-thalamo-cortical pathway in autistic men: language activation data from positron emission tomography. Neurosci Lett 1998; 245:1–4Google Scholar
63. Hendler T, Goshen E, Tzila Zwas S, Sasson Y, Gal G, Zohar J: Brain reactivity to specific symptom provocation indicates prospective therapeutic outcome in OCD. Psychiatry Res 2003; 124:87–103Google Scholar
64. Micallef J, Blin O: Neurobiology and clinical pharmacology of obsessive-compulsive disorder. Clin Neuropharmacol 2001; 24:191–207Google Scholar
65. Chugani HT, Behen ME, Muzik O, Juhasz C, Nagy F, Chugani DC: Local brain functional activity following early deprivation: a study of postinstitutionalized Romanian orphans. Neuroimage 2001; 14:1290–1301Google Scholar
66. Talairach J, Tournoux P: Co-Planar Stereotaxic Atlas of the Human Brain: Three-Dimensional Proportional System. Stuttgart, Germany, Georg Thieme, 1988Google Scholar
67. Hardan AY, Minshew NJ, Mallikarjuhn M, Keshavan MS: Brain volume in autism. J Child Neurol 2001; 16:421–424Google Scholar