Regional Brain Activity in Women Grieving a Romantic Relationship Breakup
Abstract
OBJECTIVE: Separation from loved ones commonly leads to grief reactions. In some individuals, grief can evolve into a major depressive episode. The brain regions involved in grief have not been specifically studied. The authors studied brain activity in women actively grieving a recent romantic relationship breakup. It was hypothesized that while remembering their ex-partner, subjects would have altered brain activity in regions identified in sadness imaging studies: the cerebellum, anterior temporal cortex, insula, anterior cingulate, and prefrontal cortex. METHOD: Nine right-handed women whose romantic relationship ended within the preceding 4 months were studied. Subjects were scanned using blood-oxygen-level-dependent functional magnetic resonance imaging while they alternated between recalling a sad, ruminative thought about their loved one (grief state) and a neutral thought about a different person they knew an equally long time. RESULTS: Acute grief (grief minus neutral state) was associated with increased group activity in posterior brain regions, including the cerebellum, posterior brainstem, and posterior temporoparietal and occipital brain regions. Decreased activity was more prominent anteriorly and on the left and included the anterior brainstem, thalamus, striatum, temporal cortex, insula, and dorsal and ventral anterior cingulate/prefrontal cortex. When a more lenient statistical threshold for regions of interest was used, additional increases were found in the lateral temporal cortex, supragenual anterior cingulate/medial prefrontal cortex, and right inferomedial dorsolateral prefrontal cortex, all of which were adjacent to spatially more prominent decreases. In nearly all brain regions showing brain activity decreases with acute grief, activity decreases were greater in women reporting higher grief levels over the past 2 weeks. CONCLUSIONS: During acute grief, subjects showed brain activity changes in the cerebellum, anterior temporal cortex, insula, anterior cingulate, and prefrontal cortex, consistent with the hypothesis. Subjects with greater baseline grief showed greater decreases in all these regions except for the cerebellum. Further imaging studies are needed to understand the relationship between normal sadness, grief, and depression.
The relationship between normal sadness, grief, and clinical depression is complex. Although one might expect some shared neurocircuitry, these three states are distinct both in intensity and quality of emotional experience. Normal sadness is a triggered, self-limited emotional condition. Grief triggered by a loss or separation from a loved one is generally more prolonged and frequently involves depressive-type symptoms lasting from days to several months. With grief, many people experience depressive-type symptoms and then recover. However, grief is a major risk factor for clinical depression, so some unresolved grief episodes spiral into a true clinical depression (1–3). Whether grief is purely a precursor of depression or has a different quality needs further research. Of interest is that DSM-IV differentiates between depressive symptoms related to bereavement (V62.82) and major depressive disorder (296.xx), most prominently in the duration of post-loss symptoms needed to meet major depression criteria.
In the brain, depression may result from a malfunctioning in the normal circuitry for handling sadness, separation, and grief. Using [15O]H2O positron emission tomography (PET), several researchers have attempted to image brain correlates of sadness—both in healthy and pathological states—using an autobiographical event to induce the sadness (4–13). No researchers have explicitly addressed grief as the cause of sadness. Typically, before the scanning day, subjects provide details about the saddest event in their lives and an emotionally neutral event as a control condition. During scanning, subjects imagine these sad and neutral events, often with the aid of prepared scripts of the events to induce the mood. It is not surprising that most subjects, but not all, chose an episode of the loss of a loved one for the sad event (4, 7, 8, 10). Unfortunately, all of these studies suffer from the “as if” nature of the sadness. Namely, the sad event typically occurred years before the study, and although subjects commonly reported feeling sad during the scans, they used remote memories to induce the sad state.
In order to improve on these earlier studies and to examine the brain regions involved in grief while subjects were actually grieving, we imaged women who were currently grieving the loss of a romantic relationship and who were reporting that they were having trouble getting it out of their minds (i.e., “ruminating”). We picked ruminating subjects because a ruminative way of coping with loss is a known risk factor for major depression (14, 15). We selected women because there may be gender differences in the brain correlates of sadness (16). Also, women generally have higher levels of chronic strain and rumination with breakups than men do (17). In our study, we compared regional brain activity while women were thinking sad thoughts about their romantic relationship breakup as they would at home versus thinking a neutral thought about a different person known for an equally long time. We hypothesized that when comparing these two conditions, subjects would have altered brain activity in regions identified in earlier sadness imaging studies, including the cerebellum, anterior temporal cortex, insula, anterior cingulate, medial prefrontal cortex, orbitofrontal cortex, and dorsolateral prefrontal cortex (7, 8, 12, 18–20).
Method
Baseline Assessment
Eleven right-handed women were recruited by advertisement at the Medical University of South Carolina. Subjects were initially phone-screened. Eligible subjects came to the Medical University of South Carolina for a baseline assessment. Subjects had to be aged 18–40, premenopausal, right-handed (≥9 on the Annett handedness scale) (21), and physically and neurologically healthy. Subjects had to have beeen in a romantic relationship that lasted at least 6 months and did not involve physical or sexual abuse. Subjects had been separated from their romantic partner within the preceding 16 weeks and were experiencing problems recovering from the relationship (i.e., problems getting their ex-lover out of their mind, still feeling sad about the breakup). Subjects were excluded if they were in the midst of a major depressive, dysthymic, or panic disorder episode that started before the relationship failing. They were also excluded if they had current substance abuse/dependence or any history of psychosis, bipolar affective disorder, obsessive-compulsive disorder, autism, anorexia nervosa, bulimia, posttraumatic stress disorder, mental retardation, or a suicide attempt. Subjects were further excluded if they had taken any psychotropic medication within 5 half lives of procedure time, were lactating or pregnant, or had magnetic resonance imaging (MRI) contraindications.
The Medical University of South Carolina Institutional Review Board approved the study. Written informed consent was obtained. Subjects were assessed with the Structured Clinical Interview for DSM-IV Axis I Disorders (22) and underwent a detailed medical history and a urine pregnancy test. They also completed the Hamilton Anxiety Rating Scale (23), the 28-item Hamilton Depression Rating Scale (24), Beck Depression Inventory (25), Cloninger’s Temperament and Character Inventory (26), and a modified version of the Inventory of Complicated Grief (27). The 19-item Inventory of Complicated Grief questionnaire was originally developed to detect people undergoing bereavement and who were at risk for developing clinical depression or an enduring functional impairment (scale range=0–76, with a score ≥25 indicating complicated grief). Items consist of statements like: “I feel disbelief over what happened,” “I feel that life is empty without the person who died” or “Ever since he/she died, it is hard for me to trust people.” We modified the questionnaire so that it was more appropriate for a recent breakup. That is, we replaced phrases such as “the person who died” and “since he/she died” with “the person whom I have lost” and “since I lost the person” in the above items, respectively. Items were rated on a 5-point Likert scale from 0 (never feeling this way) to 4 (always feeling this way).
After completing scales, subjects described a sad thought about their ex-lover on which they had been ruminating and a neutral thought about a different person they knew a similar length of time.
MRI Scanning Parameters
All brain imaging was carried out at the Medical University of South Carolina on a 1.5-Tesla Picker EDGE system (Picker International, Cleveland, Ohio; now owned by Philips Medical, the Netherlands). Blood-oxygen-level-dependent (BOLD) functional MRI (fMRI) consisted of an asymmetric spin-echo echo-planar pulse sequence (TE=45 msec; TR=6000 msec; echo offset: 20 msec; field of view=30.0×30.0 cm; 128×128 matrix; in-plane resolution: 2.344×2.344 mm; through-plane resolution: 7 mm). Whole brain fMRI images were acquired every 6 seconds, where images consisted of 18 axial slices parallel to the anterior commissure-posterior commissure line. In all, 180 fMRI images (i.e., time points) were acquired over 18 minutes.
fMRI Experimental Paradigm
Immediately prior to MRI scanning, subjects completed the Positive and Negative Affect Schedule (28) measuring positive and negative emotion. Subjects were then positioned in the scanner with anti-noise headphones without additional earplugs for intercom communication with investigators. Head movement was restrained by using inflatable cushions. During the 18-minute BOLD fMRI session, subjects underwent the following 4-minute cycle, which was repeated 4.5 times: ratings and instructions for 60 seconds (rest) → neutral thought for 60 seconds → rest → sad, ruminative thought for 60 seconds. Subjects were instructed to keep their eyes closed throughout. During approximately the first 20 seconds of rest, subjects verbally told investigators their levels of sadness, anger, anxiety, and happiness over the preceding 60 seconds on a 0–10 Likert scale. At about 42 seconds into rest, subjects were instructed to think about their sad or neutral thought until the upcoming ruminative thought or neutral thought period ended. After completing the fMRI scan, subjects again completed the Positive and Negative Affect Schedule, this time rating their average emotional reactions retrospectively during the ruminative thought and neutral thought conditions. On 10-cm visual analog scales, they also rated the extent to which they felt distracted by the scanning environment (0=not at all, 10=very much), how difficult it was for them to induce the sad and neutral thoughts (0=very easy, 10=very difficult), and how well their sad ruminations in the scanner matched the corresponding state outside the scanner (0=totally different, 10=exactly the same).
Data Analysis
We performed all imaging data analysis on Sun SPARCstation workstations (Sun Microsystems Inc., Mountain View, Calif.) using MEDx 3.3/SPM 96 (Sensor Systems Inc., Sterling, Va.) (29). We statistically compared fMRI brain activity during ruminative thought versus neutral thought in each subject by using the following steps.
1) For motion correction, we used automatic image registration with a two-dimensional rigid body six-parameter model (30). After motion correction, all subjects displayed average movements of 0.10 mm (SD=0.09), 0.13 mm (SD=0.1), and 0.14 mm (SD=0.11) in x, y, and z directions, respectively. Residual movement in the x, y, and z planes corresponding to each scan were saved for use as regressors of no interest (confounders) in the statistical analyses.
2) Spatial normalization was performed to transform scans into Talairach space with output voxel dimensions that were the same as the original acquisition dimensions, namely 2.344×2.344×7 mm.
3) Spatial smoothing was done using a Gaussian kernel and full width at half maximum of 8×8×8 mm.
4) Temporal filtering was done using a Butterworth low-frequency filter that removed fMRI intensity patterns greater than 1.5 multiplied by the cycle length’s period (360 seconds).
5) Only scans that corresponded to a neutral thought or ruminative thought were kept in the remaining analysis. Removing the rest scans from the scan sequence left us with 90 scans, 50 scans corresponding to a neutral thought and 40 scans corresponding to a ruminative thought.
6) Intensity masking was performed by generating the mean intensity image for the time series and determining an intensity that clearly divided high- and low-intensity voxels, which we called inside and outside the brain, respectively.
7) For individual statistical modeling, we used the multiple regression module of MEDx and a simple boxcar function with no hemodynamic lag to model the ruminative thought versus neutral thought scan paradigm (regressor of interest) and the three motion parameters corresponding to the appropriate scans for modeling effects of no interest. No lag was used as subjects started thinking neutral and ruminative thoughts around 18 seconds prior to neutral thought and ruminative thought. A brain voxel’s parameter estimate and corresponding z score for the ruminative thought versus neutral thought regressor was then used for subsequent analysis.
8) We then made a group intensity mask by considering only voxels present in the brains of all subjects as inside the brain.
9) We generated group statistical data by using a random effects analysis and then a cluster analysis. Each subject’s parameter estimate for the ruminative thought versus neutral thought regressor was then combined by using a random effects analysis to create group z maps for ruminative thought minus neutral thought (increases) and neutral thought minus ruminative thought (decreases). On these group z maps, we then performed a cluster analysis (31) within the region encompassed by the group intensity mask using a z score height threshold of ≥1.654 and a cluster statistical weight (spatial extent threshold) of p<0.05 or, equivalently, a cluster size of 274 voxels. We additionally found local maxima on these group cluster maps. For regions of interest, we additionally looked at activations using more lenient thresholding (z≥1.654, cluster size of 10).
10) We generated group statistical data by first using Worsley’s variance smoothing technique to generate a group z map and then using a cluster analysis. With the small number of subjects in our study, a random effects analysis (which uses between-subject variances) is specific but not sensitive. However, if we performed a fixed effects analysis (which uses within-subject variances), it would be a sensitive but not very specific analysis and vulnerable to false positives potentially driven by the data of only a few subjects; this is a potentially major issue in an emotional paradigm that is likely to have a lot of variability. To see if we could gain additional sensitivity in our data set, instead of using a fixed effects analysis, we used Worsley’s variance ratio smoothing method (32, 33), which generally has a sensitivity and specificity between random and fixed effects analyses. In the variance smoothing method, random and fixed effects variances as well as spatial smoothing are used to increase sampling and create a Worsley variance with degrees of freedom between a random and fixed effects analysis. We used a smoothing kernel of 16 mm, producing a df of 61 for each voxel in the Worsley method. After generating a t map (and corresponding z map) for ruminative relative to neutral thought using the Worsley variance, we performed a cluster analysis on the z map for the ruminative relative to neutral thought comparison using the same thresholds as in the random effects analyses. Since the Worsley technique did not produce additional activations compared with the random effects analyses, only the random effects analyses results are presented.
11) We then performed a post hoc correlation of individual subject grief scores with brain activity during ruminative relative to neutral thought, followed by a cluster analysis. We first made a subjective judgment that subjects’ scores on the modified version of the Inventory of Complicated Grief more closely correlated with their clinical state than did their Hamilton depression scale scores. Considering each voxel separately, we then determined the correlation between a subject’s score on the modified version of the Inventory of Complicated Grief and her brain voxel’s z score in the ruminative thought minus neutral thought regressor from step 7. We then converted a brain voxel’s correlation value to a p value and corresponding z score. We then performed a cluster analysis on this correlational z map using our aforementioned more rigid statistical cutoff (i.e., a z score height threshold of ≥1.654 and a cluster statistical weight [spatial extent threshold] of p<0.05).
Results
Subject Demographics
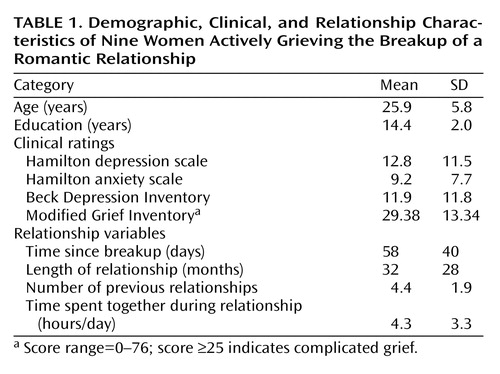
Usable fMRI data existed on nine of the 11 subjects. On both excluded subjects, the scanner malfunctioned near the end of fMRI acquisition. Table 1 lists demographic characteristics and baseline ratings for the nine included subjects. We scanned subjects at a median time of 44 days after the breakup (range=11–126). Depression ratings showed a large variation, with Hamilton depression scale and Beck Depression Inventory scores ranging from 0 to 31 and 0 to 40, respectively. All subjects reported clinical depression symptoms immediately after the breakup, with most reporting symptoms beginning to taper about 2 weeks later. At the time of study, only one subject met full major depressive episode criteria, and three had Hamilton depression scale scores >20.
Eight of the nine subjects completed a grief rating scale:a modified version of the Inventory of Complicated Grief. The mean scores of these subjects were within one standard deviation of the population on which the original Inventory of Complicated Grief was developed except for three items where our subjects displayed lower scores: “I hear the voice of the person whom I have lost speak to me,” “I see the person whom I have lost stand before me,” and “I feel guilty about having fun without the person whom I have lost.” If we used the Inventory of Complicated Grief’s suggested complicated grief cutoff score (≥25), four of our eight subjects were complicated grievers. In our subjects, we found that scores on the modified version of the Inventory of Complicated Grief tended to be positively correlated with Hamilton depression scale scores (r=0.67, df=6, p=0.073), but when the two subjects without usable fMRI data were included, a significant positive correlation emerged (r=0.68, df=8, p<0.03).
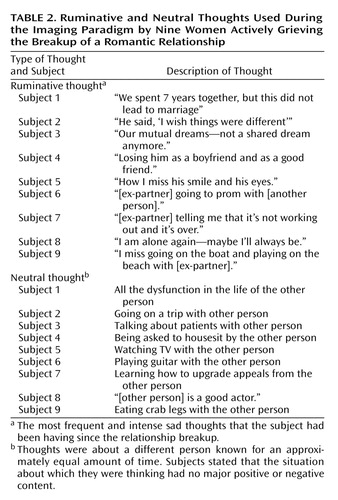
The thoughts subjects picked for the ruminative thought and neutral thought conditions are shown in Table 2. We compared subjects’ emotions (i.e., sadness, anger, happiness, anxiety) and positive and negative emotion ratings (from the Positive and Negative Affect Schedule) during ruminative thought and neutral thought conditions. To do this, for each emotion (say sadness), we used a separate non-parametric test where a subject’s median score for an emotion during ruminative thought and neutral thought conditions was first determined. The resulting scores for the nine subjects were then ranked from 1 to 18, and then the average rankings for ruminative and neutral thoughts were compared in a two-tailed paired t test at p<0.05. This test revealed significantly higher ratings for ruminative thought relative to neutral thought for sadness (mean difference=9, SD=3.43) (t=7.87, df=8, p<0.001), anger (mean difference=9, SD=3.01) (t=8.97, df=8, p<0.001), anxiety (mean difference=6.78, SD=3.17) (t=6.42, df=8, p<0.001), and negative emotion (mean difference=6, SD=3.94) (t=4.57, df=8, p<0.003). Significantly lower ratings were seen for ruminative thought relative to neutral thought for happiness (mean difference=4.44, SD=4.02) (t=3.31, df=8, p<0.01). There was no significant difference between ruminative thought and neutral thought for positive emotion (mean difference=2.38, SD=3.62) (t=1.97, df=8, p=0.11). Of note, all subjects reported experiencing more sadness during ruminative thought than neutral thought. Also, sadness ratings did not habituate during scanning.
On the 10-cm visual analog scale ratings about imaging task authenticity, subjects reported feeling moderately distracted by the scanning environment (mean=4.81, SD=3.27), finding it fairly easy to induce the ruminative and neutral thoughts (mean=2.92, SD=2.54), and feeling the ruminative thought condition in the scanner matched the corresponding state outside the scanner moderately well (mean=5.21, SD=3.09).
Brain Imaging Results
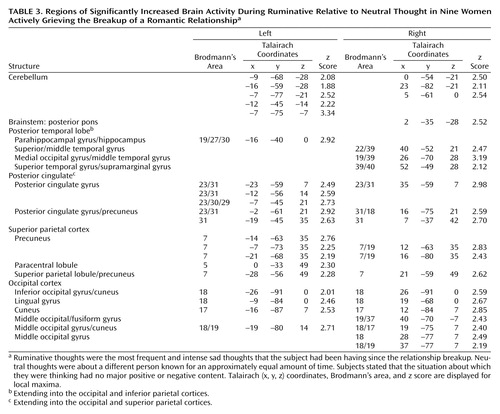
Group fMRI data are displayed in Table 3, Table 4, and Figure 1. In our main random effects group analysis, we used a height threshold of p=0.05 (one-tailed z=1.645) and cluster probability threshold of p=0.05 (cluster size ≥274 voxels). At this threshold, we found one significant posterior cluster (size=921 voxels, p=0.00001) with increased brain activity during ruminative relative to neutral thought. This cluster was located in the 1) cerebellum; 2) posterior pons; 3) posterior temporal cortex (left posterior parahippocampal gyrus/hippocampus, right fusiform gyrus, and right posterior superolateral temporal cortex); 4) posterior cingulate; 5) posterior parietal cortex (right posterior inferior parietal cortex and bilateral posterior superior parietal cortex); and 6) occipital cortex (Table 3).
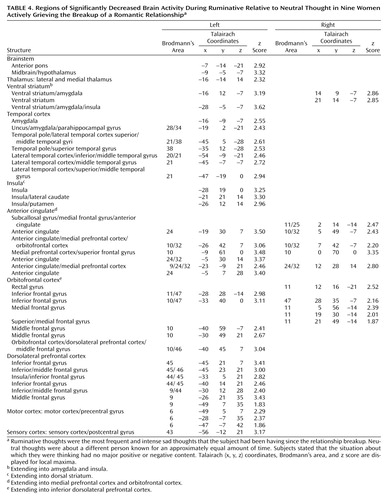
We found one significant anterior, mainly left lateralized, cluster (size=2730 voxels, p=4.51×10⁻¹³) with decreased brain activity during ruminative relative to neutral thought. This cluster was located in the 1) anterior brainstem (anterior pons and left midbrain/hypothalamus); 2) left lateral thalamus; 3) striatum (bilateral ventral striatum [ventral putamen/nucleus accumbens region] and bilateral dorsal striatum [dorsal caudate (left > right) and left putamen]); 4) medial temporal cortex mostly on the left (left medial temporal cortex with maxima in the dorsal amygdala, uncus, and parahippocampal gyrus regions) and right anterior medial temporal cortex (right anterior amygdala); 5) left lateral temporal cortex (temporal pole as well as unimodal and heteromodal regions); 6) left insula; 7) bilateral anterior cingulate/medial prefrontal cortex (subgenually in Brodmann’s area 25, 10, 32 extending into medial orbitofrontal cortex Brodmann’s area 11, pregenually in Brodmann’s area 24, 32, 9, 10, and supragenually in Brodmann’s area 24); 8) orbitofrontal cortex mostly on the left (bilateral Brodmann’s area 11, 47 and left Brodmann’s area 10); 9) left dorsolateral prefrontal cortex; and 10) left primary motor and sensory cortices (Table 4).
In hypothesized regions and regions of interest based on our more thorough post-study review of the literature in the discussion, we also looked at brain activity using a more lenient cluster size threshold (height z=1.645, cluster size=10). At this threshold, we report new brain activity increases during ruminative relative to neutral thought in the bilateral lateral temporal cortices (middle temporal gyri), supragenual anterior cingulate/medial prefrontal cortex, and right inferomedial dorsolateral prefrontal cortex (Brodmann’s area 10). Also, decreased activations during ruminative relative to neutral thought now appeared bilateral in the thalamus, insula, and dorsolateral prefrontal cortex. All the new increased activations during ruminative relative to neutral thought at this more lenient threshold were adjacent to areas of significant deactivations.
Post Hoc Correlation Analysis: Self-Reported Grief Level and Brain Activity Increases During Ruminative Relative to Neutral Thought
No clusters showed a statistically significant positive correlation between a subject’s baseline score on the modified version of the Inventory of Complicated Grief and brain activity during ruminative relative to neutral thought. There were, however, statistically significant clusters showing a negative correlation between a subject’s grief inventory score and brain activity during ruminative relative to neutral thought. These regions of negative correlation were all in surprisingly similar locations to the areas of deactivation for ruminative relative to neutral thought from the group random effects analysis. The only exceptions were that orbitofrontal cortex and ventral anterior cingulate/medial prefrontal cortex negative correlations were limited to small portions of the subgenual anterior cingulate and right anterolateral orbitofrontal cortex, respectively. Thus, for most brain regions in which there were brain activity decreases for ruminative relative to neutral thought, the higher the baseline grief score, the lower the brain activity. Figure 2 shows the negative correlation between the grief inventory score and brain activity at a local maxima in the left amygdala. This voxel was chosen because the finding of decreasing activity during ruminative relative to neutral thought with increasing grief scores runs counter to amygdala hyperactivity findings in depression. It was the only voxel we looked at for plotting.
We also inspected correlations between a subject’s average self-reported sadness rating and brain activity during ruminative relative to neutral thought. Unlike the grief versus brain activity correlation analysis, positive correlations existed in the left inferior and superior posterior parietal cortex, regions that were active in random effects analysis of ruminative relative to neutral thought.
Like the grief versus brain activity correlation analysis, negative correlations were again found in regions that were surprisingly similar to the random effects deactivations for ruminative relative to neutral thought, except anterior cingulate/medial prefrontal cortex and dorsolateral prefrontal cortex negative correlations were limited to the supragenual and ventrolateral (Brodmann’s area 44/45/46) regions, respectively. Unlike the grief versus brain activity correlations, there was a spatially extensive negative correlation between activity and sadness ratings during scanning in the left orbitofrontal cortex. Also, there were negative correlations in the cerebellum, a region that was active during ruminative relative to neutral thought.
The similarity in correlations between the grief versus brain activity and sadness versus brain activity findings cannot be explained by a correlation between the Inventory of Complicated Grief scores and average sadness during ruminative relative to neutral thought (r=0.024, df=7, p=0.48; z=0.05).
Discussion
This work, involving grief caused by a recent separation, adds to the growing body of information about the brain regions involved in sadness. Of importance is that this study lays the groundwork for future brain imaging studies examining the relationship between transient sadness, grief, and clinical depression. Our study specifically examined women grieving a breakup with a romantic lover. Almost all subjects would have met the criteria for depression for a period less than 2 weeks after breakup. Most, however, did not meet the 2-week depression time criteria. At study time, subjects generally were still ruminating about their ex-lover, but most had resolving depressive symptoms. Only one subject met criteria for a major depressive episode at study time.
The spectrum from acute sadness to grief to major depression probably involves dysfunction of several interrelated functional neuroanatomical systems. In depression, one simplistic way of mapping brain regions and symptoms is that 1) hypothalamus involvement maps onto sleep, appetite, and neuroendocrine regulatory problems, 2) ventral striatum hypofunction maps onto anhedonia, 3) the interface of motor systems with the dorsal striatum or thalamus maps onto slowed motor manifestations, 4) amygdala hyperactivity maps onto comorbid anxiety and misperception of danger signals, 5) disordered paralimbic activity (orbitofrontal cortex-insula-temporal pole-anterior cingulate) maps onto affective symptoms, and 6) anterior cingulate/prefrontal cortex hypofunction maps onto cognitive deficits (34).
In our study, we found as hypothesized that in premenopausal women who had recently experienced the breakup of a romantic relationship, ruminating about their ex-lover was associated with altered activity in the cerebellum, anterior temporal cortex, insula, anterior cingulate, and prefrontal cortex. Brain activity increases during ruminative relative to neutral thought were generally more prominent in posterior brain regions, including the cerebellum, occipital, and posterior parietal-temporal cortices. Decreases were more prominent on the left and in anterior brain regions, including the anterior brainstem and striatal, thalamic, limbic, temporal, and prefrontal cortices. Specifically, we found brain activity increases during ruminative relative to neutral thought in the cerebellum, posterior brainstem, bilateral lateral temporal cortices, supragenual anterior cingulate/medial prefrontal cortex, right inferomedial dorsolateral prefrontal cortex, and posterior temporoparietal and occipital brain regions. The more anterior region increases—including the lateral temporal cortex, anterior cingulate, and prefrontal cortex—were only present with a more lenient statistical threshold, and all lied adjacent to regions of brain activity decreases during ruminative relative to neutral thought. Activity decreases during ruminative relative to neutral thought were generally more on the left than the right and included the anterior brainstem, thalamus, striatum, medial and lateral temporal cortex, insula, anterior cingulate/medial prefrontal cortex (sub-, pre-, and supragenual regions), orbitofrontal cortex, dorsolateral prefrontal cortex, and primary sensorimotor cortex. In post hoc correlations, we found negative correlations between a subject’s baseline grief ratings and activations during ruminative relative to neutral thought in brain regions similar to where the group showed decreased activation during ruminative relative to neutral thought, except that the orbitofrontal cortex and ventral anterior cingulate/medial prefrontal cortex negative correlations were limited to small portions of the subgenual anterior cingulate and right anterolateral orbitofrontal cortex, respectively.
Relationship With Prior Imaging Studies of Sadness and Depression
There have been seven independent samples of healthy individuals studied while they recalled sad memories as compared with neutral memories or rest (4, 7, 8, 10, 12, 16, 20, 35). All seven examined increases during sadness relative to a control condition, and four also examined decreases. Unlike our study, these were all [15O]H2O PET studies, and the sad event picked was generally not an event about which the subjects were actively grieving. In general, these sadness induction studies showed increased subcortical activity, increased or altered paralimbic region activity, and decreased activity in more cortical regions. Namely, consistent findings in healthy individuals undergoing sadness induction included cerebellar increases, brainstem/hypothalamus increases, thalamic increases, striatal increases, insular increases, changed ventrolateral orbitofrontal cortex activity, mostly ventromedial anterior cingulate/medial prefrontal cortex/orbitofrontal cortex increases, changed pregenual anterior cingulate/medial prefrontal cortex activity, changed posterior cingulate activity, mainly dorsolateral prefrontal cortex decreases, lateral temporal cortex decreases, and changed occipital cortex activity.
In our study of actively grieving subjects, we found altered activity in all these brain regions. Consistent with the healthy sadness studies, we found increases in the cerebellum and posterior brainstem, changes in the pregenual and supragenual anterior cingulate/medial prefrontal cortex (increases and decreases supragenually and decreases pregenually), changes (increases) in the posterior cingulate cortex, changes (decreases) in the orbitofrontal cortex, mainly decreases in the dorsolateral prefrontal cortex (extensive decreases on the left but both increases and decreases in a small area of the right inferomedial dorsolateral prefrontal cortex), mainly decreases in the lateral temporal cortex, and changes (increases) in the occipital cortex. In contrast to these studies, we found decreased activity in the anterior brainstem/hypothalamus, thalamus, striatum, anterior lateral paralimbic structures (insula-temporal pole-orbitofrontal cortex), and subgenual/ventral pregenual anterior cingulate/medial prefrontal cortex/medial orbitofrontal cortex. Of interest, we also found decreases in the bilateral medial temporal cortex (left > right) not noted in the sadness studies as a consistent region of change.
While at odds with sadness studies in healthy subjects, our findings of diminished brain activity during ruminative relative to neutral thought in the striatum and anterior cingulate/prefrontal cortex as well as our findings in these regions of decreasing activity during ruminative relative to neutral thought with increasing baseline grief levels are consistent with functional imaging studies of depression, which consistently report mainly decreased anterior cingulate/medial prefrontal cortex activity and decreased dorsolateral prefrontal cortex activity as well as less consistent findings of striatal decreases (6, 34, 36–39). Our findings, however, are the opposite of consistent depression findings of amygdala, insula, and ventrolateral orbitofrontal cortex increases and less consistent depression findings of thalamic increases (34, 36–40). Findings of lateral temporal cortex decreases were consistent with healthy sadness studies and some depression studies. In a single [15O]H2O PET study of acutely depressed subjects reflecting on sad memories compared with rest (41), which employed a paradigm similar to our own, the authors also found within-group thalamic decreases as we did but insula and ventrolateral orbitofrontal cortex increases similar to the depression and some healthy sadness induction studies. This sole sadness induction study of depression subjects did not report direct statistical comparisons between depressed and healthy subjects.
In sum, we found activity increases during ruminative relative to neutral thought in the cerebellum, posterior brainstem, lateral temporal cortices, supragenual anterior cingulate/medial prefrontal cortex, right inferomedial dorsolateral prefrontal cortex, and posterior temporal-parietal and occipital brain regions. The more anterior region increases—including the lateral temporal cortices, anterior cingulate, and prefrontal cortex—were all surrounded by regions of more prominent decreases. Activity decreases during ruminative relative to neutral thought were more extensive on the left and located in the anterior brainstem, thalamus, striatum, medial and lateral temporal cortex, insula, anterior cingulate, and frontal cortex. All of these brain regions have been found to be altered in sadness induction studies in healthy individuals. With the exception of the cerebellum and occipital and parietal cortices, all of the regions have also been found to be altered with at least some consistency in depression.
Our most robust finding was of prominent activity decreases during ruminative relative to neutral thought in the subcortex, medial and lateral temporal cortices, insula, anterior cingulate, and frontal cortex. These regions of group decreases also showed diminishing activity during ruminative relative to neutral thought with increasing level of a person’s grief, except for limited findings in the ventral anterior cingulate/prefrontal cortex. Our findings of changed (primarily diminished) anterior cingulate, frontal, and lateral temporal activity in our grieving subjects are consistent with findings in healthy subjects undergoing sadness induction and depression subjects in general. Our finding of decreased insula activity is at odds with consistent findings in healthy sadness induction studies and depression. Our finding of decreased medial temporal cortex (limbic) activity (including the amygdala) is at odds with consistent depression findings and is not a consistent finding in healthy sadness induction studies. Potential reasons for our discrepant findings of medial temporal lobe decreases are as follows. First, our study was not one of pure sadness, instead involving a mixed state of sadness, anger, and anxiety. Also, decreases in the medial temporal region in our actively grieving subjects could be specific to the experience of actively thinking about a negative experience that is on one’s mind constantly, which is different from grief remembered from long ago. Next, perhaps subjects with higher grieving scores have hyperactive amygdala activity during the neutral baseline condition and with further increases in emotion such as ruminating about a lost relationship, they actually get decreases in amygdala activity. A justification for this is that mild to moderate doses of noradrenaline, which increase stress, placed in the amygdala improves fear conditioning in rats, but high doses do not (42). This may be analogous to the finding that low to moderate stress increases cerebral blood flow (cortically and sometimes subcortically) and performance, whereas high stress levels decrease cerebral blood flow (cortically and sometimes subcortically) and performance (43–53). Further, amygdala and medial temporal lobe activity is often noted to be altered rather than increased in anxiety disorders such as panic disorder and post-traumatic stress disorder (PTSD) (J.P. Lorberbaum, unpublished literature review). For example, diminished medial temporal lobe activity has been noted in PTSD subjects internally reflecting on their traumatic event (54). Next, in some fMRI studies, amygdala activity has been noted to initially briefly increase for roughly 10–15 seconds then decrease below baseline over the course of a single epoch. Amygdala activity has even shown increases in earlier epochs but habituation to below baseline in later ones (55). Our epochs were 60 seconds and repeated 4.5 times. Last, our sadness induction involved internally generated emotions with eyes closed. With visually (externally) induced sadness, medial temporal lobe activation is common, especially in the amygdala. The phenomenon of predominant amygdala activation by visual mood induction was already statistically substantiated by the meta-analysis of Phan and colleagues (56). In 50% of the visual induction studies they had reviewed, the amygdala turned out to have increased activity, regardless of the targeted mood. However, in only 7% of internally recall-driven studies were amygdala increases found.
Limitations
Our study had several limitations that should be kept in mind while interpreting its results. 1) Variability: potential causes of variability include the small sample size, varying range of time from breakup, lack of control for menstrual phase, and inattention to cigarette smoking as well as the wide inter-subject differences in distraction, ease of performing the sadness task, and stage of grief. 2) Reversibility of emotion: during fMRI, subjects may not have been able to completely recover from their sad, ruminative state in time for the neutral state. Even though subjects rated themselves less sad during the neutral condition, this may have been true in part due to a response bias, since conditions were categorized as “sad” and “neutral.” 3) Mixed emotions, not pure sadness: during ruminative thought, subjects felt significantly more sad, anxious, and angry than during neutral thought, albeit at a lesser level for the latter two emotions. Thus, the induced emotion was not pure sadness. However, we were more interested in the neural correlates of grief itself than in pure sadness. Grieving about a breakup might therefore be considered to be a mixed emotional state, which may limit comparability with studies examining sadness. 4) Quality of the control task: we tried to match neutral and sad thoughts for the mental techniques used to produce these emotions (i.e., mental imagery and imagining of spoken words) and familiarity of the person in the neutral event. However, one might assume that, compared with the neutral thought state, the ruminative thought content was more important, familiar, and more frequently thought about. Therefore, the occipital activation during sadness might be explainable as a stronger activation of primary and secondary visual areas from more vivid imagery.
Conclusions
In conclusion, we have demonstrated that hypothesized brain regions are altered in women when grieving the recent breakup of a romantic relationship during scanning. The regions activated in these women were largely the same regions activated in prior sadness mood induction studies, although there were some interesting differences in the direction of changes that may have been due to the technique involved or because the subjects were actively grieving. These pilot results lay the groundwork for future studies examining the relationship between normal sadness, grief, and depression.
 |
 |
 |
 |
Presented in part at the 57th meeting of the Society of Biological Psychiatry, Philadelphia, May 16–18, 2002. Received Sept. 5, 2002; revisions received Sept. 9, 2003, and Jan. 12, 2004; accepted Jan. 29, 2004. From the Psychiatry Department and the Center for Advanced Imaging Research at the Medical University of South Carolina; the University of Tübingen Medical Center, Tübingen, Germany; and the Mental Health Service, Ralph H. Johnson VA Medical Center, Charleston, S.C. Address correspondence and reprint requests to Dr. Najib, Krokusweg 21, 72622 Nürtingen, Germany ( [email protected] [e-mail]); or Dr. Lorberbaum, Department of Psychiatry, Medical University of South Carolina, Charleston, SC 29425 ([email protected] [e-mail]). Drs. Najib and Lorberbaum contributed equally to this work. Supported in part by the Biomedical Sciences Exchange Program between North America and Europe and a development grant from the Medical University of South Carolina Center for Advanced Imaging Research. The authors thank Ziad Nahas for assistance with magnetic resonance imaging scanning and Carol Hanback for administrative support.

Figure 1. Brain Region Activity in Nine Women Actively Grieving the Breakup of a Romantic Relationship During Ruminative Relative to Neutral Thoughta
aRuminative thoughts were the most frequent and intense sad thoughts that the subject had been having since the relationship breakup. Neutral thoughts were about a different person known for an approximately equal amount of time. Subjects stated that the situation about which they were thinking had no major positive or negative content. Regions more active during ruminative relative to neutral thought are shown in a red flare pattern. Areas more active during neutral relative to ruminative thought are shown in a blue flare pattern. Horizontal brain slices are 8-mm thick. The Talairach space z level is indicated above the corresponding slice. Horizontal slices are shown from the bottom of the brain (Talairach z level=−) to the top (z level=+).

Figure 2. Relationship Between Brain Activity Differences for Ruminative Relative to Neutral Thought and Baseline Grief Inventory Score at a Voxel in the Left Amygdalaa
aTalairach coordinates are x=–19, y=–7, and z=–14 for the voxel in the left amygdala. The plot shows the linear decrease in brain activity for ruminative relative to neutral thought with a subject’s baseline grief inventory score (r=0.93, df=7, p=0.0003; z=3.48). Brain activity was measured by a subject’s ruminative thought minus the neutral thought z score.
1. Biondi M, Picardi A: Clinical and biological aspects of bereavement and loss-induced depression: a reappraisal. Psychother Psychosom 1996; 65:229–245Crossref, Medline, Google Scholar
2. Aseltine RH Jr, Kessler RC: Marital disruption and depression in a community sample. J Health Soc Behav 1993; 34:237–251Crossref, Medline, Google Scholar
3. Eaton WW, Dryman A, Weissman MM: Panic and phobia: the diagnosis of panic disorder and phobic disorder, in Psychiatric Disorders in America: The Epidemiologic Catchment Area Study. Edited by Robins LN, Regier DA. New York, Free Press, 1991, pp 155–179Google Scholar
4. Damasio AR, Grabowski TJ, Bechara A, Damasio H, Ponto LL, Parvizi J, Hichwa RD: Subcortical and cortical brain activity during the feeling of self-generated emotions. Nat Neurosci 2000; 3:1049–1056Crossref, Medline, Google Scholar
5. Davidson RJ, Irwin W: The functional neuroanatomy of emotion and affective style. Trends Cogn Sci 1999; 3:11–21Crossref, Medline, Google Scholar
6. Drevets WC: Neuroimaging studies of mood disorders. Biol Psychiatry 2000; 48:813–829Crossref, Medline, Google Scholar
7. George MS, Ketter TA, Parekh PI, Horwitz B, Herscovitch P, Post RM: Brain activity during transient sadness and happiness in healthy women. Am J Psychiatry 1995; 152:341–351Link, Google Scholar
8. Lane RD, Reiman EM, Ahern GL, Schwartz GE, Davidson RJ: Neuroanatomical correlates of happiness, sadness, and disgust. Am J Psychiatry 1997; 154:926–933Link, Google Scholar
9. LeDoux J: Fear and the brain: where have we been, and where are we going? Biol Psychiatry 1998; 44:1229–1238Crossref, Medline, Google Scholar
10. Liotti M, Mayberg HS, Brannan SK, McGinnis S, Jerabek P, Fox PT: Differential limbic—cortical correlates of sadness and anxiety in healthy subjects: implications for affective disorders. Biol Psychiatry 2000; 48:30–42Crossref, Medline, Google Scholar
11. Morris JS, Friston KJ, Buchel C, Frith CD, Young AW, Calder AJ, Dolan RJ: A neuromodulatory role for the human amygdala in processing emotional facial expressions. Brain 1998; 121(part 1):47–57Google Scholar
12. Pardo JV, Pardo PJ, Raichle ME: Neural correlates of self-induced dysphoria. Am J Psychiatry 1993; 150:713–719Link, Google Scholar
13. Reiman EM, Lane RD, Ahern GL, Schwartz GE, Davidson RJ, Friston KJ, Yun L-S, Chen K: Neuroanatomical correlates of externally and internally generated human emotion. Am J Psychiatry 1997; 154:918–925Link, Google Scholar
14. Nolen-Hoeksema S: The role of rumination in depressive disorders and mixed anxiety/depressive symptoms. J Abnorm Psychol 2000; 109:504–511Crossref, Medline, Google Scholar
15. Kuehner C, Weber I: Responses to depression in unipolar depressed patients: an investigation of Nolen-Hoeksema’s response styles theory. Psychol Med 1999; 29:1323–1333Crossref, Medline, Google Scholar
16. George MS, Ketter TA, Parekh PI, Herscovitch P, Post RM: Gender differences in regional cerebral blood flow during transient self-induced sadness or happiness. Biol Psychiatry 1996; 40:859–871Crossref, Medline, Google Scholar
17. Nolen-Hoeksema S, Larson J, Grayson C: Explaining the gender difference in depressive symptoms. J Pers Soc Psychol 1999; 77:1061–1072Crossref, Medline, Google Scholar
18. Beauregard M, Leroux JM, Bergman S, Arzoumanian Y, Beaudoin G, Bourgouin P, Stip E: The functional neuroanatomy of major depression: an fMRI study using an emotional activation paradigm. Neuroreport 1998; 9:3253–3258Crossref, Medline, Google Scholar
19. Drevets WC, Price JL, Simpson JR Jr, Todd RD, Reich T, Vannier M, Raichle ME: Subgenual prefrontal cortex abnormalities in mood disorders. Nature 1997; 386:824–827Crossref, Medline, Google Scholar
20. Mayberg HS, Liotti M, Brannan SK, McGinnis S, Mahurin RK, Jerabek PA, Silva JA, Tekell JL, Martin CC, Lancaster JL, Fox PT: Reciprocal limbic-cortical function and negative mood: converging PET findings in depression and normal sadness. Am J Psychiatry 1999; 156:675–682Abstract, Google Scholar
21. Annett M: The binomial distribution of right, mixed and left handedness. Q J Exp Psychol 1967; 19:327–333Crossref, Medline, Google Scholar
22. First MB, Spitzer RL, Gibbon M, Williams JBW: Structured Clinical Interview for DSM-IV Axis I Disorders (SCID). New York, New York State Psychiatric Institute, Biometrics Research, 1998Google Scholar
23. Hamilton M: The assessment of anxiety states by rating. Br J Med Psychol 1959; 32:50–55Crossref, Medline, Google Scholar
24. Hamilton M: A rating scale for depression. J Neurol Neurosurg Psychiatry 1960; 23:56–62Crossref, Medline, Google Scholar
25. Beck AT, Ward CH, Mendelson M, Mock J, Erbaugh J: An inventory for measuring depression. Arch Gen Psychiatry 1961; 4:561–571Crossref, Medline, Google Scholar
26. Cloninger CR, Svrakic DM, Przybeck TR: A psychobiological model of temperament and character. Arch Gen Psychiatry 1993; 50:975–990Crossref, Medline, Google Scholar
27. Prigerson HG, Maciejewski PK, Reynolds CF III, Bierhals AJ, Newsom JT, Fasiczka A, Frank E, Doman J, Miller M: The Inventory of Complicated Grief: a scale to measure certain maladaptive symptoms of loss. Psychiatry Res 1995; 59:65–79Crossref, Medline, Google Scholar
28. Watson D, Clark LA, Tellegen A: Development and validation of brief measures of positive and negative affect: the PANAS scales. J Pers Soc Psychol 1988; 54:1063–1070Crossref, Medline, Google Scholar
29. Frackowiak RSJ, Friston CJ, Frith CD, Dolan R, Mazziotta JC (eds): Human Brain Function. San Diego, Academic Press, 1997Google Scholar
30. Woods RP, Cherry SR, Mazziotta JC: Rapid automated algorithm for aligning and reslicing PET images. J Comput Assist Tomogr 1992; 16:620–633Crossref, Medline, Google Scholar
31. Friston KJ, Worsley KJ, Frackowiak RS, Mazziotta JC, Evans AC: Assessing the significance of focal activations using their spatial extent. Hum Brain Mapp 1994; 1:214–220Google Scholar
32. Didier GL, Smith S: Comparing Groups of Subjects in fMRI Studies: A Review of the GLM Approach: TR00DL1. Oxford, UK, Centre for Functional Magnetic Resonance Imaging of the Brain, 2001Google Scholar
33. Worsley KJ, Liao CH, Aston J, Petre V, Duncan GH, Morales F, Evans AC: A general statistical analysis for fMRI data. Neuroimage 2002; 15:1–15Crossref, Medline, Google Scholar
34. Kose S, George MS: Functional magnetic resonance imaging investigations in mood disorders, in Brain Imaging in Affective Disorders. Edited by Soares JC. New York, Marcel Dekker, 2003, pp 119–157Google Scholar
35. Gemar MC, Kapur S, Segal ZV, Brown GM, Houle S: Effects of self-generated sad mood on regional cerebral activity: a PET study in normal subjects. Depression 1996; 4:81–88Crossref, Medline, Google Scholar
36. Anand A, Shekhar A: Brain imaging studies in mood and anxiety disorders: special emphasis on the amygdala. Ann NY Acad Sci 2003; 985:370–388Crossref, Medline, Google Scholar
37. Brody AL, Barsom MW, Bota RG, Saxena S: Prefrontal-subcortical and limbic circuit mediation of major depressive disorder. Semin Clin Neuropsychiatry 2001; 6:102–112Crossref, Medline, Google Scholar
38. Drevets WC: Functional neuroimaging studies of depression: the anatomy of melancholia. Annu Rev Med 1998; 49:341–361Crossref, Medline, Google Scholar
39. Drevets WC: Neuroimaging and neuropathological studies of depression: implications for the cognitive-emotional features of mood disorders. Curr Opin Neurobiol 2001; 11:240–249Crossref, Medline, Google Scholar
40. Drevets WC: Functional anatomical abnormalities in limbic and prefrontal cortical structures in major depression. Prog Brain Res 2000; 126:413–431Crossref, Medline, Google Scholar
41. Liotti M, Mayberg HS, McGinnis S, Brannan SL, Jerabek P: Unmasking disease-specific cerebral blood flow abnormalities: mood challenge in patients with remitted unipolar depression. Am J Psychiatry 2002; 159:1830–1840Link, Google Scholar
42. Liang KC, Juler RG, McGaugh JL: Modulating effects of posttraining epinephrine on memory: involvement of the amygdala noradrenergic system. Brain Res 1986; 368:125–133Crossref, Medline, Google Scholar
43. Yerkes RM, Dodson JD: The relation of strength of stimulus to rapidity of habit-formation. J Comp Neurol Psychol 1908; 18:459–482Crossref, Google Scholar
44. Gur RC, Gur RE, Resnick SM, Skolnick BE, Alavi A, Reivich M: The effect of anxiety on cortical cerebral blood flow and metabolism. J Cereb Blood Flow Metab 1987; 7:173–177Crossref, Medline, Google Scholar
45. Rodriguez G, Cogorno P, Gris A, Marenco S, Mesiti C, Nobili F, Rosadini G: Regional cerebral blood flow and anxiety: a correlation study in neurologically normal patients. J Cereb Blood Flow Metab 1989; 9:410–416Crossref, Medline, Google Scholar
46. Zohar J, Insel TR, Berman KF, Foa EB, Hill JL, Weinberger DR: Anxiety and cerebral blood flow during behavioral challenge: dissociation of central from peripheral and subjective measures. Arch Gen Psychiatry 1989; 46:505–510Crossref, Medline, Google Scholar
47. Johanson A, Gustafson L, Passant U, Risberg J, Smith G, Warkentin S, Tucker D: Brain function in spider phobia. Psychiatry Res 1998; 84:101–111Crossref, Medline, Google Scholar
48. Woods SW, Koster K, Krystal JK, Smith EO, Zubal IG, Hoffer PB, Charney DS: Yohimbine alters regional cerebral blood flow in panic disorder (letter). Lancet 1988; 2:678Crossref, Medline, Google Scholar
49. Bremner JD, Narayan M, Staib LH, Southwick SM, McGlashan T, Charney DS: Neural correlates of memories of childhood sexual abuse in women with and without posttraumatic stress disorder. Am J Psychiatry 1999; 156:1787–1795Abstract, Google Scholar
50. Bremner JD, Innis RB, White T, Fujita M, Silbersweig D, Goddard AW, Staib L, Stern E, Cappiello A, Woods S, Baldwin R, Charney DS: SPECT [I-123]iomazenil measurement of the benzodiazepine receptor in panic disorder. Biol Psychiatry 2000; 47:96–106Crossref, Medline, Google Scholar
51. Stewart RS, Devous MD Sr, Rush AJ, Lane L, Bonte FJ: Cerebral blood flow changes during sodium-lactate-induced panic attacks. Am J Psychiatry 1988; 145:442–449Link, Google Scholar
52. Mathew RJ, Weinman ML, Claghorn JL: Anxiety and cerebral blood flow, in The Biology of Anxiety. Edited by Mathew RJ, Feldman L, Hanstock C. New York, Brunner/Mazel, 1982Google Scholar
53. Mathew RJ, Wilson WH: Cerebral blood flow changes induced by CO2 in anxiety. Psychiatry Res 1988; 23:285–294Crossref, Medline, Google Scholar
54. Shin LM, McNally RJ, Kosslyn SM, Thompson WL, Rauch SL, Alpert NM, Metzger LJ, Lasko NB, Orr SP, Pitman RK: Regional cerebral blood flow during script-driven imagery in childhood sexual abuse-related PTSD: a PET investigation. Am J Psychiatry 1999; 156:575–584Abstract, Google Scholar
55. LaBar KS, Gatenby JC, Gore JC, LeDoux JE, Phelps EA: Human amygdala activation during conditioned fear acquisition and extinction: a mixed-trial fMRI study. Neuron 1998; 20:937–945Crossref, Medline, Google Scholar
56. Phan KL, Wager T, Taylor SF, Liberzon I: Functional neuroanatomy of emotion: a meta-analysis of emotion activation studies in PET and fMRI. Neuroimage 2002; 16:331–348Crossref, Medline, Google Scholar